South America
Argentina
Was hier aus dem Boden kommt, was noch darin steckt und wer die Anlagen betreibt.
6 Produzierte Materialien
1 Minen in der Datenbank
0 Anlagen in der Datenbank
Was es produziert
Karten →USGS Mineral Commodity Summaries 2026 · 2025 (geschätzt) · Jede Zeile behält die Einheit, die die Quelle für den jeweiligen Rohstoff verwendet · Quelle ↗
Tabelle seitwärts scrollen, um die restlichen Spalten zu sehen.
| Material | Reihe | Produktion | Einheit | Anteil an der Weltproduktion |
|---|---|---|---|---|
| Lithium | Mine production | 23,000 | metric tons | 7.9% |
| Industrial Sand & Gravel | Mine production | 4,500 | thousand metric tons | 1.0% |
| Silver | Mine production | 800.0 | metric tons | 3.1% |
| Strontium | Mine production | 700.0 | metric tons | 0.2% |
| Diatomite | Mine production | 190.0 | thousand metric tons | 7.6% |
| Perlite | Production | 30.00 | thousand metric tons | 0.7% |
Was es als Reserve hält
USGS Mineral Commodity Summaries 2026 · Reserven gemäß letzter Veröffentlichung
| Material | Reihe | Reserven | Einheit | Anteil an der Weltproduktion |
|---|---|---|---|---|
| Lithium | Reserves | 4,400,000 | metric tons | 11.9% |
| Silver | Reserves | 6,500 | metric tons | 1.1% |
| Diatomite | Reserves | Not applicable | thousand metric tons | — |
| Perlite | Reserves | Not applicable | thousand metric tons | — |
| Strontium | Reserves | Not applicable | metric tons | — |
Minen in der Datenbank
Alle →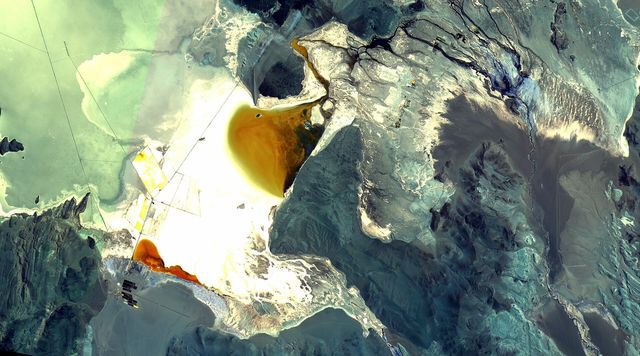
Eine führende US-Importquelle für
USGS Mineral Commodity Summaries 2026 · Wichtigste US-Importquellen, 2021–2024