The 2025 U.S. critical minerals listOne-country chokepointsEntirely imported by the U.S.Only ever a by-productThe magnet chainThe chip chainEnergy-transition materialsSmallest world production
Clear
146 materials match. Criticality, production, reserves, import reliance and leading-producer share are all USGS Mineral Commodity Summaries 2026 · source ↗
Scroll the table sideways for the remaining columns.
| Material | Shelf | World production | Reserves | Leading producer | Top share | U.S. imported |
|---|---|---|---|---|---|---|
|
Alumina critical
|
Copper & Electrical Materials | 150,000thousand metric dry tons · Alumina, refinery production | — | China | 62%† | 71% |
|
Aluminium critical
|
Copper & Electrical Materials | 74,000thousand metric tons · Smelter production | — | China | 61%† | 60% |
|
Antimony critical
|
Aerospace & Defence Materials | 110,000metric tons · Mine production | 2,000,000 | China | 36% | — |
| Industrial Minerals | not published | — | — | — | — | |
|
Arsenic critical
|
Semiconductor Materials | 61,000metric tons · Production (arsenic trioxide, gross weight) | — | Peru | 49% | 100% |
| Industrial Minerals | 960,000metric tons · Mine production | 150,000,000 | Russia | 32%† | 100% | |
|
Barite critical
|
Industrial Minerals | 8,700thousand metric tons · Mine production | — | India | 34% | 75% |
|
Bauxite critical
|
Copper & Electrical Materials | 440,000thousand metric dry tons · Bauxite, mine production | 29,000,000 | — | — | 75% |
|
Beryllium critical
|
Nuclear Materials | 430.0metric tons · Mine production | — | United States | 53% | — |
|
Bismuth critical
|
Aerospace & Defence Materials | 16,000metric tons · Refinery production | — | China | 88% | 92% |
| Wood & Forest Products | not published | — | — | — | — | |
|
Boron critical
|
Industrial Minerals | not published | — | Turkey | withheld | — |
| Industrial Minerals | 430,000metric tons · Production | — | — | — | 25% | |
| Steel & Alloy Metals | 23,000metric tons · Refinery production | — | China | 41%† | 25% | |
|
Caesium critical
|
Aerospace & Defence Materials | not published | — | — | — | 100% |
| Industrial Minerals | 3,800,000thousand metric tons · Cement production | — | China | 45%† | 21% | |
|
Cerium critical
|
Rare Earth Elements | not published | — | — | — | — |
|
Chromium critical
|
Steel & Alloy Metals | 51,000thousand metric tons · Mine production | 540,000 | South Africa | 45% | 79% |
| Industrial Minerals | 20,000thousand metric tons · Mine production: Bentonite, rounded | — | — | — | — | |
|
Cobalt critical
|
Battery Materials | 310,000metric tons · Mine production | 12,000,000 | Congo (Kinshasa) | 74% | 79% |
| Industrial Minerals | not published | — | — | — | — | |
|
Copper critical
|
Copper & Electrical Materials | 23,000thousand metric tons · Mine production | 980,000 | Chile | 23% | — |
| Energy Raw Materials | not published | — | — | — | — | |
| Industrial Minerals | not published | — | — | — | — | |
| Industrial Minerals | 38.00million carats · Mine production | 1,700 | Russia | 42%† | — | |
| Industrial Minerals | 2,500thousand metric tons · Mine production | — | United States | 29%† | — | |
| Industrial Minerals | not published | — | — | — | 85% | |
| Wood & Forest Products | not published | — | — | — | — | |
|
Dysprosium critical
|
Rare Earth Elements | not published | — | — | — | — |
|
Erbium critical
|
Rare Earth Elements | not published | — | — | — | — |
| Wood & Forest Products | not published | — | — | — | — | |
|
Europium critical
|
Rare Earth Elements | not published | — | — | — | — |
| Industrial Minerals | 31,000thousand metric tons · Mine production | — | India | 19%† | 95% | |
|
Fluorspar critical
|
Industrial Minerals | 10,000thousand metric tons · Mine production | 330,000 | China | 60% | 100% |
|
Gadolinium critical
|
Rare Earth Elements | not published | — | — | — | — |
|
Gallium critical
|
Semiconductor Materials | 900,000kilograms · Primary production | — | China | 100% | 100% |
| Industrial Minerals | 730,000metric tons · Mine production | — | Australia | 48%† | 71% | |
| Precious Metals | 69,000 thousands of carats · Mine production | 2,000,000 | Russia | 30%† | 99% | |
|
Germanium critical
|
Semiconductor Materials | not published | — | China | not published | 50% |
| Precious Metals | 3,300metric tons · Mine production | 66,000 | China | 12%† | — | |
|
Graphite critical
|
Battery Materials | 1,800,000metric tons · Mine production | 310,000,000 | China | 78% | 100% |
| Industrial Minerals | 160,000thousand metric tons · Mine production | — | United States | 12%† | — | |
|
Hafnium critical
|
Nuclear Materials | not published | — | — | — | — |
| Wood & Forest Products | not published | — | — | — | — | |
| Wood & Forest Products | not published | — | — | — | — | |
| Industrial Minerals | 190.0million cubic meters · Helium Production | — | United States | 43%† | — | |
| Wood & Forest Products | not published | — | — | — | — | |
| Semiconductor Materials | not published | — | — | — | — | |
|
Holmium critical
|
Rare Earth Elements | not published | — | — | — | — |
|
Indium critical
|
Semiconductor Materials | 1,100metric tons · Refinery production | — | China | 69% | 100% |
| Wood & Forest Products | not published | — | — | — | — | |
| Industrial Minerals | 430,000thousand metric tons · Mine production | — | United States | 28%† | — | |
| Industrial Minerals | 34,000metric tons · Mine production | 6,300,000 | — | — | 50% | |
|
Iridium critical
|
Precious Metals | not published | — | — | — | — |
| Steel & Alloy Metals | 360.0million metric tons · world iron slag production was estimated to be between 330 million and 390 million tons, | — | — | — | — | |
| Steel & Alloy Metals | not published | — | — | — | — | |
| Steel & Alloy Metals | 2,600,000thousand metric tons · Mine production: Usable ore, rounded | 87,000 | — | — | — | |
| Industrial Minerals | not published | — | — | — | — | |
| Semiconductor Materials | 110.0million liters · Rare gases production, (million liters) | — | United States | 1%† | 93% | |
| Industrial Minerals | not published | — | — | — | — | |
|
Lanthanum critical
|
Rare Earth Elements | not published | — | — | — | — |
|
Lead critical
|
Steel & Alloy Metals | 4,500thousand metric tons · Mine production | 95,000 | China | 42% | — |
| Industrial Minerals | 420,000thousand metric tons · Production | — | China | 74%† | — | |
|
Lithium critical
|
Battery Materials | 290,000metric tons · Mine production | 37,000,000 | Australia | 32% | 50% |
|
Lutetium critical
|
Rare Earth Elements | not published | — | — | — | — |
| Industrial Minerals | 21,000thousand metric tons · Mine production | 7,800,000 | — | — | 59% | |
|
Magnesium Metal critical
|
Steel & Alloy Metals | 1,100thousand metric tons · Smelter production | — | China | 86%† | 75% |
|
Manganese critical
|
Battery Materials | 20,000thousand metric tons · Mine production | 1,700,000 | South Africa | 37% | 100% |
| Wood & Forest Products | not published | — | — | — | — | |
| Steel & Alloy Metals | 210.0metric tons · Mine production | — | China | 95%† | — | |
| Energy Raw Materials | not published | — | — | — | — | |
| Industrial Minerals | not published | — | — | — | — | |
| Steel & Alloy Metals | 260,000metric tons · Mine production | 17,000 | China | 37%† | — | |
| Energy Raw Materials | not published | — | — | — | — | |
|
Neodymium critical
|
Rare Earth Elements | not published | — | — | — | — |
| Semiconductor Materials | 800.0million liters · Rare gases production, (million liters) | — | United States | 14%† | 52% | |
|
Nickel critical
|
Battery Materials | 3,900,000metric tons · Mine production | 140,000,000 | Indonesia | 67% | 41% |
|
Niobium critical
|
Aerospace & Defence Materials | 112,000metric tons · Mine production | 21,000,000 | Brazil | 93%† | 100% |
| Agricultural Minerals | 160,000thousand metric tons · Plant production | — | China | 31%† | — | |
| Energy Raw Materials | not published | — | — | — | — | |
| Wood & Forest Products | not published | — | — | — | — | |
| Precious Metals | not published | — | — | — | — | |
|
Palladium critical
|
Precious Metals | 190,000kilograms · Mine production: Palladium, rounded | — | Russia | 44% | 57% |
| Energy Raw Materials | 17,000thousand metric tons · Mine production | 13,000,000 | Finland | 15%† | 80% | |
| Industrial Minerals | 4,600thousand metric tons · Production | — | China | 33%† | 23% | |
| Energy Raw Materials | not published | — | — | — | — | |
|
Phosphate Rock critical
|
Agricultural Minerals | 250,000thousand metric tons · Mine production | 73,000,000 | China | 44% | — |
|
Platinum critical
|
Precious Metals | 170,000kilograms · Mine production: Platinum, rounded | — | South Africa | 71% | 89% |
|
Platinum-Group Metals critical
|
Precious Metals | not published | 76,000,000 | — | — | — |
| Wood & Forest Products | not published | — | — | — | — | |
|
Potash critical
|
Agricultural Minerals | 49,000thousand metric tons · Mine production | 10,000,000 | Canada | 31% | 92% |
|
Praseodymium critical
|
Rare Earth Elements | not published | — | — | — | — |
| Rare Earth Elements | not published | — | — | — | — | |
| Industrial Minerals | 20,000thousand metric tons · Mine production | — | Turkey | 48%† | — | |
| Wood & Forest Products | not published | — | — | — | — | |
|
Rare Earths (all) critical
|
Rare Earth Elements | 390,000metric tons · Mine production | 85,000,000 | China | 69%† | — |
| Wood & Forest Products | not published | — | — | — | — | |
| Wood & Forest Products | not published | — | — | — | — | |
|
Rhenium critical
|
Aerospace & Defence Materials | 81,000kilograms · Mine production | — | Chile | 37% | 75% |
|
Rhodium critical
|
Precious Metals | not published | — | — | — | — |
|
Rubidium critical
|
Aerospace & Defence Materials | not published | — | — | — | 100% |
|
Ruthenium critical
|
Precious Metals | not published | — | — | — | — |
| Industrial Minerals | 270,000thousand metric tons · Mine production | — | China | 21%† | 31% | |
|
Samarium critical
|
Rare Earth Elements | not published | — | — | — | — |
|
Scandium critical
|
Rare Earth Elements | 80.00metric tons · global production | — | China | not published | 100% |
| Steel & Alloy Metals | 3,800metric tons · Refinery production | — | China | 53%† | 50% | |
|
Silicon critical
|
Semiconductor Materials | 5,000thousand metric tons · Ferrosilicon | — | China | 87% | — |
| Industrial Minerals | not published | — | — | — | — | |
|
Silver critical
|
Precious Metals | 26,000metric tons · Mine production | 610,000 | Mexico | 24% | 77% |
| Industrial Minerals | 19,000thousand metric tons · Mine production: natural, rounded | 25,000,000 | — | — | — | |
| Wood & Forest Products | not published | — | — | — | — | |
| Wood & Forest Products | not published | — | — | — | — | |
| Wood & Forest Products | not published | — | — | — | — | |
| Wood & Forest Products | not published | — | — | — | — | |
| Industrial Minerals | 450,000metric tons · Mine production | — | Iran | 56%† | 100% | |
| Industrial Minerals | 84,000thousand metric tons · Production, all forms | — | China | 23%† | — | |
| Industrial Minerals | 6,900thousand metric tons · Mine production | — | Korea, Republic of | 4%† | — | |
|
Tantalum critical
|
Aerospace & Defence Materials | 2,500metric tons · Mine production | — | Congo (Kinshasa) | 52% | 100% |
| Wood & Forest Products | not published | — | — | — | — | |
|
Tellurium critical
|
Semiconductor Materials | 1,000metric tons · Refinery production | — | China | 80% | 25% |
|
Terbium critical
|
Rare Earth Elements | not published | — | — | — | — |
| Semiconductor Materials | not published | — | — | — | — | |
| Energy Raw Materials | not published | — | — | — | — | |
| Nuclear Materials | not published | — | — | — | — | |
|
Thulium critical
|
Rare Earth Elements | not published | — | — | — | — |
|
Tin critical
|
Steel & Alloy Metals | 290,000metric tons · Mine production | 6,000,000 | China | 24% | — |
|
Titanium critical
|
Aerospace & Defence Materials | 370,000metric tons · Titanium sponge metal production | — | China | 70%† | — |
|
Titanium Mineral Concentrates critical
|
Aerospace & Defence Materials | 9,400thousand metric tons · Mine production: ilmenite, rounded | 490,000 | — | — | 88% |
|
Tungsten critical
|
Aerospace & Defence Materials | 85,000metric tons · Mine production | 4,700,000 | China | 79% | 50% |
| Nuclear Materials | not published | — | — | — | — | |
|
Vanadium critical
|
Steel & Alloy Metals | 110,000metric tons · Mine production | 21,000 | China | 75% | 41% |
| Industrial Minerals | 460.0thousand metric tons · Mine production | — | South Africa | 35%† | 25% | |
| Wood & Forest Products | not published | — | — | — | — | |
| Wood & Forest Products | not published | — | — | — | — | |
| Industrial Minerals | 860,000metric tons · Mine production | — | — | — | — | |
| Wood & Forest Products | not published | — | — | — | — | |
| Wood & Forest Products | not published | — | — | — | — | |
| Wood & Forest Products | not published | — | — | — | — | |
| Wood & Forest Products | not published | — | — | — | — | |
| Semiconductor Materials | 12.00million liters · Rare gases production, (million liters) | — | United States | 1%† | 98% | |
| Wood & Forest Products | not published | — | — | — | — | |
|
Ytterbium critical
|
Rare Earth Elements | not published | — | — | — | — |
|
Yttrium critical
|
Rare Earth Elements | 12,500metric tons · mine production of Y2O3 equivalent contained in rare-earth mineral concentrates | — | China | not published | 100% |
| Industrial Minerals | 1,300,000metric tons · Mine production | — | Slovakia | 22%† | — | |
|
Zinc critical
|
Steel & Alloy Metals | 13,000thousand metric tons · Mine production | 240,000 | China | 32% | — |
|
Zirconium critical
|
Nuclear Materials | 1,200thousand metric tons · Zirconium mineral concentrates, mine production (thousand metric tons, gross weight) | 70,000 | Australia | 33%† | — |




† Worked out from the USGS production table: the leading country’s output divided by the world total. Where the USGS publishes the share itself, that figure is shown instead.
Photographs on this page · 147
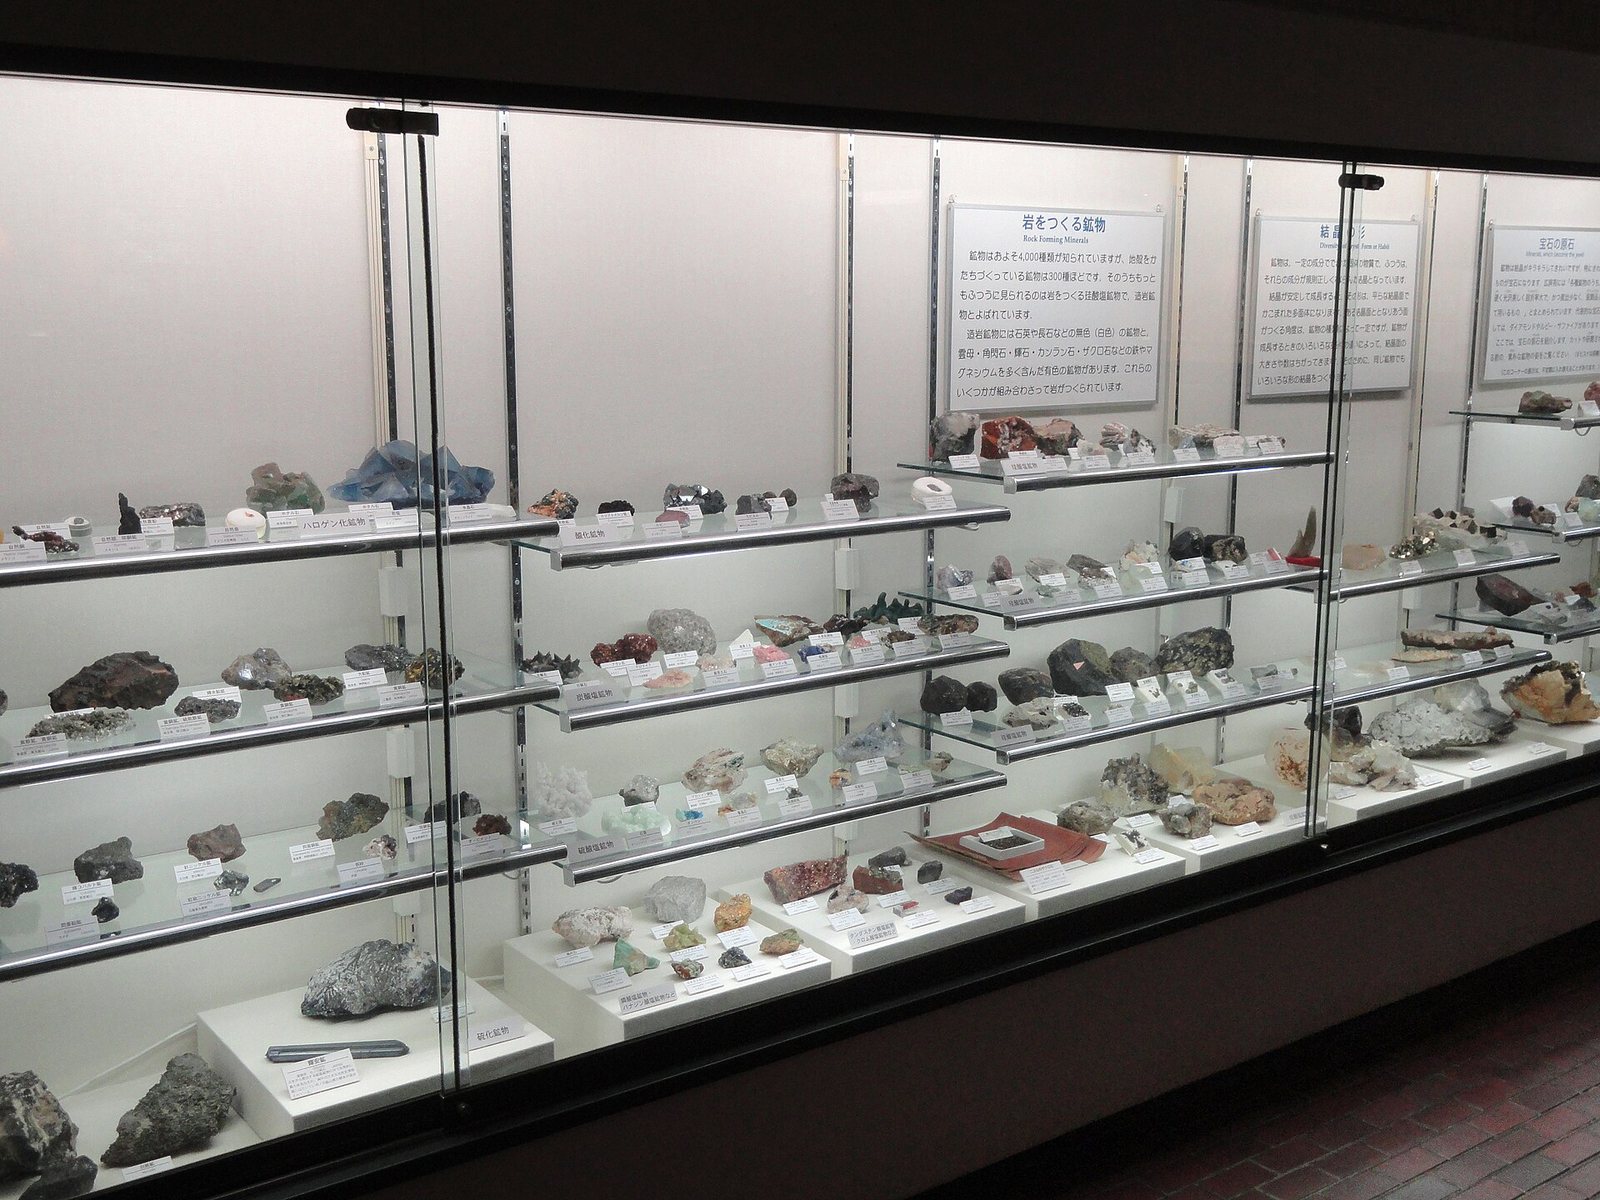
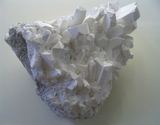
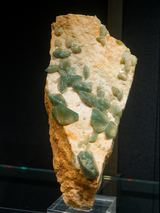
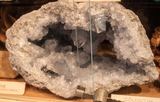
- Mineral display - Osaka Museum of Natural History - DSC07817.JPG · Daderot · CC0
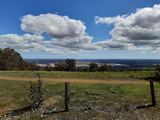
- Pinjarra Alumina Refinery, September 2020 01.jpg · Calistemon · CC BY-SA 4.0
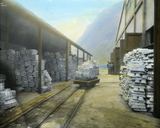
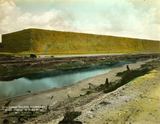
- Aluminum ingots at Norwegian Aluminium Company.jpg · Anders Beer Wilse · CC BY 4.0
- Stibnite, Antimony sulfide.jpg · Bobjgalindo · CC BY-SA 4.0
- US Navy 090715-N-5821P-002 Aviation Support Equipment Technician Airman… · U.S. Navy photo by Mass Communication Specialis… · Public domain
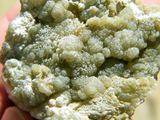
- Native arsenic2.jpg · Miguel Calvo · CC BY 4.0
- Chrysotile asbestos veins in serpentinized komatiite (Upper Komatiitic … · James St. John · CC BY 2.0
- Barite - Cerro Warihuyn, Miraflores, Huamalies, Huanuco, Peru.jpg · Ivar Leidus · CC BY-SA 4.0
- Pisolitic bauxite (Alcoa Bauxite Mine, Arkansas, USA) 5.jpg · James St. John · CC BY 2.0
- Crystal surface of colorless Beryl, multicolor filter, size 5,8 x 3,9 mm.jpg · Sepelinmurskaaja · CC BY-SA 4.0
- Bismuth crystal Créer le cristal n01.jpg · Marie-Lan Taÿ Pamart · CC BY 4.0
- Eastern Black Walnut (Juglans nigra) - Guelph, Ontario 2020-06-19.jpg · Ryan Hodnett · CC BY-SA 4.0
- Borax crystals.jpg · Aram Dulyan ( User:Aramgutang ) · Public domain
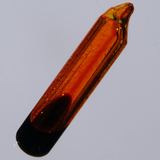
- Bromine-ampoule.jpg · Jurii · CC BY 3.0
- Cadmium (Element - 48) 3.jpg · James St. John · CC BY 2.0
- Pollucite Paprok MNHN Minéralogie.jpg · Marie-Lan Taÿ Pamart · CC BY 4.0
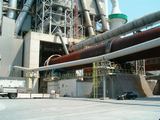
- Cement kiln in Gorazdze Cement plant.JPG · Jb957 · CC0
- Cerium (Element - 58) 2.jpg · James St. John · CC BY 2.0
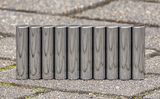
- Metal poles (surface is chromium-plated) - HDR.jpg · Laitche · CC BY-SA 4.0
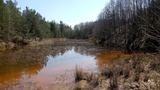
- Kaznějov kaolin quarry revitalisation.jpg · Jan Macura · CC BY-SA 4.0
- Cobaltite (GeoDIL number - 1151).jpg · Darla Sondrol · CC0
- Kongensbro gravel pit 2014-09-17.jpg · Slaunger · CC BY-SA 3.0
- Chalcopyrite botroïdale.jpg · Didier Descouens · CC BY-SA 3.0
- Pumpjacks.JPG · Arne Hückelheim · CC BY-SA 3.0
- Abandoned limestone quarry on Furilden Gotland 1.jpg · W.carter / Ann-Sophie Qvarnström · CC BY-SA 2.0
- Diamond blade very macro.jpg · Hustvedt · CC BY-SA 3.0
- Diatomite (diatomaceous earth) Monterey Formation at a diatomite quarry… · James St. John · CC BY 2.0
- Red marble quarry Cava Buscada - Erto e Casso, Pordenone, Friuli-Venezi… · Mænsard vokser · CC BY-SA 4.0
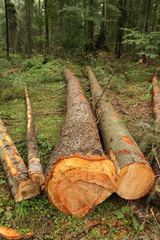
- Pseudotsuga menziesii cut trunk.jpg · Crusier · CC BY-SA 3.0
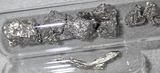
- Dysprosium (Element - 66) 2.jpg · James St. John · CC BY 2.0
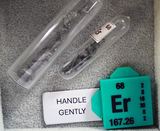
- Erbium (Element - 68).jpg · James St. John · CC BY 2.0
- CSIRO ScienceImage 714 Eucalyptus Globulus Plantation Australia.jpg · T.Grove, CSIRO · CC BY 3.0
- Europium prvek.jpg · Milda 444 · CC BY-SA 4.0
- Feldspar Mineral Museum Display Exhibit.jpg · QueenCityCebu · CC BY-SA 4.0
- Fluorite crystals.jpg · Marek Novotňák · CC BY-SA 4.0
- Gadolinium 2.jpg · Milda 444 · CC BY-SA 4.0
- Plastic bottle containing gallium metal.JPG · Pixelmaniac pictures ( Leave a reply ) · CC0
- Garnet - Spessartine crystal detail.jpg · ButtShark · CC0
- Zultanite rough crystal and gemstones.jpg · Zultgems, LLC · CC0
- Miniman M 703 germanium crystal radio made in Japan late 1950s.jpg · R. Henrik Nilsson · CC BY 4.0
- AZ Gold Nugget Quartz.jpg · Bryan Barnes · CC BY-SA 4.0
- Minerals in the Indian Museum, Kolkata 05.jpg · Kritzolina · CC BY-SA 4.0
- Gypsum crystals 1802-0312a.jpg · Mozzihh · CC BY-SA 4.0
- Hafnium (Element - 72) 2.jpg · James St. John · CC BY 2.0
- Acer saccharum (sugar maple tree in fall colors) (Newark, Ohio, USA) (2… · James St. John · CC BY 2.0
- Kirschholzbrett -- 2021 -- 7662.jpg · Dietmar Rabich · CC BY-SA 4.0
- ISS Magnet.jpg · Ordan, Julien Marius · CC BY 4.0
- Old Growth Western Hemlock Forest.jpg · Treefender K · CC BY 4.0
- Geode-with-encrustation-of-quartz-crystals-on-a-base-of-limonite-01.jpg · CEphoto, Uwe Aranas · CC BY-SA 4.0
- Holmium shards.jpg · brainandforce · CC0
- Indium wetting glass.jpg · Schtone · Public domain
- LOGGING TRUCK LOADED WITH CEDAR IN A CLEARCUT AREA OF THE QUINAULT INDI… · Gene Daniels · Public domain
- Wrotham Quarry, Addinton 07.jpg · Simon Burchell · CC BY-SA 4.0
- Iodine crystals, 99.9% purity.jpg · Dnn87 · CC BY 3.0
- Iridium (Element - 77) 2.jpg · James St. John · CC BY 2.0
- Blast furnace at Carnegie-Illinois Steel Corporation mill in Etna, Penn… · Alfred T. Palmer · Public domain
- Scrap metal yard.jpg · Digitura · CC0
- Hematite (iron ore) (weathered zone in the Biwabik Iron-Formation, Whit… · James St. John · CC BY 2.0
- Fragment of red pigment Ochre - Museo Egizio, Turin S 9927 p02.jpg · CC0
- Spectre tubes à gaz.jpg · Alchemist-hp , derivative work by Poke2001 · CC BY-SA 2.0 de
- Kyanite 5.jpg · James St. John · CC BY 2.0
- Lanthanum (Element - 57) 3.jpg · James St. John · CC BY 2.0
- Galena - Huallanca, Bologesi, Ancash, Peru.jpg · Ivar Leidus · CC BY-SA 4.0
- LimestoneKilnsTalybont.jpg · Martinvl · CC BY-SA 4.0
- Spodumene Nuristan Créer le cristal.jpg · Marie-Lan Taÿ Pamart · CC BY 4.0
- PET-schema.png · Jens Maus ( https://jens-maus.de/ ) · Public domain
- MagnesiteSaxe.jpg · Didier Descouens · CC BY-SA 4.0
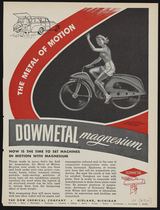
- Dowmetal Magnesium- The Metal of Motion - DPLA - 6cfddacda671bc92edb70f… · Dow Chemical Company · Public domain
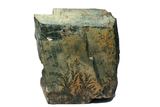
- Pyrolusite Mineral with Dendrite Macro Digon3.jpg · “Jonathan Zander ( Digon3 )" · CC BY-SA 3.0
- Ascent Building Construction Photos (20210927-FS-ML-0102).jpg · Forest Service Photography · Public domain
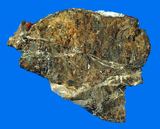
- Mercury, cinnabar and calomel (GeoDIL number - 919).jpg · Darla Sondrol · CC0
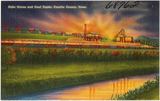
- Coke ovens and coal tipple, Fayette County, Penn (68762).jpg · Pub. by Uniontown News Agency & Co., Uniontown,… · Public domain
- Muscovite mica 2.jpg · James St. John · CC BY 2.0
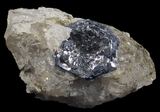
- Molybdenite quebec2.jpg · Didier Descouens · CC BY 3.0
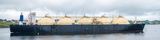
- 2023-05-20 02 LNG tanker, GULF ENERGY - IMO 7390143.jpg · Gordon Leggett · CC BY-SA 4.0
- Neodymium oxide 170g.jpg · W. Oelen · CC BY-SA 3.0
- Neon tubes (32703).jpg · Rhododendrites · CC BY-SA 4.0
- Pyrrhotite with pentlandite (late Paleoproterozoic, 1.85 Ga; 800 Orebod… · James St. John · CC BY 2.0
- 2024 Artsy Niobium Cavity - Flickr - Jefferson Lab.jpg · Jefferson Lab from Newport News, USA · Public domain
- Eliminating a minor ammonia leak at the nitrogen fertilizer plant - pan… · Tseno Tanev (цено та… · CC BY-SA 3.0
- Syncrude oil sands mine works, Mildred Lake, Alberta.jpg · Dicklyon · CC BY-SA 4.0
- Oriented strand board at Courtabœuf 2011.jpg · Lionel Allorge · CC BY-SA 3.0
- Osmium star.jpg · Bilovitskiy · CC BY 4.0
- Palladium (Element - 46) 2.jpg · James St. John · CC BY 2.0
- Industrial peat harvesting in a section of the Bog of Allen in County O… · Sarah777 · Public domain
- Expanded & popped perlite (Hollinger Quarry, Wilson Creek Range, Nevada… · James St. John · CC BY 2.0
- Petrolkoks IMG 6166.jpg · romanm ( talk ) · CC BY-SA 2.5 si
- Apatite Sapo Mine Minéraux SU.jpg · Marie-Lan Taÿ Pamart · CC BY 4.0
- Wellgreen Platinum project in Yukon (22284209294).jpg · MINING.com · CC BY 2.0
- Elektrociepłownia PGE Toruń1.jpg · Mateuszgdynia · CC BY-SA 4.0
- Sandakan Sabah Plywood-Factory-35c.jpg · CEphoto, Uwe Aranas · CC BY-SA 3.0
- Sylvite-halite-carnallite-polyhalite (Salado Formation, Upper Permian; … · James St. John · CC BY 2.0
- Praseodymium (Element - 59) 2.jpg · James St. John · CC BY 2.0
- Promethium (Element - 61) 1.jpg · James St. John · CC BY 2.0
- Pumice stones.JPG · Mauro Cateb · CC BY-SA 3.0
- Radiata pine forest in Auckland.jpg · Max Tweddell · CC BY-SA 4.0
- Mountain Pass Rare Earth Mine, Mountain Pass, California (15470415247).jpg · Ken Lund from Reno, Nevada, USA · CC BY-SA 2.0
- Tower of blue wooden pallets at Safeway 1.jpg · Ser Amantio di Nicolao · CC0
- Old, multiple-trunked northern red oak (Quercus rubra), Tiadaghton Stat… · Nicholas A. Tonelli from Northeast Pennsylvania, USA · CC BY 2.0
- Rhenium metal.jpg · Keresluna · CC BY-SA 4.0
- Rhodium powder pressed melted.jpg · Alchemist-hp ( talk ) www.pse-mendelejew.de der… · CC BY-SA 3.0 de
- Rb5.JPG · Dnn87 · CC BY 3.0
- Ru metal 1g.JPG · Leiem · CC BY-SA 4.0
- UFO-shaped constructions in the underground lake, Mina Terezia, Turda s… · DimiTalen · CC0
- Samarium shards.jpg · brainandforce · CC0
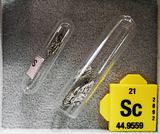
- Scandium (Element - 21).jpg · James St. John · CC BY 2.0
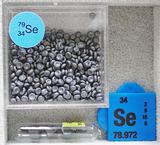
- Selenium (Element - 34).jpg · James St. John · CC BY 2.0
- Wafer 20110212.jpg · Sangitiana Fararano · CC BY-SA 2.0
- Craftsman hand-carving a traditional stone grinding wheel (chakki), Kha… · Suyash Dwivedi · CC BY-SA 4.0
- Native silver 1.jpg · Parent Géry · CC BY-SA 3.0
- Trona - USGS Mineral Specimens 1116.jpg · Andrew Silver · Public domain
- Stacked wood planks (Unsplash).jpg · Alex Jones alexjones · CC0
- Big Woods State Forest loblolly plantation.jpg · Antepenultimate · CC BY-SA 4.0
- Black spruce stand at Arctic Chalet, Inuvik, NT.jpg · Daniel Case · CC BY-SA 3.0
- Stand re-initiation of shade-tolerant spruce and fir beneath a closed c… · NPS · Public domain
- Celestine from Madagascar in the Mineral Museum of Siófok.jpg · Szilas · Public domain
- Union Sulphur Co Reserve Sulphur Storage in Louisiana.jpg · Underwood and Underwood · Public domain
- Talc-386099.jpg · John Krygier · Public domain
- Polymer Tantalum Capacitor Cross Section.jpg · TubeTimeUS · CC BY-SA 4.0
- Nilambur Teak Plantation 0384.jpg · Vengolis · CC BY-SA 4.0
- Tellurium crystals.jpg · Hi-Res Images of Chemical Elements · CC BY 3.0
- Terbium prvek.jpg · Milda 444 · CC BY-SA 4.0
- Thallium prvek.jpg · Milda 444 · CC BY-SA 4.0
- DRAGLINE (USED IN STRIP MINING) AT THE NAVAJO COAL MINE IN NORTHERN ARI… · Lyntha Scott Eiler · Public domain
- Yellowing of thorium lenses.jpg · El Grafo · CC BY-SA 4.0
- Thulium prvek.jpg · Milda 444 · CC BY-SA 4.0
- Cassiterite (GeoDIL number - 37).jpg · Shannon Heinle · CC0
- Titanium sponge cylinder, 120 grams.jpg · Hi-Res Images of Chemical Elements · CC BY 3.0
- Ilmenite sand.jpg · Mx. Granger · CC0
- Wolframiteportugal2.jpg · Didier Descouens · CC BY-SA 3.0
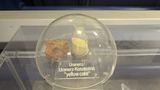
- Uranium ore and "yellowcake" uranium concentrate at the Greifswald Nucl… · Siarhei Besarab · CC BY-SA 4.0
- World- Vanadium Production,*1946 - DPLA - 3e24602f809408ce766ef8a40e074… · Central Intelligence Agency · Public domain
- Vermiculite board fireproofing 001.png · Achim Hering · CC BY 3.0
- Culturally Scarred Western Red Cedar Tree (45621625422).jpg · GlacierNPS · Public domain
- 2016.Basking.Ridge.Oak.jpg · Ekem · CC BY-SA 4.0
- Wollastonite madagascar.jpg · Didier Descouens · CC BY-SA 3.0
- Firewood stacked up.jpg · Feci1024 · CC BY 3.0
- Holzpelletslager Schlieren der energie 360° AG (2021).jpg · JoachimKohler-HB · CC BY-SA 4.0
- Kehra pulp and paper mill in Estonia (November 2021).jpg · Sillerkiil · CC BY-SA 4.0
- Particle board manufacturing process.jpg · Seedlesslime · CC BY-SA 4.0
- Three xenon flashtubes and a krypton arc lamp.jpg · Zaereth ( talk ) · Public domain
- Liriodendron tulipifera double trunk NBG LR.jpg · PumpkinSky · CC BY-SA 4.0
- Ytterbium (Element - 70) 2.jpg · James St. John · CC BY 2.0
- Piece of Yttrium.jpg · Jan Anskeit · CC BY-SA 4.0
- Estonian Museum of Natural History Specimen No 203540 photo (g232 g232-… · Tõnis Saadre · CC BY-SA 4.0
- Sphalerite - Creede, Mineral County, Colorado, USA.jpg · Ivar Leidus · CC BY-SA 4.0
- Deformed crystal of zircon.jpg · Liza Kovaleva · CC BY-SA 4.0
Every photograph is from Wikimedia Commons and is used under the licence shown.