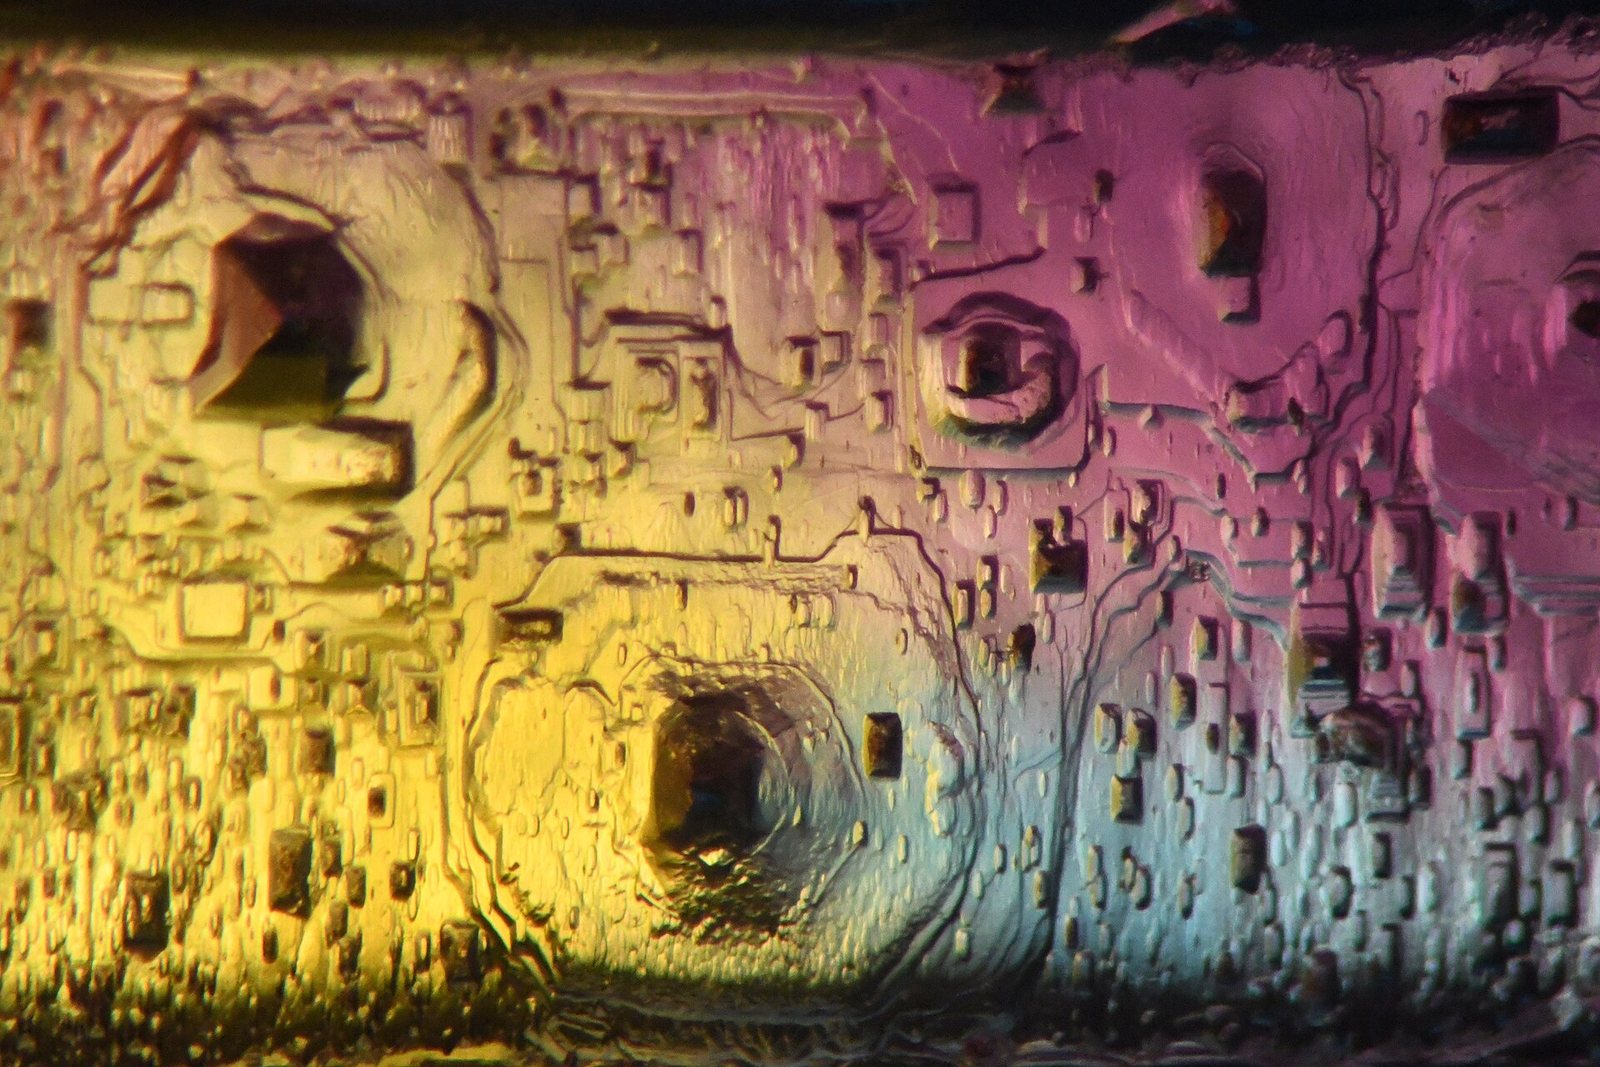
What is it?
A very light, very stiff metal that is transparent to X-rays and dangerous to breathe as dust.
Why does it matter?
Beryllium is stiffer than steel at a quarter the weight, which is why it is in satellite optics, missile guidance and the James Webb telescope's mirrors.
Where it is in the Earth
Beryllium is one of the rarest elements in the Earth's crust, and its scarcity means that only a handful of geological processes can concentrate it to levels worth mining. The most important of these is the crystallisation of pegmatites — exceptionally coarse-grained igneous rocks that form when a cooling magma body still carries a large fraction of hot, water-rich fluid. Because beryllium does not fit easily into the crystal lattices of the common rock-forming minerals, it is progressively rejected as those minerals crystallise, becoming more and more concentrated in the residual fluid until it finally precipitates as beryl (beryllium aluminium silicate). Beryl is the mineral most people associate with beryllium, and in its gem-quality forms it is better known as emerald or aquamarine, but the pale, unremarkable crystals found in industrial pegmatites are what supplied most of the world's beryllium for much of the twentieth century.
The deposit type that now dominates commercial production is different in character. Bertrandite ore, the principal source today, forms in a process called hydrothermal alteration, where hot, chemically active fluids move through existing volcanic rocks — particularly rhyolites, which are silica-rich lavas — and selectively leach beryllium from one zone, then deposit it in another as the fluids cool or change composition. The result is a large, low-grade but spatially predictable body of rock in which beryllium is disseminated through a soft, altered volcanic sequence. The deposit at Spor Mountain in Utah, which underpins United States production and by extension a large share of world supply, is exactly this kind of body. The tuffaceous (volcanic ash-derived) host rocks there were altered by fluids associated with younger volcanic activity, concentrating bertrandite across a broad, mineable area.
Why do deposits of either type sit where they sit? Ultimately, both require a source of beryllium-enriched magma or fluid, a physical and chemical mechanism for concentration, and a rock environment that preserves the deposit over geological time. Stable continental interiors and ancient cratons tend to host the pegmatite-type deposits — parts of Brazil, West Africa and Central Asia have suites of old granitic rocks that produce beryl as a by-product of mining for other minerals such as tantalum or tin. The bertrandite-type deposits favour regions of relatively young volcanic activity, which is why the Basin and Range province of the western United States is the most productive source in the world today.
Getting it out
The method used to mine beryllium ore depends almost entirely on the geometry and grade of the deposit. The bertrandite ores at Spor Mountain are mined by open-pit methods: the overburden — the rock and soil that sits above the ore — is stripped away by heavy earthmoving equipment, and the soft altered volcanic rock is excavated in benches. Open-pit mining suits this deposit because the ore body is broad, relatively shallow, and the host material is weak enough that it does not require blasting in the same way a hard-rock mine would. The mined material is then transported directly to a processing facility, in this case located at nearby Delta, Utah.
Grade is a central concept in any discussion of ore economics. Grade, in this context, means the concentration of the valuable element in the rock — how many grams or kilograms of beryllium are present per tonne of material mined. Bertrandite ores are low-grade by the standards of most metals, meaning the concentration of beryllium is small and large volumes of rock must be moved to yield a modest amount of product. The ratio of waste moved to ore extracted — called the strip ratio — and the ratio of ore processed to product recovered together determine whether a deposit can be mined economically. Because beryllium commands a high price relative to its weight, these economics can still work at grades that would be unviable for a base metal.
Beryl, by contrast, is typically recovered not from dedicated beryllium mines but as a by-product of pegmatite mining operations whose primary targets are other minerals — columbite-tantalite (a source of tantalum and niobium) in Nigeria and Rwanda, for instance, or feldspar and mica elsewhere. In those settings, beryl crystals are hand-sorted or mechanically separated from the crushed ore, and the economics of recovery depend heavily on the price and output of the primary product. This by-product character makes African and Brazilian production somewhat contingent: if the primary metal market softens, beryl recovery may slow or stop regardless of beryllium demand.
What pulls on it
Beryllium is not a high-volume commodity. Total world mine production in 2025 stood at 430 metric tons of contained beryllium — a quantity that would fit comfortably in a few freight containers. Yet the applications that consume it are disproportionately consequential. The defining characteristic of beryllium as a structural material is its combination of very low density (1.85 grams per cubic centimetre, lighter than aluminium) and exceptionally high stiffness — its modulus of elasticity, which measures resistance to bending or stretching, is much higher than that of steel despite the weight difference. This combination is irreplaceable in applications where every gram matters and where components must not flex, vibrate or distort under load or temperature change.
Aerospace and defence account for the dominant share of consumption, encompassing inertial navigation systems (the gyroscopes and accelerometers in missiles, aircraft and spacecraft that measure movement without reference to an external signal), satellite structures, optical components and, famously, the mirror substrates of space telescopes. These applications are not price-sensitive in the way consumer products are: a missile guidance system or a space telescope mirror is specified to use beryllium because no other material achieves the required performance, and the cost of the beryllium is small relative to the total programme cost. Copper-beryllium alloys — in which beryllium is a minor addition that dramatically increases strength and conductivity — are used more broadly in springs, connectors and precision instruments, and this segment provides a larger volume of consumption but at lower beryllium intensity per part.
What would have to change for demand to shift sharply? Growth in space launch activity, defence modernisation programmes and precision electronics all point toward steady or gently rising demand in the established end uses. A sharp contraction would most likely require either a fundamental change in the design philosophy of inertial navigation — for example, a shift to optical or chip-scale sensors that use different materials — or a prolonged reduction in defence and space spending by the countries that dominate procurement. Neither shift appears imminent, but both are conceivable over a decade or more. Demand is not so much growing in spectacular fashion as it is persistent: the applications that need beryllium continue to need it, and new programmes tend to specify it when they replicate the performance requirements of older ones.
Where it comes from in the rock
All ore minerals →These are the minerals that actually carry beryllium. A deposit is only an orebody if one of them is concentrated enough to pay for digging it up.
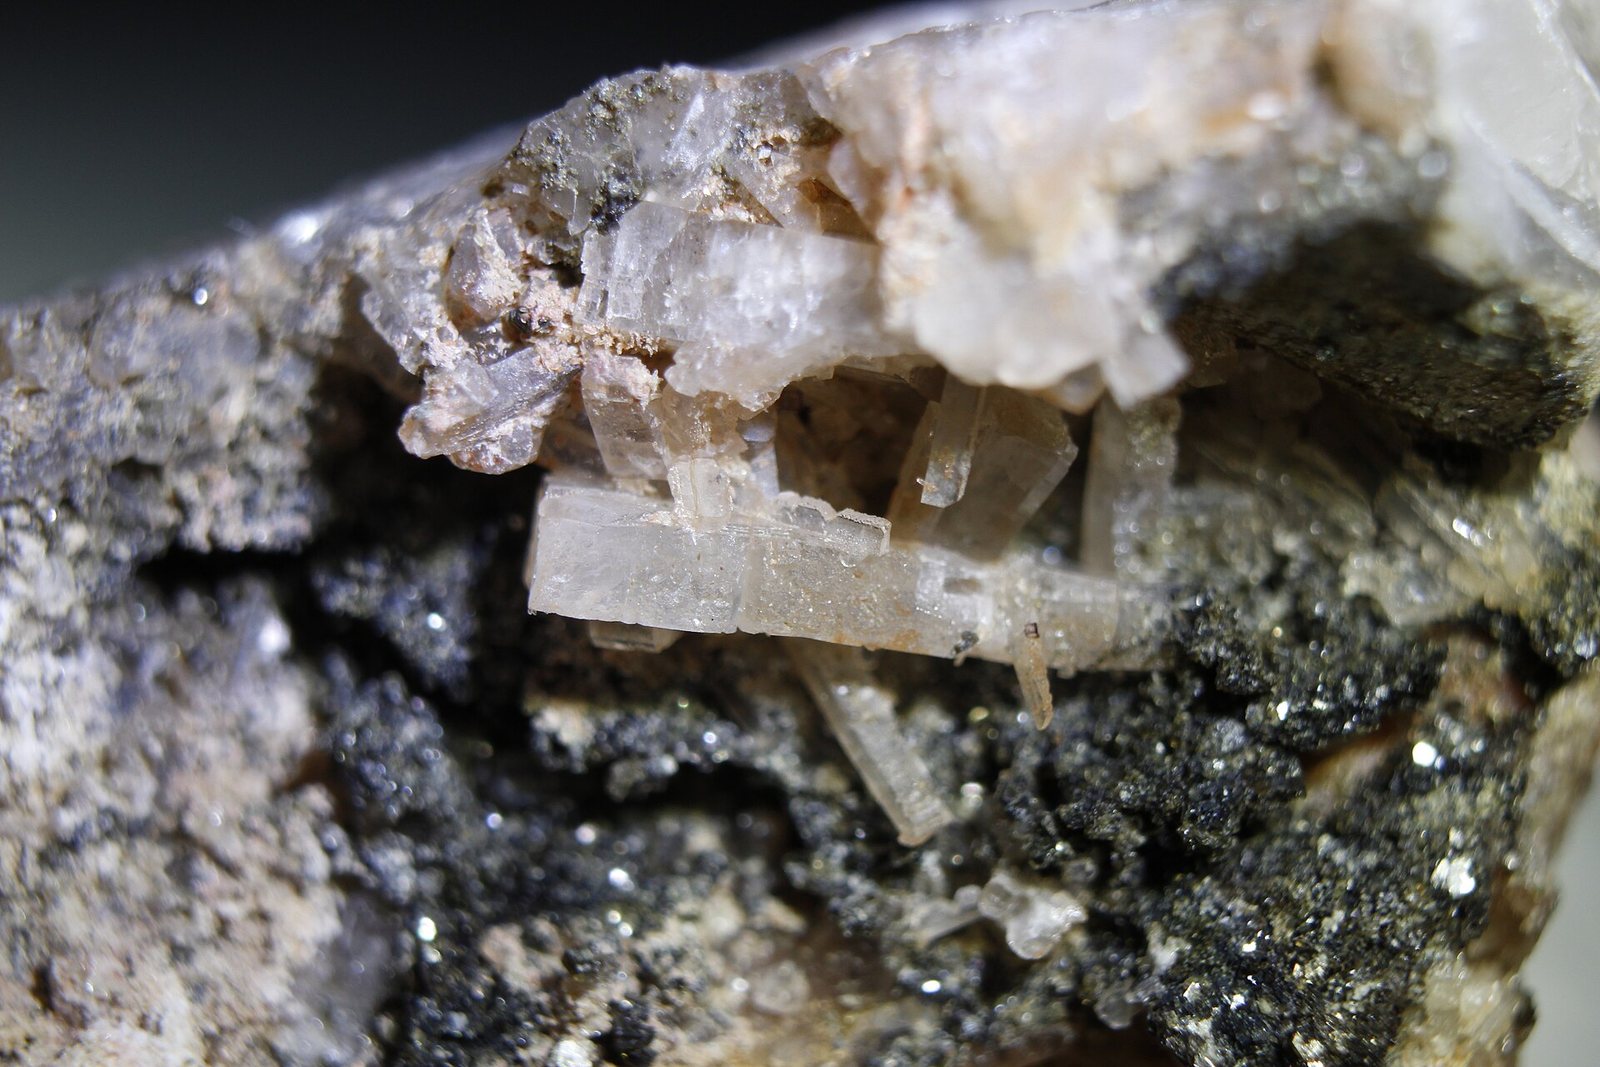
Bertrandite
A low-grade beryllium silicate in volcanic tuff, and the source of most Western beryllium production.
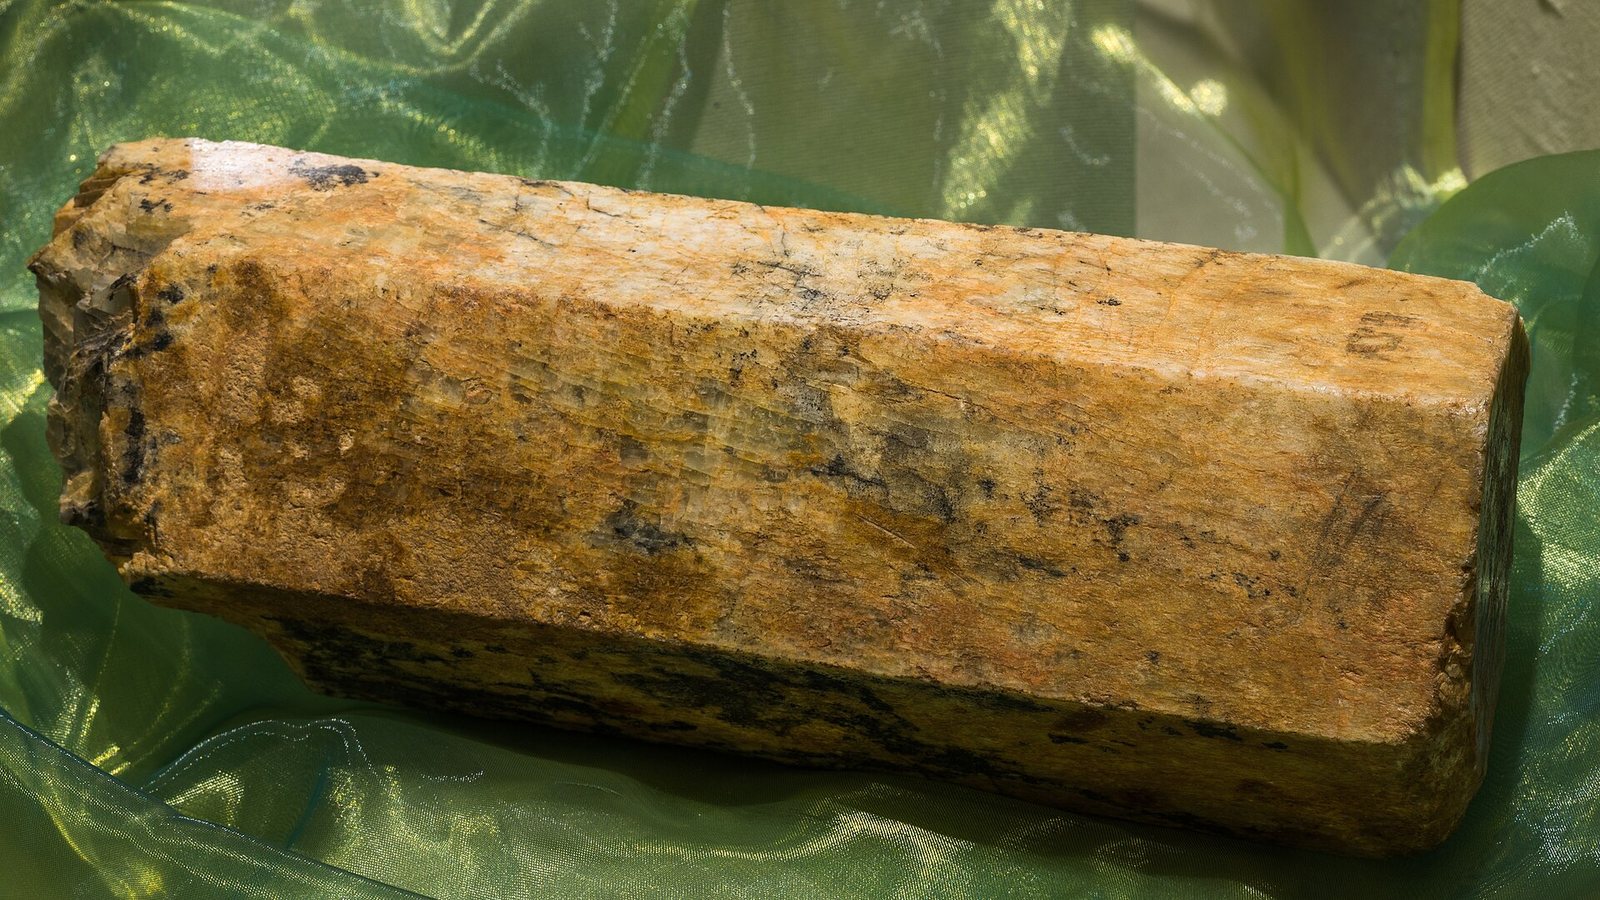
Beryl
The classic beryllium mineral. Most commercial beryllium now comes from bertrandite, a lower-grade but far more…
Who produces it
See it on a map →Mine production
Mine productionmetric tons 2025 (estimated) World total 430.0 metric tons
USGS Mineral Commodity Summaries 2026 · Mine production of contained beryllium, mostly from bertrandite ore. · source ↗
Scroll the table sideways for the remaining columns.
| Country | Production | Share of world |
|---|---|---|
| United States | 230.0 | 53.5% |
| Brazil | 80.00 | 18.6% |
| China | 77.00 | 17.9% |
| Nigeria | 40.00 | 9.3% |
| Mozambique | 3.00 | 0.7% |
| Madagascar | 1.00 | 0.2% |
| Rwanda | 1.00 | 0.2% |
| World total | 430.0 | 100% |
“Withheld” means the USGS suppressed the figure to avoid disclosing an individual company's data — it does not mean zero. Country rows do not always sum to the world total because the source rounds each figure independently and does not always break out an “other countries” line.
Price
annual average unit value, beryllium-copper master alloy, dollars per kilogram of contained beryllium
Annual averagedollars per kilogram
Basis: annual average unit value, beryllium-copper master alloy, dollars per kilogram of contained beryllium. Annual averages as published in USGS Mineral Commodity Summaries 2026 · source ↗. These are reference annual averages, not a live market quote.
What it is used for
All end markets →| End market | What it does there | Importance |
|---|---|---|
| Aerospace & Defence | Optics and inertial guidance | Important |