¿Qué es?
Rock full of the element phosphorus — the P in fertiliser, and now the P in the LFP batteries used in most new electric cars in China.
¿Por qué importa?
No plant grows without phosphorus and there is no synthetic substitute. The same rock now also feeds the cheapest, safest lithium-battery chemistry.
Where it is in the Earth
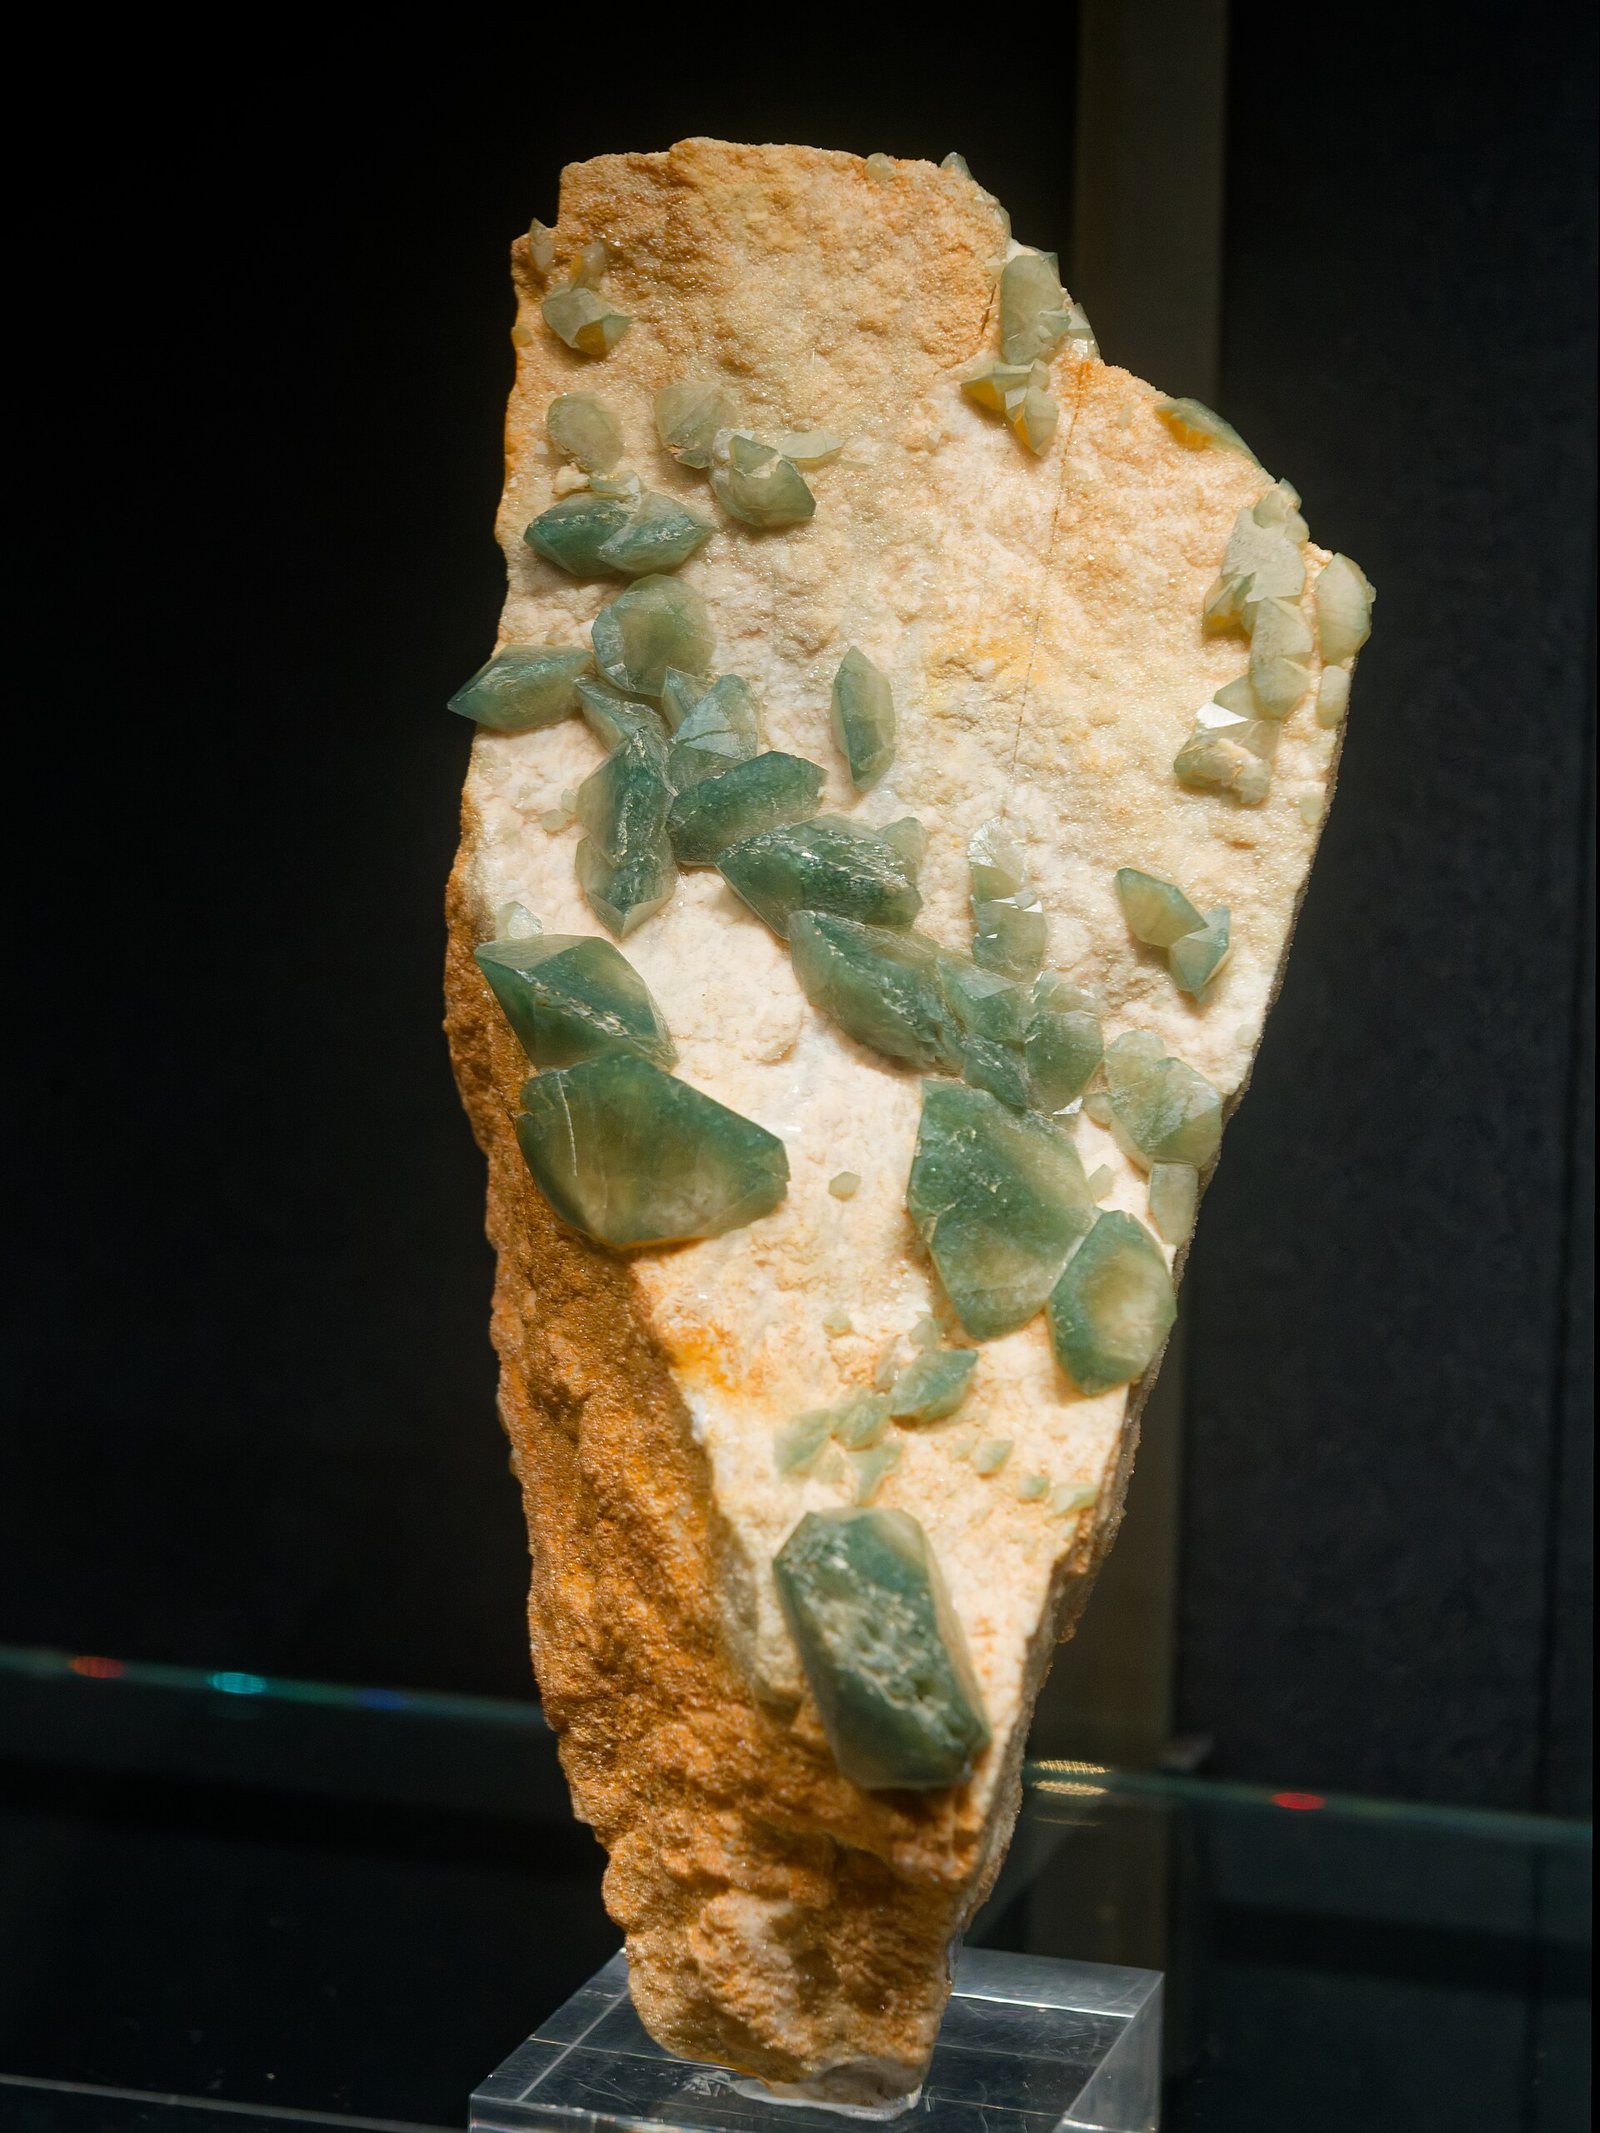
Phosphorus is not rare in the Earth's crust, but usable concentrations of it are. The mineral that carries it is apatite, a calcium phosphate that forms in several geological settings. The vast majority of the world's mined phosphate rock comes from a specific type of sedimentary deposit called phosphorite, which formed when ancient, shallow seas created the right conditions for phosphorus to precipitate out of seawater and accumulate on the seafloor over millions of years. Cold, nutrient-rich ocean currents upwelling along continental margins brought phosphorus up from the deep and delivered it to shallow shelf environments where organic matter accumulated, decayed, and slowly recrystallised into the fine-grained carbonate-fluorapatite that makes up most commercial deposits. This explains why the great sedimentary phosphate fields of Morocco, the Middle East, and North Africa all lie in a broad belt that traces the edge of an ancient ocean called the Tethys Sea.
The other main geological setting is igneous: phosphate concentrated in intrusive rock bodies called carbonatites, which form when unusual, carbonate-rich magmas cool slowly at depth. These are the dominant deposit type in Russia, Brazil, Finland, and South Africa. Igneous apatite tends to be higher grade in phosphorus but often carries iron, rare earth elements, and other minerals alongside it, which complicates processing. A third, minor setting is guano — the accumulated excrement of seabirds and bats on oceanic islands — which was historically important but now represents only a small fraction of global supply.
The distribution of reserves in the tables makes the geological story plain. Morocco's reserves dwarf every other country's precisely because the Anti-Atlas and surrounding regions sit atop an extraordinarily thick, laterally continuous sequence of Cretaceous and Eocene marine phosphorites. The gap between Morocco's reserve figure and the rest of the world is not a quirk of reporting; it reflects a genuinely exceptional geological endowment. Countries like the United States, Jordan, and Egypt also owe their deposits to the same ancient marine system, while Russia and Brazil represent the igneous carbonatite province.
Getting it out
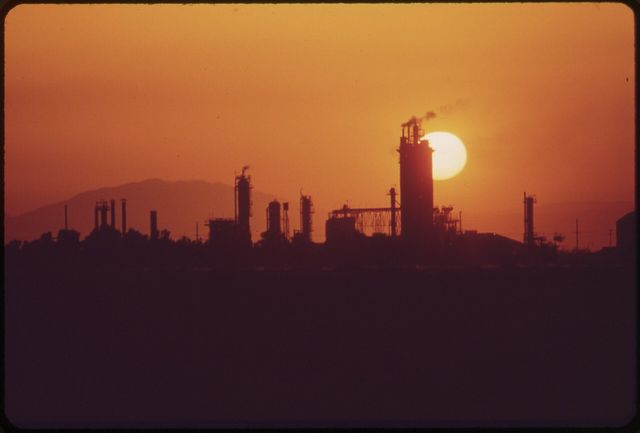
Almost all phosphate rock is won by open-pit mining, and the reason is straightforward: the sedimentary beds that host most of the world's reserves are broad, flat, and relatively shallow. Stripping away the overlying rock and soil — the overburden — and then excavating the ore in benches is more practical and far less expensive than sinking underground workings for a commodity sold at the prices the tables show. The ore is typically soft enough to be excavated directly by large shovels and scrapers without blasting, which simplifies operations and reduces cost. Draglines, a type of large excavating machine that casts a bucket forward on a cable and drags it back filled, are particularly common in the Florida and Morocco deposits.
Grade is expressed as the percentage of phosphorus pentoxide, written P₂O₅, in the rock. This is a chemical convention: analysts measure how much of the rock would convert to P₂O₅ if fully oxidised, and report that as a proxy for phosphorus content. Run-of-mine ore from a sedimentary deposit is rarely pure enough to sell directly; it must be upgraded. The ratio of waste moved to ore recovered — the strip ratio — varies by deposit but can be substantial, meaning that for every tonne of marketable rock produced, several tonnes of overburden and gangue (unwanted rock) must be handled. The tonnage figures in the production table are marketable rock after concentration, not raw material dug from the ground, so the actual scale of earth movement at these operations is considerably larger than the numbers suggest.
Igneous deposits, such as those mined in Russia's Kola Peninsula, are typically harder rock and require drilling and blasting, giving them a different cost profile. A small amount of phosphate is also recovered as a by-product from iron ore processing in certain regions, though this is a minor contributor to global supply. There is no significant brine or in-situ recovery of phosphate rock at commercial scale.
What pulls on it
Phosphorus is an essential macronutrient for all living things, and agriculture has always been the foundation of demand for phosphate rock. Plants cannot grow without it, it cannot be manufactured, and it cannot be replaced by any other element in the biochemical roles it plays — most importantly in DNA, cell membranes, and the energy-transfer molecule ATP. This makes the fertiliser industry's demand for phosphate rock essentially inelastic at the level of global food production. As the world's population has grown and diets have shifted toward higher meat consumption — which requires more grain per calorie produced — the total demand for phosphate fertiliser has grown alongside it. Farmers apply phosphate to replace what is removed from the soil in crops, and without that replacement, yields decline over time.
The end-markets table reflects a newer and rapidly growing source of demand: lithium iron phosphate, or LFP, batteries. LFP is a cathode chemistry in which iron phosphate forms the active material. It has become the dominant chemistry in electric vehicles sold in China and in stationary grid storage globally, largely because it is less expensive to produce and avoids the cobalt and nickel that other lithium battery chemistries require. The intensity figure in the table — the quantity of phosphate in a battery pack — indicates that each pack requires a meaningful quantity of processed phosphate, distinct in quality from fertiliser-grade material. As battery production has scaled, this demand segment has grown from negligible to significant within a short period. It competes with agriculture not so much for raw rock as for the higher-quality acid and precursor chemistry that sits downstream of the mine.
For demand to change sharply in either direction, the conditions would have to be unusual. A sustained decline in global food production volumes, or a large-scale shift back to organic farming at industrial scale, would reduce fertiliser demand, but neither is in prospect at any near-term horizon. On the battery side, a shift away from LFP to cathode chemistries that do not use iron phosphate — for example, back to nickel-based cathodes — would reduce that demand segment, and chemistry competition in the battery industry is real. The fertiliser demand, however, is structurally deep and unlikely to move quickly.
De dónde proviene en la roca
Todos los minerales de mena →Estos son los minerales que realmente contienen phosphate rock. Un yacimiento solo es un cuerpo mineral si uno de ellos está suficientemente concentrado para costear su extracción.
Quién lo produce
Verlo en un mapa →Mine production
Mine productionthousand metric tons 2025 (estimado) Total mundial 250,000 thousand metric tons
USGS Mineral Commodity Summaries 2026 · Tonnages are gross weight of marketable phosphate rock, not contained P2O5. · fuente ↗
Desplace la tabla lateralmente para ver las columnas restantes.
| País | Producción | Cuota mundial |
|---|---|---|
| China | 110,000 | 44.0% |
| Morocco | 36,000 | 14.4% |
| United States | 20,000 | 8.0% |
| Russia | 14,000 | 5.6% |
| Jordan | 12,000 | 4.8% |
| Saudi Arabia | 10,000 | 4.0% |
| Egypt | 5,500 | 2.2% |
| Brazil | 5,000 | 2.0% |
| Peru | 4,800 | 1.9% |
| Tunisia | 3,300 | 1.3% |
| Vietnam | 3,000 | 1.2% |
| Senegal | 2,800 | 1.1% |
| Australia | 2,500 | 1.0% |
| Israel | 2,400 | 1.0% |
| South Africa | 2,200 | 0.9% |
| Algeria | 2,000 | 0.8% |
| Kazakhstan | 1,900 | 0.8% |
| Togo | 1,600 | 0.6% |
| India | 1,500 | 0.6% |
| Turkey | 1,200 | 0.5% |
| Finland | 980.0 | 0.4% |
| Uzbekistan | 950.0 | 0.4% |
| Syria | 800.0 | 0.3% |
| Other countries | 770.0 | 0.3% |
| Mexico | 450.0 | 0.2% |
| Total mundial | 250,000 | 100% |
«Withheld» significa que el USGS suprimió el dato para evitar revelar información de una empresa concreta — no equivale a cero. Las filas por país no siempre suman el total mundial porque la fuente redondea cada cifra de forma independiente y no siempre desglosa una línea de «otros países».
Quién posee las reservas
Reserves
Reservesthousand metric tons 2025
USGS Mineral Commodity Summaries 2026 · fuente ↗
| País | Reservas | Cuota mundial |
|---|---|---|
| Morocco | 50,000,000 | 68.5% |
| China | 3,400,000 | 4.7% |
| Egypt | 2,800,000 | 3.8% |
| Tunisia | 2,500,000 | 3.4% |
| Russia | 2,400,000 | 3.3% |
| Algeria | 2,200,000 | 3.0% |
| Brazil | 1,600,000 | 2.2% |
| South Africa | 1,500,000 | 2.1% |
| Saudi Arabia | 1,000,000 | 1.4% |
| Finland | 1,000,000 | 1.4% |
| United States | 1,000,000 | 1.4% |
| Jordan | 820,000 | 1.1% |
| Australia | 800,000 | 1.1% |
| Other countries | 800,000 | 1.1% |
| Kazakhstan | 260,000 | 0.4% |
| Syria | 250,000 | 0.3% |
| Peru | 210,000 | 0.3% |
| Uzbekistan | 100,000 | 0.1% |
| Turkey | 71,000 | 0.1% |
| Israel | 60,000 | 0.1% |
| Senegal | 50,000 | 0.1% |
| India | 31,000 | 0.0% |
| Togo | 30,000 | 0.0% |
| Mexico | 30,000 | 0.0% |
| Vietnam | 30,000 | 0.0% |
| Total mundial | 73,000,000 | 100% |
Precio
average value, f.o.b. mine, dollars per metric ton
Promedio anualdollars per metric ton
Base: average value, f.o.b. mine, dollars per metric ton. Promedios anuales publicados en USGS Mineral Commodity Summaries 2026 · fuente ↗. Estos son promedios anuales de referencia, no una cotización de mercado en tiempo real.
Minas que lo producen
Todas las minas →
Dónde se procesa y refina
| Planta | Tipo | Etapa | País | Función |
|---|---|---|---|---|
| CATL Ningde Plants | Gigafábrica | Componente | China | Entrada |
Para qué se usa
Todos los mercados finales →| Mercado final | Lo que hace allí | Importancia |
|---|---|---|
| Electric Vehicles | The cathode in LFP cells | Definición de |
| Agriculture & Food | The P in NPK | Definición de |
| Grid Storage | LFP cathode | Definición de |
Cuánto necesita una tecnología
| Tecnología | Cantidad | Citado | Base |
|---|---|---|---|
| LFP Lithium-Ion Battery | 25.00–45.00 kg | per 75 kWh pack | As phosphate in the cathode |
Indicative range compiled from published technology studies and chemistry; verify against a manufacturer specification before use. Ejecute estas cifras a cualquier escala en la calculadora de materiales →