The 2025 U.S. critical minerals listOne-country chokepointsEntirely imported by the U.S.Only ever a by-productThe magnet chainThe chip chainEnergy-transition materialsSmallest world production
Clear
14 materials match. Criticality, production, reserves, import reliance and leading-producer share are all USGS Mineral Commodity Summaries 2026 · source ↗
Scroll the table sideways for the remaining columns.
| Material | Shelf | World production | Reserves | Leading producer | Top share | U.S. imported |
|---|---|---|---|---|---|---|
|
Arsenic critical
|
Semiconductor Materials | 61,000metric tons · Production (arsenic trioxide, gross weight) | — | Peru | 49% | 100% |
| Industrial Minerals | 960,000metric tons · Mine production | 150,000,000 | Russia | 32%† | 100% | |
|
Caesium critical
|
Aerospace & Defence Materials | not published | — | — | — | 100% |
|
Fluorspar critical
|
Industrial Minerals | 10,000thousand metric tons · Mine production | 330,000 | China | 60% | 100% |
|
Gallium critical
|
Semiconductor Materials | 900,000kilograms · Primary production | — | China | 100% | 100% |
|
Graphite critical
|
Battery Materials | 1,800,000metric tons · Mine production | 310,000,000 | China | 78% | 100% |
|
Indium critical
|
Semiconductor Materials | 1,100metric tons · Refinery production | — | China | 69% | 100% |
|
Manganese critical
|
Battery Materials | 20,000thousand metric tons · Mine production | 1,700,000 | South Africa | 37% | 100% |
|
Niobium critical
|
Aerospace & Defence Materials | 112,000metric tons · Mine production | 21,000,000 | Brazil | 93%† | 100% |
|
Rubidium critical
|
Aerospace & Defence Materials | not published | — | — | — | 100% |
|
Scandium critical
|
Rare Earth Elements | 80.00metric tons · global production | — | China | not published | 100% |
| Industrial Minerals | 450,000metric tons · Mine production | — | Iran | 56%† | 100% | |
|
Tantalum critical
|
Aerospace & Defence Materials | 2,500metric tons · Mine production | — | Congo (Kinshasa) | 52% | 100% |
|
Yttrium critical
|
Rare Earth Elements | 12,500metric tons · mine production of Y2O3 equivalent contained in rare-earth mineral concentrates | — | China | not published | 100% |
† Worked out from the USGS production table: the leading country’s output divided by the world total. Where the USGS publishes the share itself, that figure is shown instead.
Photographs on this page · 15
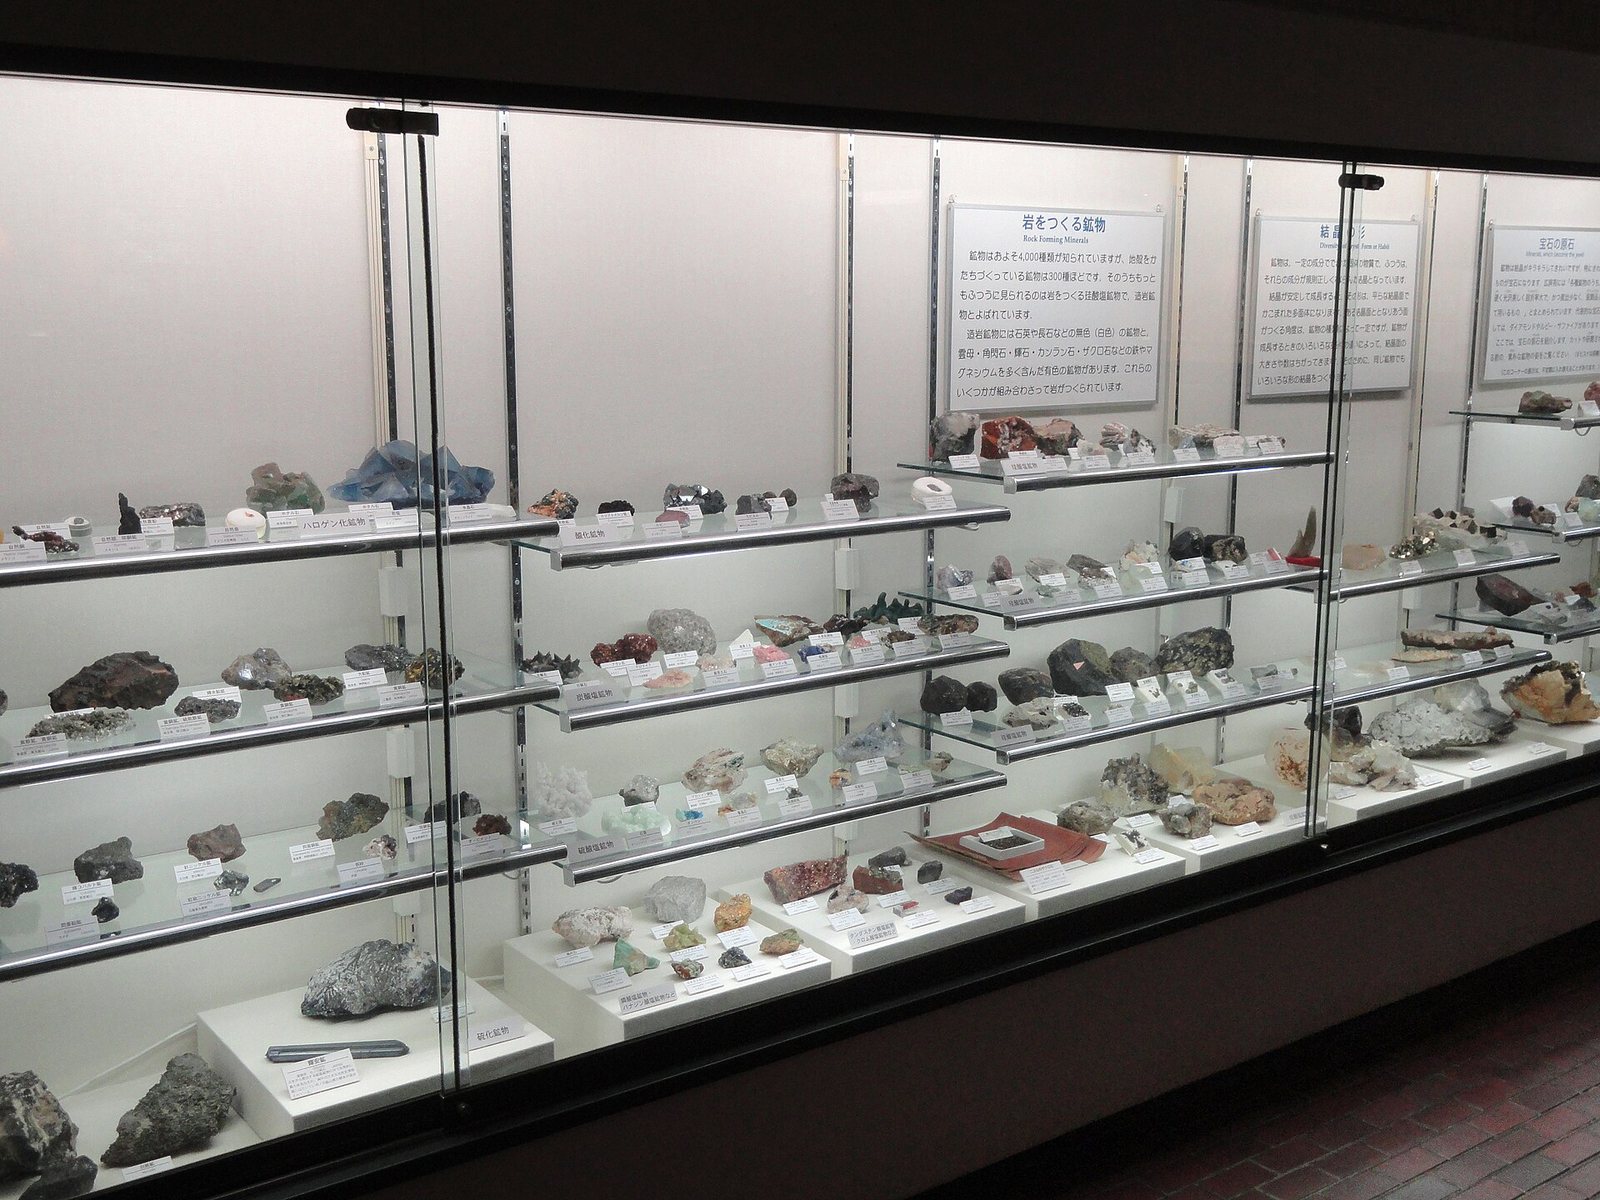
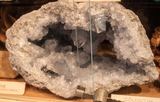
- Mineral display - Osaka Museum of Natural History - DSC07817.JPG · Daderot · CC0
- Native arsenic2.jpg · Miguel Calvo · CC BY 4.0
- Chrysotile asbestos veins in serpentinized komatiite (Upper Komatiitic … · James St. John · CC BY 2.0
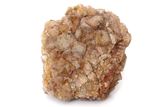
- Pollucite Paprok MNHN Minéralogie.jpg · Marie-Lan Taÿ Pamart · CC BY 4.0
- Fluorite crystals.jpg · Marek Novotňák · CC BY-SA 4.0
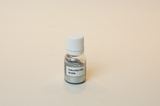
- Plastic bottle containing gallium metal.JPG · Pixelmaniac pictures ( Leave a reply ) · CC0
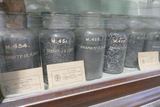
- Minerals in the Indian Museum, Kolkata 05.jpg · Kritzolina · CC BY-SA 4.0
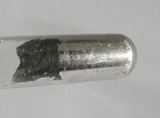
- Indium wetting glass.jpg · Schtone · Public domain
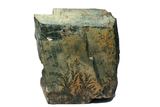
- Pyrolusite Mineral with Dendrite Macro Digon3.jpg · “Jonathan Zander ( Digon3 )" · CC BY-SA 3.0
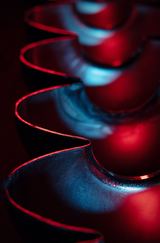
- 2024 Artsy Niobium Cavity - Flickr - Jefferson Lab.jpg · Jefferson Lab from Newport News, USA · Public domain
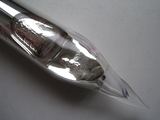
- Rb5.JPG · Dnn87 · CC BY 3.0
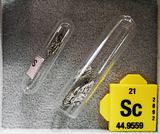
- Scandium (Element - 21).jpg · James St. John · CC BY 2.0
- Celestine from Madagascar in the Mineral Museum of Siófok.jpg · Szilas · Public domain
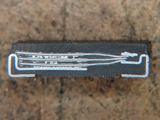
- Polymer Tantalum Capacitor Cross Section.jpg · TubeTimeUS · CC BY-SA 4.0
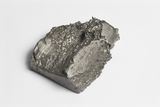
- Piece of Yttrium.jpg · Jan Anskeit · CC BY-SA 4.0
Every photograph is from Wikimedia Commons and is used under the licence shown.