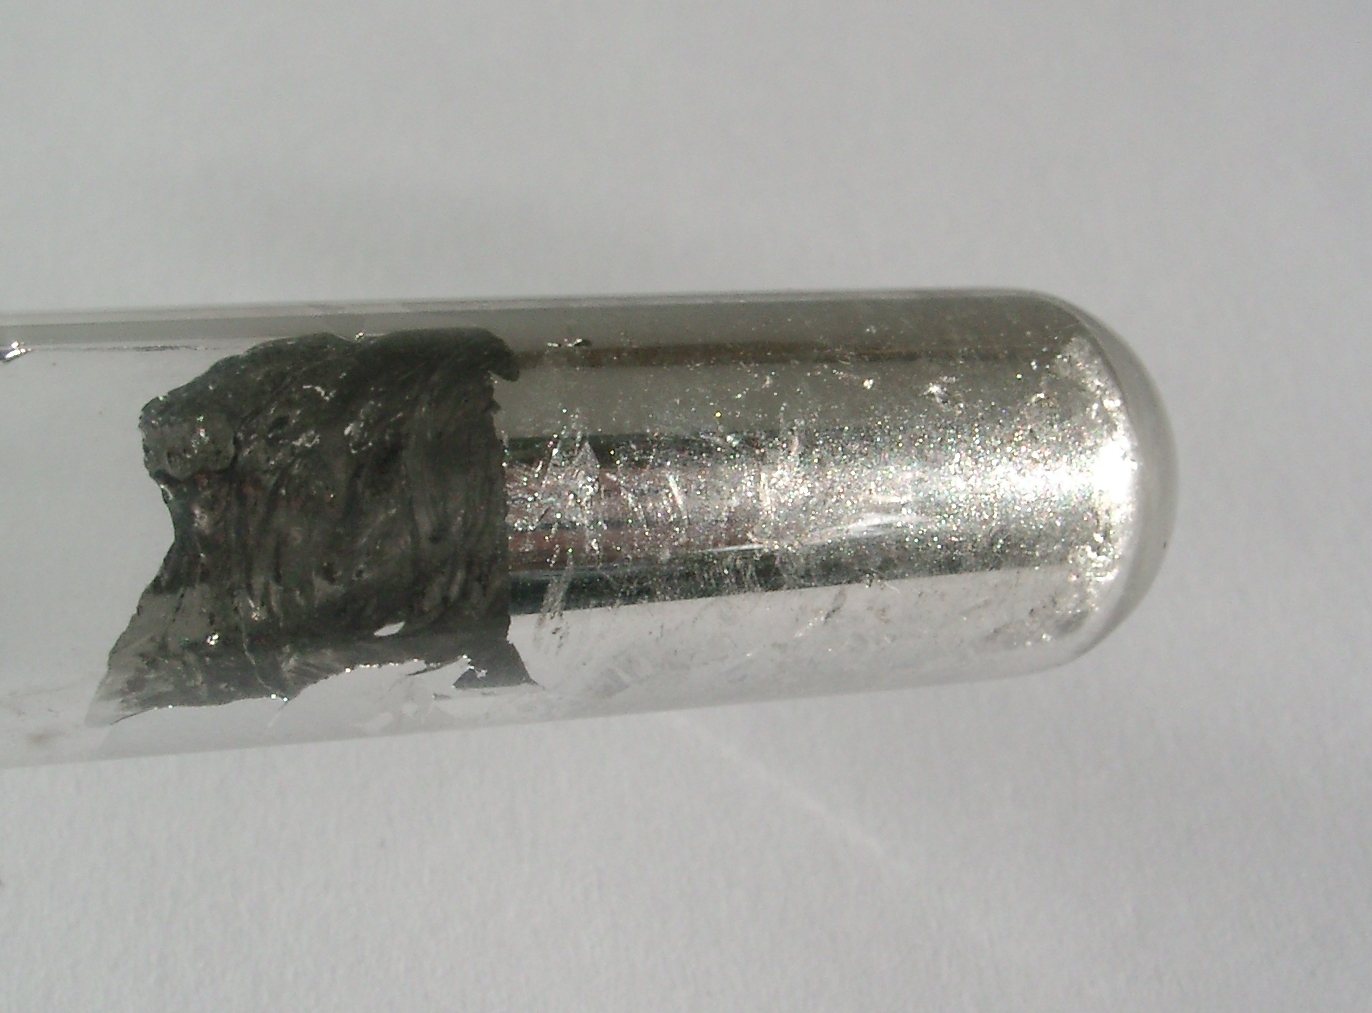
What is it?
A soft metal whose oxide is both transparent and electrically conductive — the invisible wiring on top of every touchscreen.
Why does it matter?
Indium tin oxide is the reason a screen can be conductive and see-through at the same time. Substitutes exist but none has matched it commercially at scale.
Where it is in the Earth
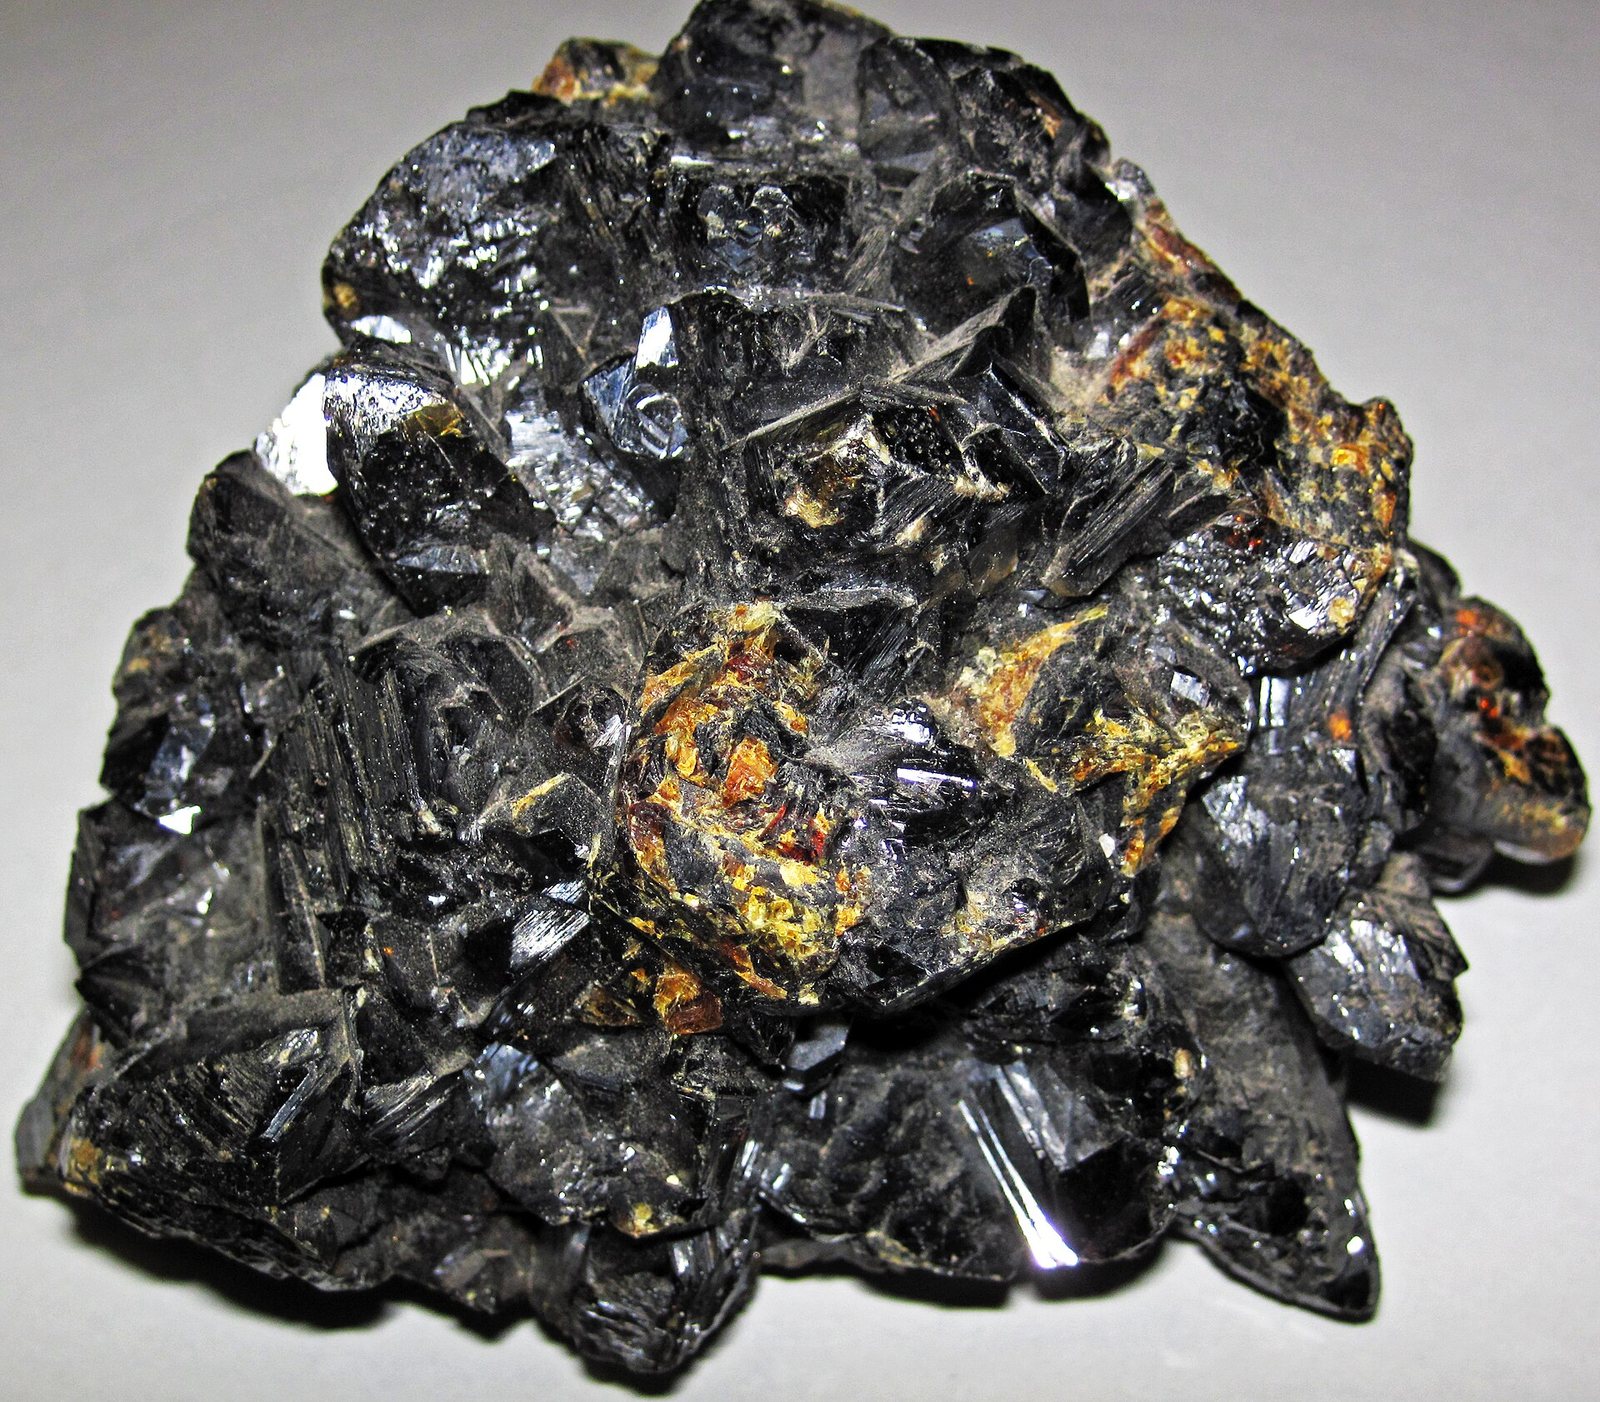
Indium is one of the rarest stable elements in the Earth's crust, and it never forms ore deposits of its own. It has no minerals in which it is the principal component at economic concentrations; instead, it hides inside the crystal lattice of sphalerite, the iron-zinc sulfide that is the world's main ore of zinc. Sphalerite forms in hydrothermal deposits — places where hot, mineral-laden water circulated through fractures in the rock and deposited sulfide minerals as it cooled. Indium substitutes for zinc atoms within the sphalerite structure because the two elements are chemically similar enough in size and charge to swap places, at least in small quantities. The result is a trace enrichment: the indium is dispersed through the sphalerite grain by grain, invisible to the eye and detectable only by chemical analysis.
The deposits that carry the most indium tend to be polymetallic sulfide bodies — masses of mixed zinc, lead, copper and tin sulfides — rather than simple zinc-only orebodies. Tin-bearing hydrothermal systems in particular seem to favour higher indium concentrations, probably because the chemistry that precipitates tin also keeps conditions right for indium uptake into sphalerite. This is why certain zinc districts in southern China, which have a long history of polymetallic and tin-associated mineralisation, happen to host sphalerite with relatively elevated indium contents compared with zinc deposits elsewhere. The geology does not guarantee that a zinc mine will yield useful indium; the indium grade in the sphalerite varies enormously from one deposit to another, and even within a single orebody it can be patchy.
Because indium is so dispersed and so dependent on the character of the host zinc deposit, there is no meaningful concept of an indium reserve in the way one would speak of a copper or nickel reserve. The world's published reserve figures for indium are largely absent or provisional, a fact that reflects the difficulty of quantifying something that is incidental to the primary ore rather than the target of exploration in its own right.
Getting it out
Indium is not mined. That sentence needs a little unpacking. No mine anywhere on Earth has ever been opened with indium as its target. Every tonne of indium that enters the supply chain comes out of zinc mining as an accidental companion — a by-product that would simply stay in the waste stream if there were no economic reason to recover it. The zinc ore is mined by whatever method the geometry and depth of the orebody dictate: open-pit extraction for large, shallow deposits near the surface, and underground methods for deeper or narrower bodies. The choice between these approaches is made entirely on the economics of zinc, with indium having no say in the matter.
What matters for indium recovery is not the mining method but the character of the ore being processed. Sphalerite grains carrying elevated indium concentrations look identical to ordinary sphalerite. A mine can only know what its ore contains through systematic sampling and assay. Where the indium content of the sphalerite is high enough to justify the additional processing steps needed to capture it, the smelter or refinery will set up to recover it. Where it is not, the indium passes through the plant unrecovered, ending up in slag or residue. The practical consequence is that indium supply is governed by decisions made about zinc production capacity, zinc ore grades and zinc market conditions, none of which are influenced in any meaningful way by indium demand or indium price.
What pulls on it
The overwhelming share of indium consumption goes into indium tin oxide, or ITO, the transparent conductive coating that makes touchscreens and liquid crystal displays function. When a finger touches a screen, it disturbs a weak electric field carried by an ITO layer — a layer that must conduct electricity without blocking light. Indium is present in that layer because its oxide, when mixed with a small proportion of tin oxide, combines two properties that almost no other material offers simultaneously at useful scale: electrical conductivity and optical transparency in the visible spectrum. The flat-panel display industry built its manufacturing processes around ITO over several decades, and that accumulated infrastructure represents a large and relatively stable source of demand.
Alongside displays, indium plays a role in thin-film photovoltaics, specifically the technology known as CIGS — copper indium gallium selenide — where indium is a stoichiometric component of the light-absorbing semiconductor layer rather than a coating. CIGS cells have achieved high efficiency in laboratory settings and have found commercial use in applications where flexibility or low weight matters, though their share of total solar capacity installed globally has remained well below that of silicon-based panels. Indium is also used in compound semiconductors of the III-V family, particularly indium phosphide and indium gallium arsenide, which appear in high-frequency electronics, laser diodes and certain specialist detector applications. These uses are smaller in volume than displays but tend to involve applications where indium is difficult to replace.
What would have to change for demand to shift sharply? On the upside, a significant acceleration in CIGS solar deployment or a broadening of III-V semiconductor use into mass-market consumer chips would increase demand noticeably. On the downside, if the display industry were to find a commercially workable ITO substitute and retrofit existing production lines, the largest single source of demand would contract. Both directions of change depend on technology choices made by industries where indium itself is a minor input cost, meaning the decisions are unlikely to be made on the basis of indium availability or price alone.
Where it comes from in the rock
All ore minerals →These are the minerals that actually carry indium. A deposit is only an orebody if one of them is concentrated enough to pay for digging it up.
Who produces it
See it on a map →Refinery production
Refinery productionmetric tons 2025 (estimated) World total 1,100 metric tons
USGS Mineral Commodity Summaries 2026 · Refinery production of primary indium; a by-product of zinc. · source ↗
Scroll the table sideways for the remaining columns.
| Country | Production | Share of world |
|---|---|---|
| China | 760.0 | 69.1% |
| Korea, Republic of | 180.0 | 16.4% |
| Japan | 65.00 | 5.9% |
| Canada | 40.00 | 3.6% |
| France | 21.00 | 1.9% |
| Belgium | 19.00 | 1.7% |
| Russia | 5.00 | 0.5% |
| Uzbekistan | 1.00 | 0.1% |
| United States | Zero | — |
| World total | 1,100 | 100% |
“Withheld” means the USGS suppressed the figure to avoid disclosing an individual company's data — it does not mean zero. Country rows do not always sum to the world total because the source rounds each figure independently and does not always break out an “other countries” line.
Price
annual average, dollars per kilogram: U.S. warehouse, free on board
Annual averagedollars per kilogram
Basis: annual average, dollars per kilogram: U.S. warehouse, free on board. Annual averages as published in USGS Mineral Commodity Summaries 2026 · source ↗. These are reference annual averages, not a live market quote.
annual average, dollars per kilogram: Rotterdam, duties unpaid
Annual averagedollars per kilogram
Basis: annual average, dollars per kilogram: Rotterdam, duties unpaid. Annual averages as published in USGS Mineral Commodity Summaries 2026 · source ↗. These are reference annual averages, not a live market quote.
What it is used for
All end markets →| End market | What it does there | Importance |
|---|---|---|
| Consumer Electronics | Transparent touchscreen electrode | Defining |
| Semiconductors | Transparent contacts and III-V devices | Important |
| Solar Power | CIGS thin film and transparent contacts | Present |
Export controls
| Country | Control | Applies to |
|---|---|---|
| China | Export licensing requirement for materials and technologies | Antimony (2024), bismuth (2025), synthesized diamond (2025), gallium (2023), germanium (2023), graphite (2023), indium (2025), magnesium materials (2024), molybdenum (2025), rare earths (2025), silver (2026), tellurium (2025), tungsten (2025), and items related to lithium batteries and artificial graphite anode materials (2025). ↗ |
USGS Mineral Commodity Summaries 2026, table 4 — controls in effect as of January 2026, excluding controls since lifted.