What is it?
A soft, dense, blue-grey metal that blocks radiation and stores charge cheaply — and that is also a well-documented neurotoxin.
Why does it matter?
It has the highest recycling rate of any major metal: most lead in use today has been through a battery before.
Where it is in the Earth
Where it is in the Earth
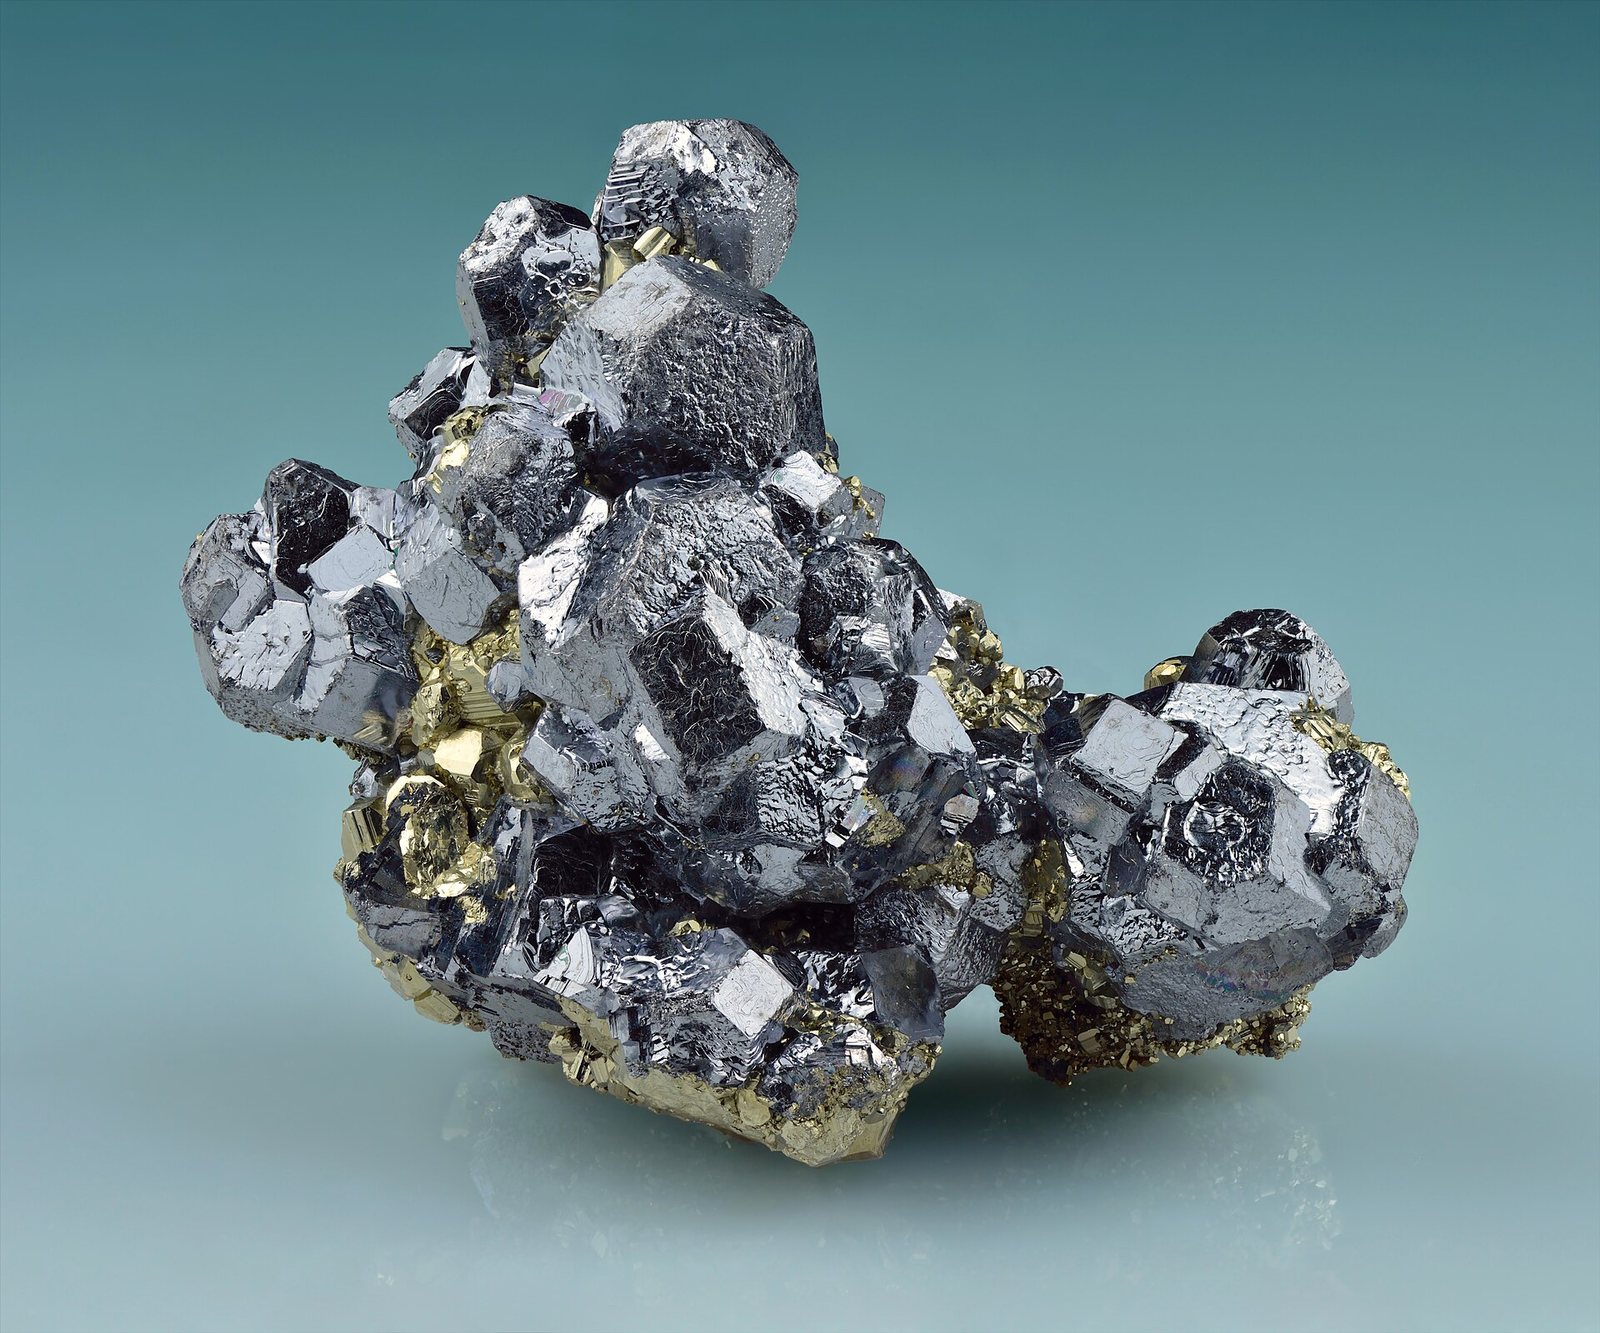
Lead does not occur in useful quantities in ordinary rock. It becomes minable only where geological processes have gathered it into concentrations far above background levels, and the mechanism that does this most reliably is hydrothermal circulation: hot, mineral-laden water moving through fractures in the crust and depositing sulphide minerals as it cools or encounters chemically reactive rock. The principal ore mineral produced by this process is galena, a lead sulphide (PbS) with a characteristic bright metallic lustre and notably high density. When you hold a hand specimen, its weight is immediately apparent — a reflection of lead's density of 11.34 grams per cubic centimetre, one of the highest of any common metal.
Two deposit types account for most of the world's recoverable lead. The first is the sediment-hosted massive sulphide deposit, sometimes called a SEDEX deposit, where metal-rich fluids vented through ancient seafloor sediments and precipitated broad, layered sheets of sulphide minerals. Red Dog in Alaska, one of the two named mines in the associated data, is a classic example of this type. The second major type is the Broken Hill-type deposit, named after the legendary mining district in New South Wales, Australia, and characterised by very high grades of lead and zinc that were concentrated during ancient metamorphic events — episodes of intense heat and pressure that remobilised and reconcentrated the metals. Cannington in Queensland, operated by South32, belongs to this family. Both types tend to carry zinc and silver alongside the lead, which matters greatly for the economics of mining them.
The geography of lead reserves reflects this geology directly. Australia holds the largest single share of world reserves by a wide margin, a consequence of having both Broken Hill-type and other high-grade systems spread across ancient Proterozoic terrains. China holds the second-largest reserve base, with significant deposits in Yunnan, Hunan and Guangdong provinces. The fact that a country holds large reserves does not mean it currently produces at the same relative rate: Australia's reserve position is proportionally much larger than its production share, while China's production share — 1,900,000 tonnes out of a world total of 4,500,000 tonnes — exceeds what its reserve fraction alone might suggest, reflecting decades of investment in developing those deposits.
Getting it out
Getting it out
Whether a lead deposit is mined from the surface or from underground depends mainly on how deep the ore body sits and how it is shaped. Flat, near-surface deposits can be stripped of overlying rock — the waste material known as overburden — and worked as open pits. Deeper, steeply dipping or irregularly shaped ore bodies are followed underground, where miners drive tunnels to reach the ore and bring it to surface in smaller, more targeted quantities. Red Dog in Alaska is worked as an open pit, which suits its broad, shallow geometry. Cannington in Queensland is an underground operation, reflecting a rich but compact ore body at depth.
The grade of the ore — the proportion by weight that is actually lead — determines how much rock must be moved and processed to recover each tonne of metal. Higher grades mean less waste and lower processing costs per unit of product; lower grades mean the opposite. Lead ore grades vary considerably between deposits, and no single figure applies broadly. What matters in practice is not the grade alone but the ratio of ore to waste that must be moved to maintain production, often called the strip ratio in open-pit mining. At a mine with a high strip ratio, a large tonnage of barren rock is shifted for every tonne of ore reached, and that rock-moving cost becomes a significant fraction of total operating expense.
A further complexity is that lead is almost never the only metal being recovered. Galena deposits routinely contain zinc sulphides and silver-bearing minerals such as acanthite, and the economics of mining frequently depend as much on those co-products as on the lead itself. This means that decisions about whether to mine a particular deposit, or how aggressively to extract it, are shaped by the combined value of everything coming out of the ground, not by the lead price in isolation. That interdependence carries through to processing and has consequences for how supply responds to changes in any one metal's market.
What pulls on it
What pulls on it
The dominant use of refined lead, accounting for well over four-fifths of consumption in refined form, is the lead-acid battery. This is a technology that has existed for more than a century and a half, yet it remains the default solution for a specific and large task: providing the short, powerful burst of current needed to start an internal combustion engine, and providing reliable, cheap backup power in telecommunications, utilities and uninterruptible power supplies. The chemistry works because lead and lead dioxide, in sulfuric acid, produce a reversible electrochemical reaction that is stable, well understood and manufacturable at scale using infrastructure that already exists worldwide. No other battery chemistry has displaced it in these applications at comparable cost.
Beyond batteries, lead retains important but smaller roles. Its density makes it effective as radiation shielding in medical imaging and nuclear facilities. Its low melting point and workability make it useful in certain solders, bearing alloys and sheet applications. The USGS identifies ammunition, ceramics and glass production as primary applications in the United States specifically, reflecting the use of lead in shot and bullets and the use of lead compounds as stabilisers and colourants in glass and ceramics — though regulatory pressure has reduced some of these uses in several markets. The intensity figure in the associated table, covering lead's use as a moisture barrier sheath in subsea HVDC transmission cable, illustrates how the metal can appear in quite specific technical niches at meaningful volumes per unit of infrastructure.
The principal question about future demand concerns the trajectory of the lead-acid battery itself. Growth in electric vehicles, which use lithium-ion rather than lead-acid chemistry for their main drive batteries, might appear to threaten lead demand — but electric vehicles still use lead-acid batteries for their 12-volt auxiliary systems, and the sheer scale of the global vehicle fleet means that starting batteries remain a large market. The faster-growing demand for grid-scale and off-grid energy storage, by contrast, increasingly favours lithium-ion. Whether that shift is large enough and fast enough to offset continued growth in the automotive and backup-power segments is a question of pace and scale that the data here does not resolve numerically.
Where it comes from in the rock
All ore minerals →These are the minerals that actually carry lead. A deposit is only an orebody if one of them is concentrated enough to pay for digging it up.
Galena
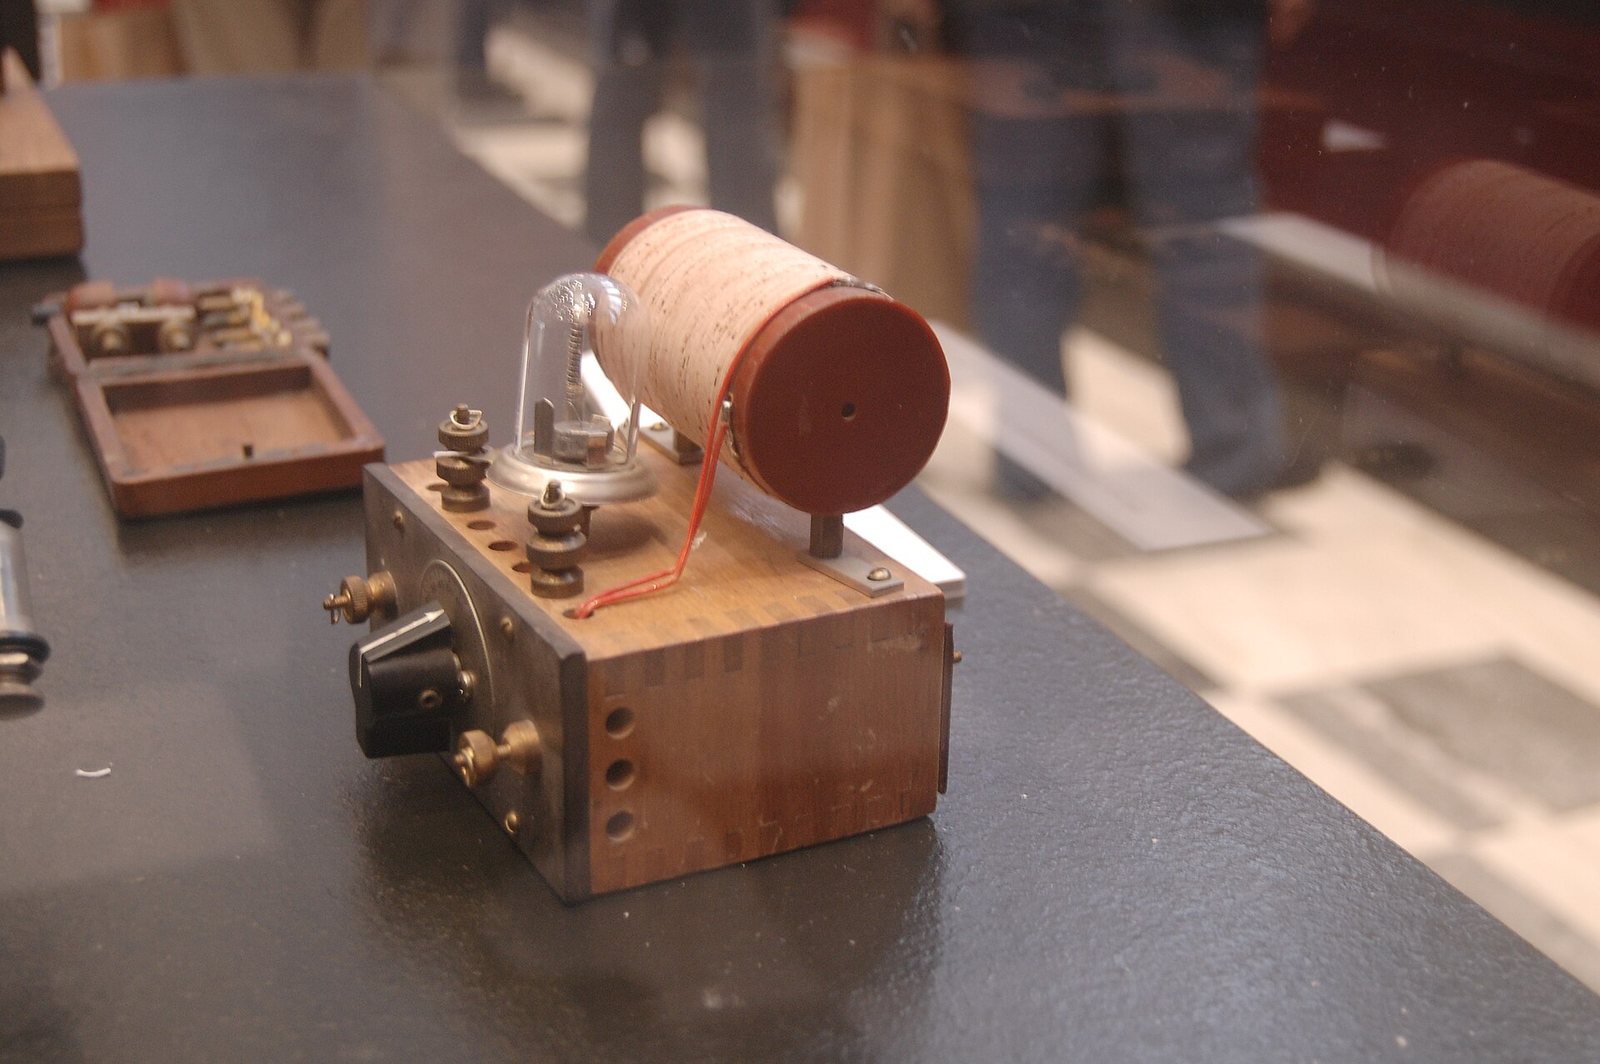
The main lead ore, and a principal carrier of silver — which is why most silver is a by-product.
Acanthite (silver sulfide)
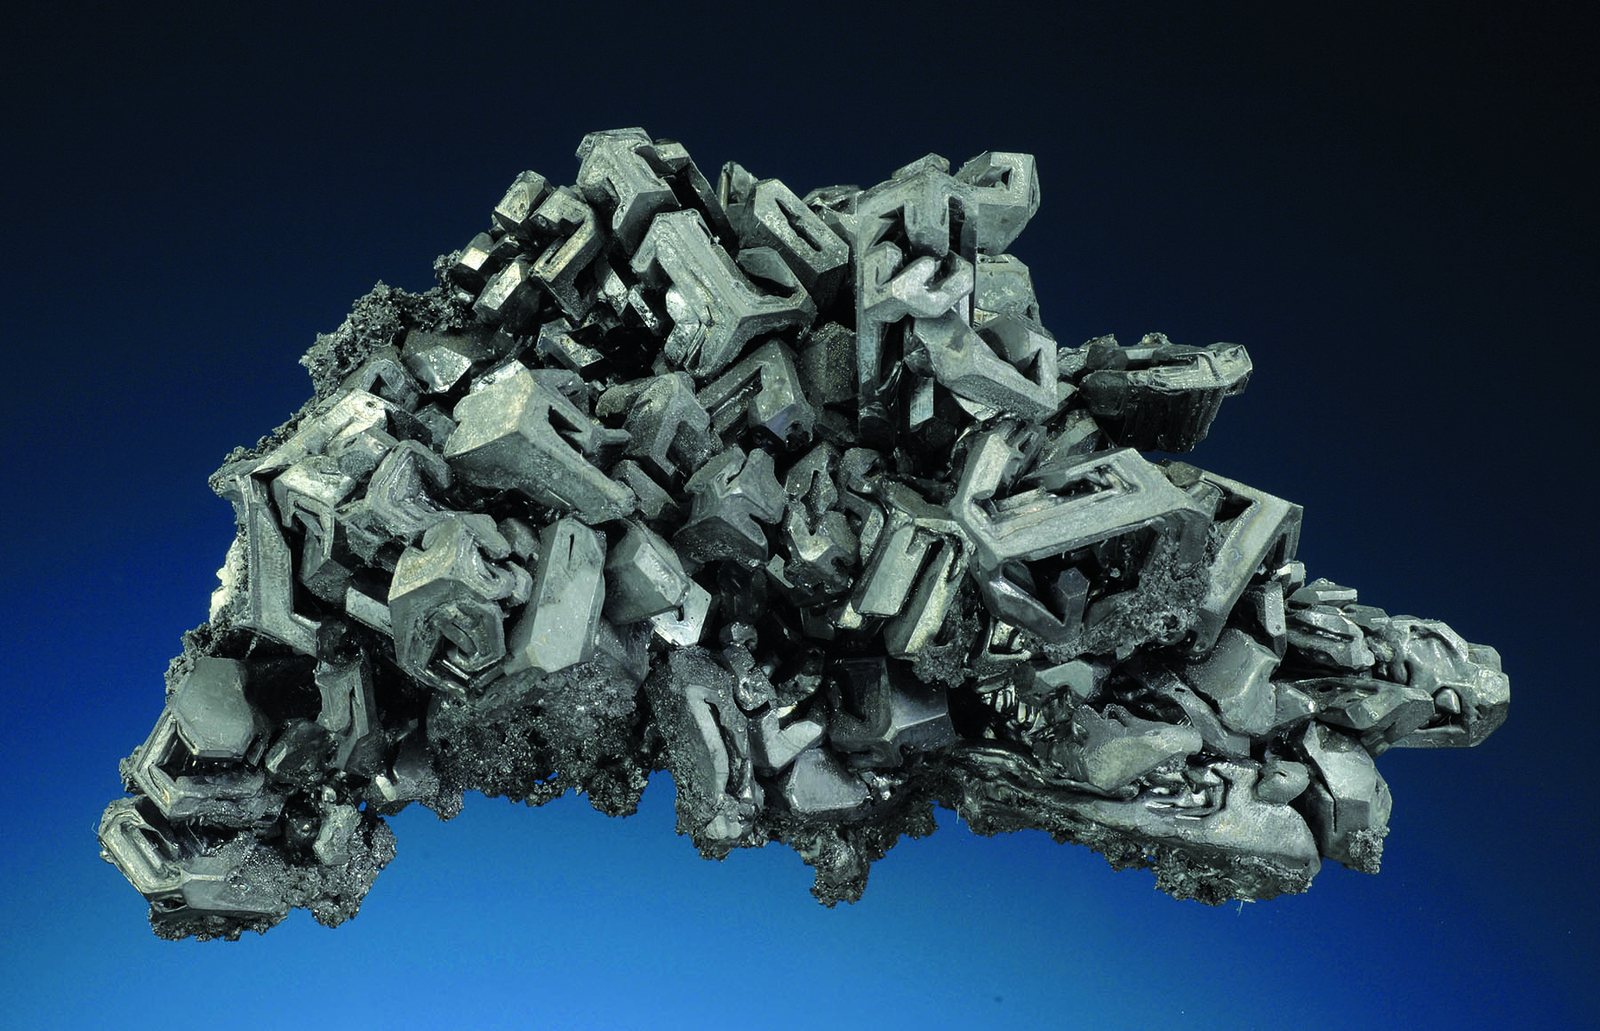
The main primary silver mineral, though most silver is recovered from lead-zinc and copper concentrates.
Who produces it
See it on a map →Mine production
Mine productionthousand metric tons 2025 (estimated) World total 4,500 thousand metric tons
USGS Mineral Commodity Summaries 2026 · Mine production of contained lead; refined output includes a large secondary (recycled) share. · source ↗
Scroll the table sideways for the remaining columns.
| Country | Production | Share of world |
|---|---|---|
| China | 1,900 | 42.2% |
| Other countries | 500.0 | 11.1% |
| Australia | 480.0 | 10.7% |
| Peru | 290.0 | 6.4% |
| United States | 280.0 | 6.2% |
| Russia | 260.0 | 5.8% |
| India | 220.0 | 4.9% |
| Mexico | 200.0 | 4.4% |
| Bolivia | 100.0 | 2.2% |
| Turkey | 70.00 | 1.6% |
| Sweden | 70.00 | 1.6% |
| Iran | 70.00 | 1.6% |
| Tajikistan | 40.00 | 0.9% |
| World total | 4,500 | 100% |
“Withheld” means the USGS suppressed the figure to avoid disclosing an individual company's data — it does not mean zero. Country rows do not always sum to the world total because the source rounds each figure independently and does not always break out an “other countries” line.
Who holds the reserves
Reserves
Reservesthousand metric tons 2025
USGS Mineral Commodity Summaries 2026 · source ↗
| Country | Reserves | Share of world |
|---|---|---|
| Australia | 34,000 | 35.8% |
| China | 22,000 | 23.2% |
| Russia | 8,900 | 9.4% |
| Other countries | 5,900 | 6.2% |
| Mexico | 5,600 | 5.9% |
| Peru | 5,000 | 5.3% |
| United States | 4,600 | 4.8% |
| Iran | 2,000 | 2.1% |
| India | 1,900 | 2.0% |
| Sweden | 1,700 | 1.8% |
| Bolivia | 1,600 | 1.7% |
| Turkey | 1,600 | 1.7% |
| Tajikistan | Not applicable | — |
| World total | 95,000 | 100% |
Price
Lead, global price
Annual averageUS$ per tonne
Basis: IMF global price of lead — 99.97% pure, LME spot. Annual averages as published in FRED (IMF primary commodity prices) · source ↗. These are reference annual averages, not a live market quote.
average, North American, cents per pound
Annual averagecents per pound
Basis: average, North American, cents per pound. Annual averages as published in USGS Mineral Commodity Summaries 2026 · source ↗. These are reference annual averages, not a live market quote.
Mines that produce it
All mines →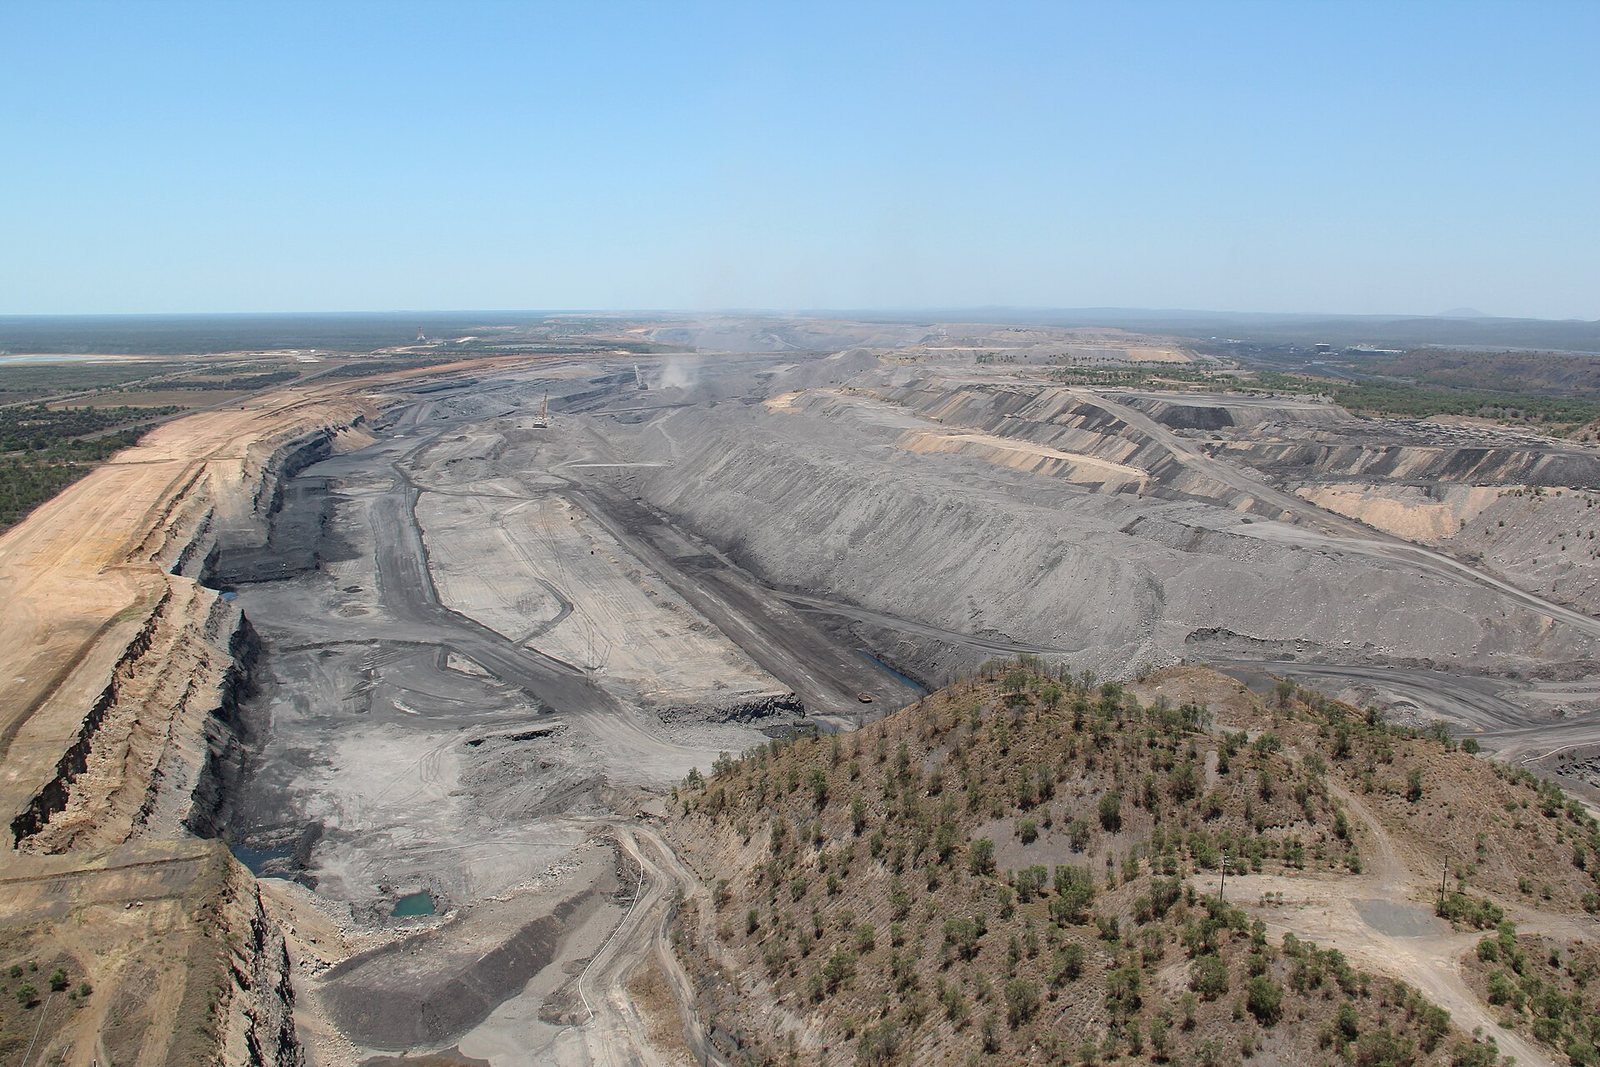

How much of it a technology needs
| Technology | Quantity | Quoted | Basis |
|---|---|---|---|
| HVDC Transmission Cable Being phased out in newer designs. | 10.00–40.00 t | per km of circuit | Moisture barrier sheath in subsea cable |
Indicative range compiled from published technology studies and chemistry; verify against a manufacturer specification before use. Run these numbers at any scale in the material calculator →
Export controls
| Country | Control | Applies to |
|---|---|---|
| Vietnam | Export ban | Raw materials of iron, lead-zinc, chromite, manganese, apatite, and rare earths and deeply processed titanium (2012). ↗ |
USGS Mineral Commodity Summaries 2026, table 4 — controls in effect as of January 2026, excluding controls since lifted.