What is it?
A soft, dense, blue-grey metal that blocks radiation and stores charge cheaply — and that is also a well-documented neurotoxin.
Why does it matter?
It has the highest recycling rate of any major metal: most lead in use today has been through a battery before.
Where it is in the Earth
Where it is in the Earth
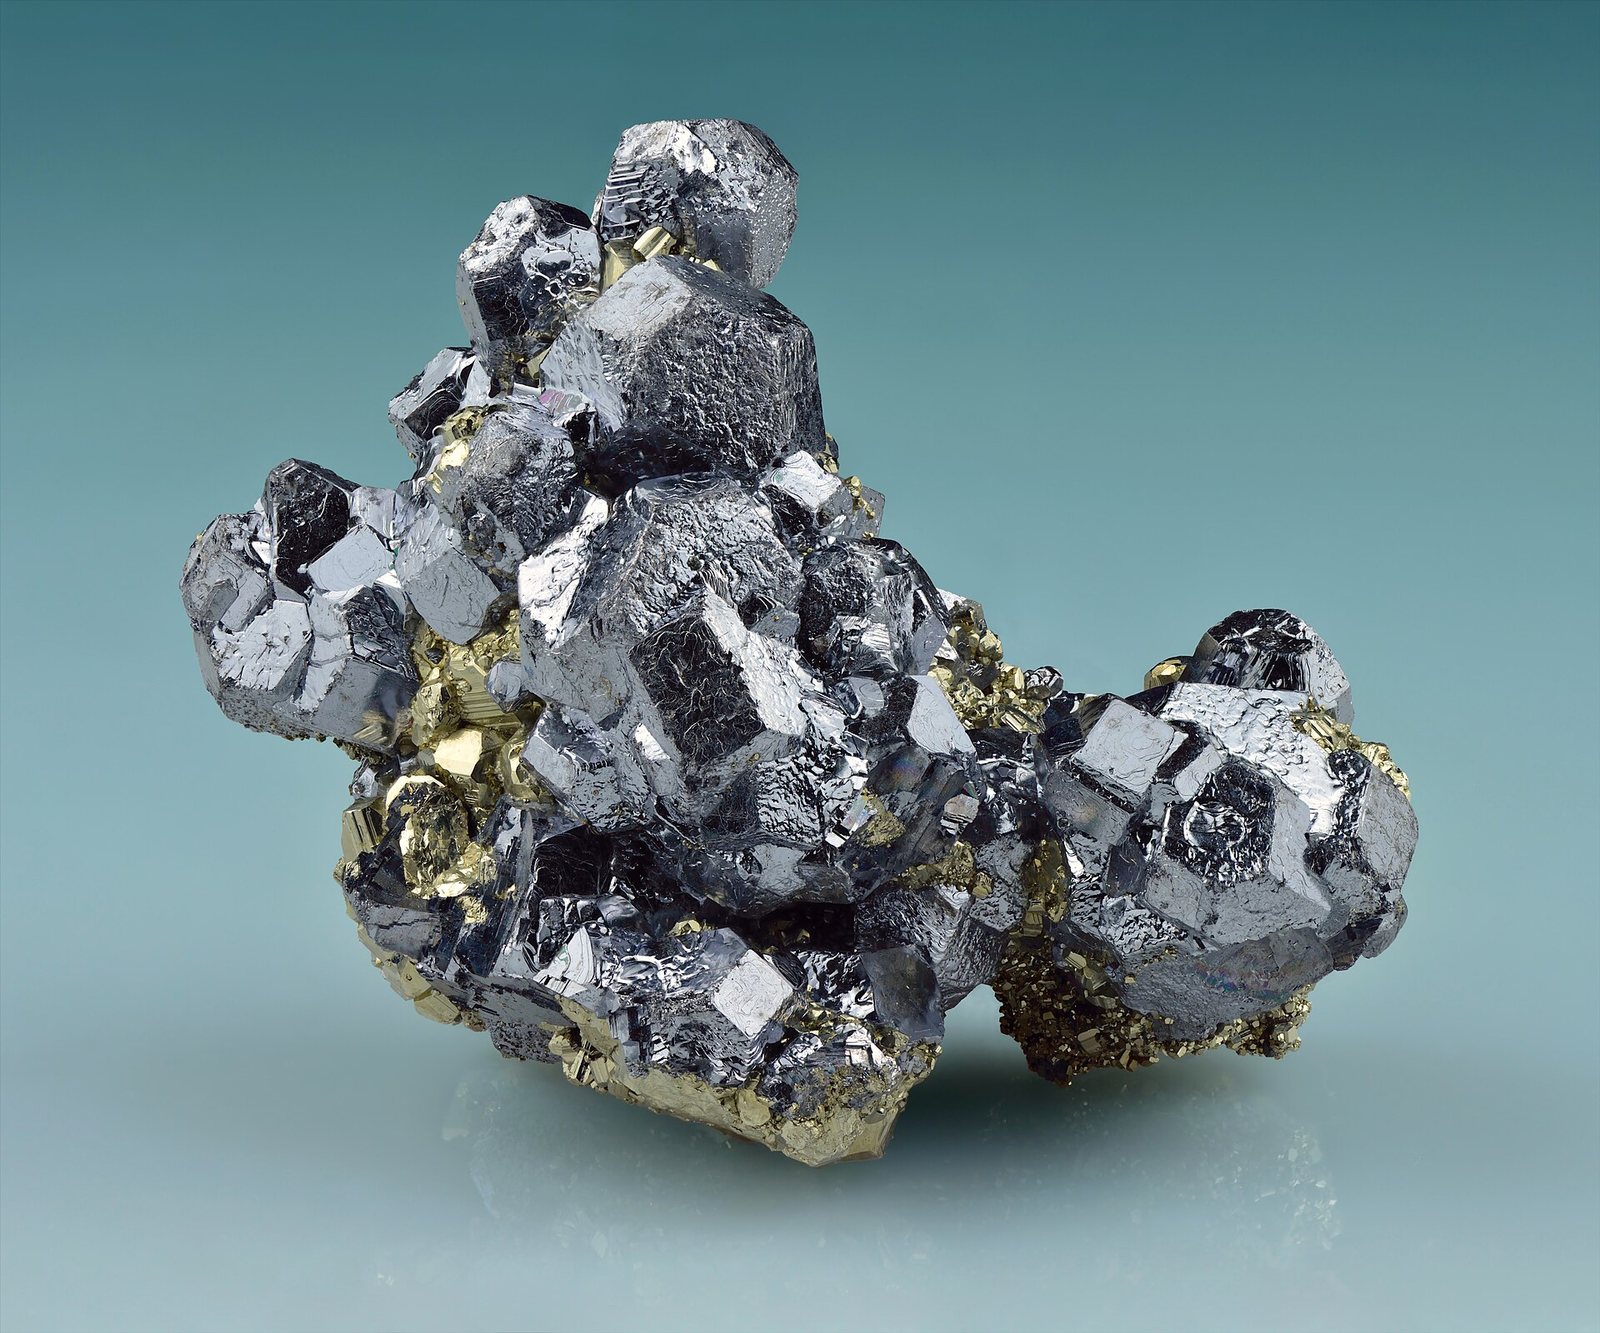
Lead does not occur in useful quantities in ordinary rock. It becomes minable only where geological processes have gathered it into concentrations far above background levels, and the mechanism that does this most reliably is hydrothermal circulation: hot, mineral-laden water moving through fractures in the crust and depositing sulphide minerals as it cools or encounters chemically reactive rock. The principal ore mineral produced by this process is galena, a lead sulphide (PbS) with a characteristic bright metallic lustre and notably high density. When you hold a hand specimen, its weight is immediately apparent — a reflection of lead's density of 11.34 grams per cubic centimetre, one of the highest of any common metal.
Two deposit types account for most of the world's recoverable lead. The first is the sediment-hosted massive sulphide deposit, sometimes called a SEDEX deposit, where metal-rich fluids vented through ancient seafloor sediments and precipitated broad, layered sheets of sulphide minerals. Red Dog in Alaska, one of the two named mines in the associated data, is a classic example of this type. The second major type is the Broken Hill-type deposit, named after the legendary mining district in New South Wales, Australia, and characterised by very high grades of lead and zinc that were concentrated during ancient metamorphic events — episodes of intense heat and pressure that remobilised and reconcentrated the metals. Cannington in Queensland, operated by South32, belongs to this family. Both types tend to carry zinc and silver alongside the lead, which matters greatly for the economics of mining them.
The geography of lead reserves reflects this geology directly. Australia holds the largest single share of world reserves by a wide margin, a consequence of having both Broken Hill-type and other high-grade systems spread across ancient Proterozoic terrains. China holds the second-largest reserve base, with significant deposits in Yunnan, Hunan and Guangdong provinces. The fact that a country holds large reserves does not mean it currently produces at the same relative rate: Australia's reserve position is proportionally much larger than its production share, while China's production share — 1,900,000 tonnes out of a world total of 4,500,000 tonnes — exceeds what its reserve fraction alone might suggest, reflecting decades of investment in developing those deposits.
Getting it out
Getting it out
Whether a lead deposit is mined from the surface or from underground depends mainly on how deep the ore body sits and how it is shaped. Flat, near-surface deposits can be stripped of overlying rock — the waste material known as overburden — and worked as open pits. Deeper, steeply dipping or irregularly shaped ore bodies are followed underground, where miners drive tunnels to reach the ore and bring it to surface in smaller, more targeted quantities. Red Dog in Alaska is worked as an open pit, which suits its broad, shallow geometry. Cannington in Queensland is an underground operation, reflecting a rich but compact ore body at depth.
The grade of the ore — the proportion by weight that is actually lead — determines how much rock must be moved and processed to recover each tonne of metal. Higher grades mean less waste and lower processing costs per unit of product; lower grades mean the opposite. Lead ore grades vary considerably between deposits, and no single figure applies broadly. What matters in practice is not the grade alone but the ratio of ore to waste that must be moved to maintain production, often called the strip ratio in open-pit mining. At a mine with a high strip ratio, a large tonnage of barren rock is shifted for every tonne of ore reached, and that rock-moving cost becomes a significant fraction of total operating expense.
A further complexity is that lead is almost never the only metal being recovered. Galena deposits routinely contain zinc sulphides and silver-bearing minerals such as acanthite, and the economics of mining frequently depend as much on those co-products as on the lead itself. This means that decisions about whether to mine a particular deposit, or how aggressively to extract it, are shaped by the combined value of everything coming out of the ground, not by the lead price in isolation. That interdependence carries through to processing and has consequences for how supply responds to changes in any one metal's market.
What pulls on it
What pulls on it
The dominant use of refined lead, accounting for well over four-fifths of consumption in refined form, is the lead-acid battery. This is a technology that has existed for more than a century and a half, yet it remains the default solution for a specific and large task: providing the short, powerful burst of current needed to start an internal combustion engine, and providing reliable, cheap backup power in telecommunications, utilities and uninterruptible power supplies. The chemistry works because lead and lead dioxide, in sulfuric acid, produce a reversible electrochemical reaction that is stable, well understood and manufacturable at scale using infrastructure that already exists worldwide. No other battery chemistry has displaced it in these applications at comparable cost.
Beyond batteries, lead retains important but smaller roles. Its density makes it effective as radiation shielding in medical imaging and nuclear facilities. Its low melting point and workability make it useful in certain solders, bearing alloys and sheet applications. The USGS identifies ammunition, ceramics and glass production as primary applications in the United States specifically, reflecting the use of lead in shot and bullets and the use of lead compounds as stabilisers and colourants in glass and ceramics — though regulatory pressure has reduced some of these uses in several markets. The intensity figure in the associated table, covering lead's use as a moisture barrier sheath in subsea HVDC transmission cable, illustrates how the metal can appear in quite specific technical niches at meaningful volumes per unit of infrastructure.
The principal question about future demand concerns the trajectory of the lead-acid battery itself. Growth in electric vehicles, which use lithium-ion rather than lead-acid chemistry for their main drive batteries, might appear to threaten lead demand — but electric vehicles still use lead-acid batteries for their 12-volt auxiliary systems, and the sheer scale of the global vehicle fleet means that starting batteries remain a large market. The faster-growing demand for grid-scale and off-grid energy storage, by contrast, increasingly favours lithium-ion. Whether that shift is large enough and fast enough to offset continued growth in the automotive and backup-power segments is a question of pace and scale that the data here does not resolve numerically.
Turning ore into product Level 3
Turning ore into product
Run-of-mine ore — rock as it comes from the stope or the pit — is not shipped directly to customers. It must first be reduced to a fine powder through comminution (crushing followed by grinding in large rotating mills), then separated into a concentrate that is rich in lead sulphide minerals and a tailings stream that carries the gangue, or waste mineral matter. The separation step is almost universally done by froth flotation: the finely ground ore is mixed with water and reagents that make galena particles preferentially attach to air bubbles and float to the surface as a mineralised froth, while the gangue sinks. The resulting lead concentrate typically contains a substantial proportion of lead by weight, along with residual zinc, iron sulphides and whatever silver was present in the galena. Separate flotation circuits can be run in sequence to produce distinct lead and zinc concentrates from the same ore, maximising the value recovered from each tonne milled.
Lead concentrate is then smelted, which means roasting it in air to convert the sulphide to an oxide (a step called sintering or roasting, depending on the furnace configuration), then reducing that oxide with coke in a blast furnace to produce bullion — impure metallic lead. The off-gases from roasting are rich in sulphur dioxide, and modern smelters are required to capture this and convert it to sulfuric acid rather than emit it; the acid is itself a saleable by-product. The bullion that emerges from the blast furnace still contains copper, arsenic, antimony, tin and precious metals, and these are removed in a series of pyrometallurgical refining steps — essentially controlled additions of reagents that cause the impurities to form drosses or alloys that can be skimmed from the melt. The final refined product is the high-purity ingot that moves in trade. Where silver content is significant, its recovery in the refinery can contribute meaningfully to overall revenue, which is why the silver associate mineral acanthite appears in the ore-mineral table.
Secondary production — smelting of recycled lead, primarily from spent batteries — follows a broadly similar but shorter route, since the feed material is already metallic and the sulphur has largely been converted during the battery's service life. The distinction between primary and secondary output matters for understanding aggregate supply figures: the unit basis given for this dataset is mine production of contained lead, but refined output includes a large secondary share. Published refined output numbers therefore regularly exceed primary mine output by a significant margin, and the difference is accounted for by scrap being fed into secondary smelters. The processing losses in the secondary stream tend to be lower than in primary smelting, because the feed is chemically simpler.
Substitution and recycling Level 3
Substitution and recycling
Lead-acid batteries face competition from several alternative chemistries. Lithium-ion cells offer higher energy density — that is, more energy stored per unit of weight — and have become the standard for applications where weight and cycle life matter most. Nickel-metal hydride and absorbed glass mat lead-acid variants represent intermediate positions. The constraint on substitution is cost: lead-acid batteries remain considerably cheaper per unit of energy storage capacity than lithium-ion equivalents, which is precisely why they persist in start-stop automotive applications and in bulk backup power where mass is not a penalty. A genuine displacement of lead-acid technology in starting batteries would require either a sharp fall in lithium-ion manufacturing costs relative to lead, or a regulatory intervention mandating it. Neither has occurred comprehensively across major markets as of the data available here.
For radiation shielding, substitutes exist in principle — high-density concrete, bismuth-based composites and certain polymers — but none match galena-derived lead for the combination of attenuation efficiency per unit thickness and low cost. In cable sheathing, aluminium and certain polymer compounds can serve as moisture barriers, but the choice between them and lead depends on the specific mechanical and corrosion environment of each cable installation. Substitution in these uses is therefore application-specific rather than wholesale.
Recycling is where lead's supply chain is genuinely unusual. The metal has the highest recycling rate of any major metal, and this is not an accident of sentiment but a consequence of the battery's structure: the lead plates are recoverable in nearly intact form, the collection infrastructure for spent automotive batteries is well established in most markets, and the economics of secondary smelting are straightforward enough to make collection commercially self-sustaining in most jurisdictions. The result is that secondary production accounts for a large and growing share of total refined lead supply. The reason recycling does not capture still more is partly a matter of informal collection in some lower-income markets — where batteries may be disassembled without proper containment, releasing lead compounds into the environment — and partly a matter of losses in the smelting process itself, which are small per cycle but compound across multiple battery lifetimes.
Where the chain is fragile Level 4
Where the chain is fragile
The single most visible concentration risk in lead supply is China's position as both the dominant producer and the largest refiner. At 1,900,000 tonnes of mine production in 2025 against a world total of 4,500,000 tonnes, China accounts for roughly 42 per cent of global output — a figure confirmed by the USGS data cited here. Chinese smelting capacity is proportionally even more dominant in refined lead. This means that regulatory shifts within China — whether affecting environmental standards for smelters, export licensing for concentrate, or energy allocation to energy-intensive industries — have the capacity to move global refined availability materially. The concentration is not offset by a highly diversified processing sector elsewhere: outside China, Australia and Peru are the next largest producers, but their concentrate is in many cases shipped to Chinese smelters for refining, meaning that the geographic diversification at the mine level does not translate directly into processing redundancy.
A second structural fragility is by-product dependence. Because lead is almost always co-produced with zinc and silver, mine output does not respond to lead demand or lead price alone. When zinc markets are depressed and operators curtail zinc mines, lead output falls with it regardless of the lead price. Conversely, if lead demand were to fall sharply, primary mine supply would not necessarily follow, because those mines are being run for the combined economics of all metals they produce. This decoupling between demand signals and supply responses makes the market behaviour of lead systematically different from a commodity where the primary ore is the only product.
Reporting conventions add a further layer of uncertainty that researchers should hold clearly in mind. Mine production figures are reported on a contained-lead basis — the amount of lead metal equivalent in the ore or concentrate — whereas refined production includes secondary material and is reported on a different basis. Figures published by the USGS, the International Lead and Zinc Study Group, and national statistical agencies use different time lags, different conversion assumptions for concentrate grades, and different treatments of secondary supply. It is common for these sources to disagree by meaningful amounts in any given year, and reconciling them requires understanding which unit basis each series uses. The reserves figures in the table are drawn from USGS Mineral Commodity Summaries and reflect reported reserve classifications at the country level; they do not include resources that fall below reserve cut-off grade, inferred mineral resources, or material that is economic only at prices above current levels. Australia's large reserve figure relative to its production rate suggests a long reserve life, but that figure encapsulates assumptions about cut-off grades and ore classification that may change as technology or economics shift.
Where it comes from in the rock
All ore minerals →These are the minerals that actually carry lead. A deposit is only an orebody if one of them is concentrated enough to pay for digging it up.
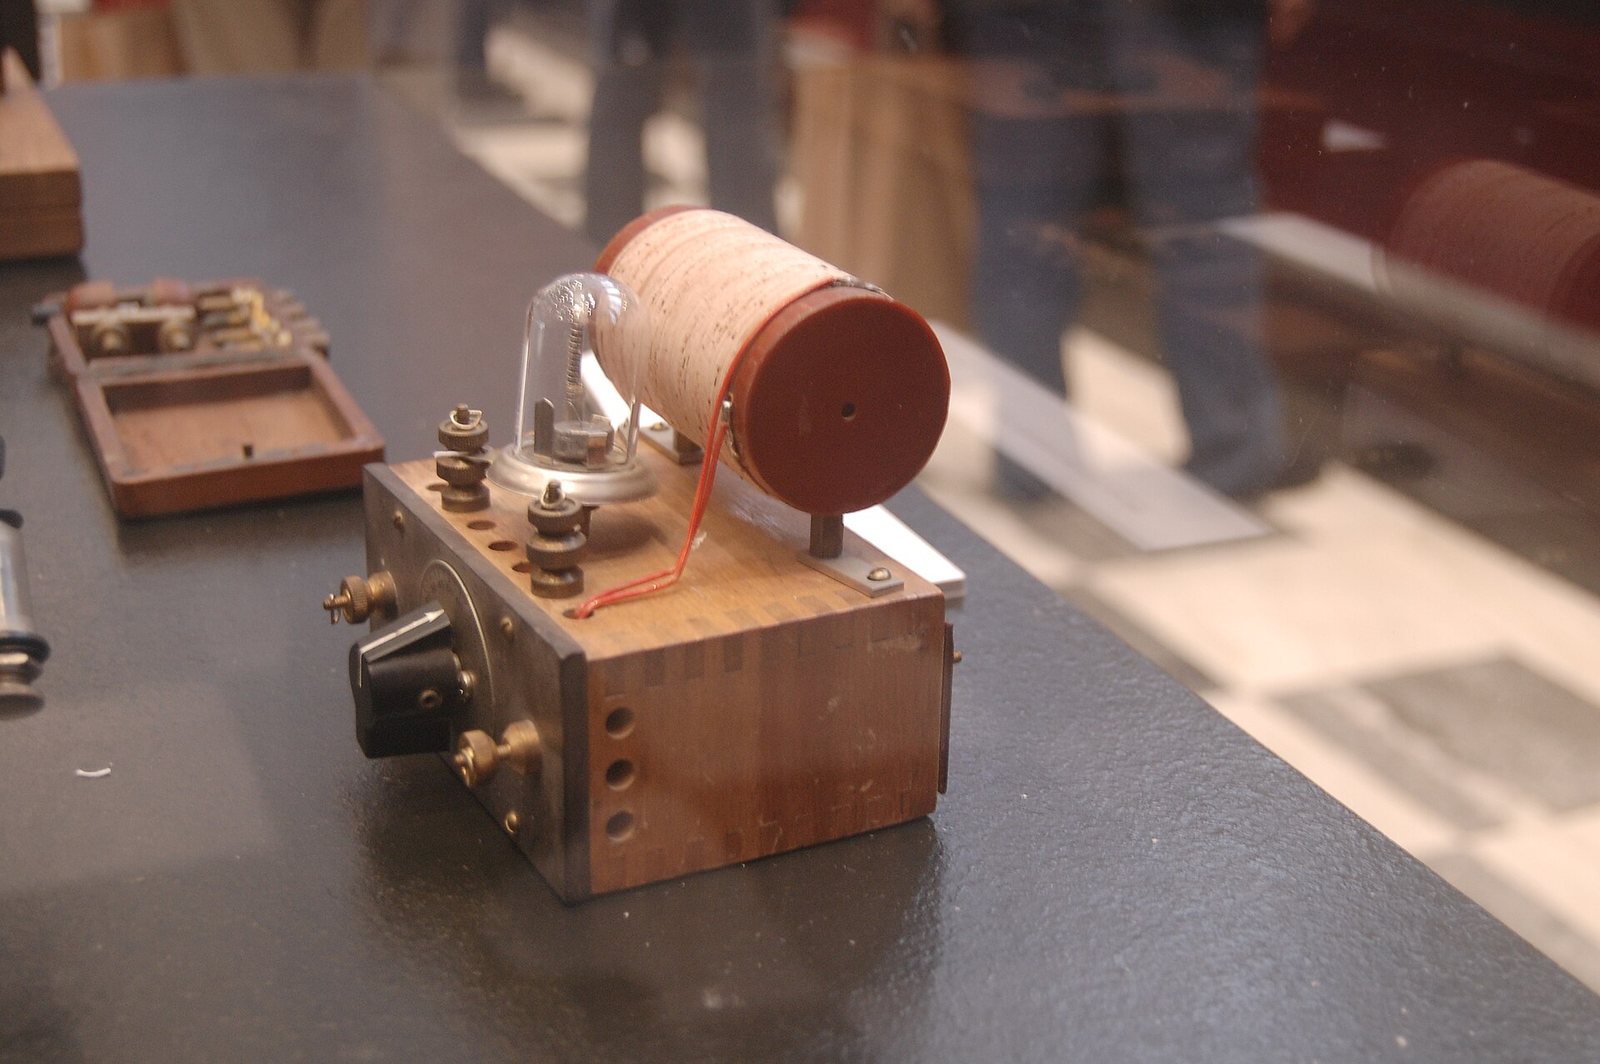
Galena
The main lead ore, and a principal carrier of silver — which is why most silver is a by-product.
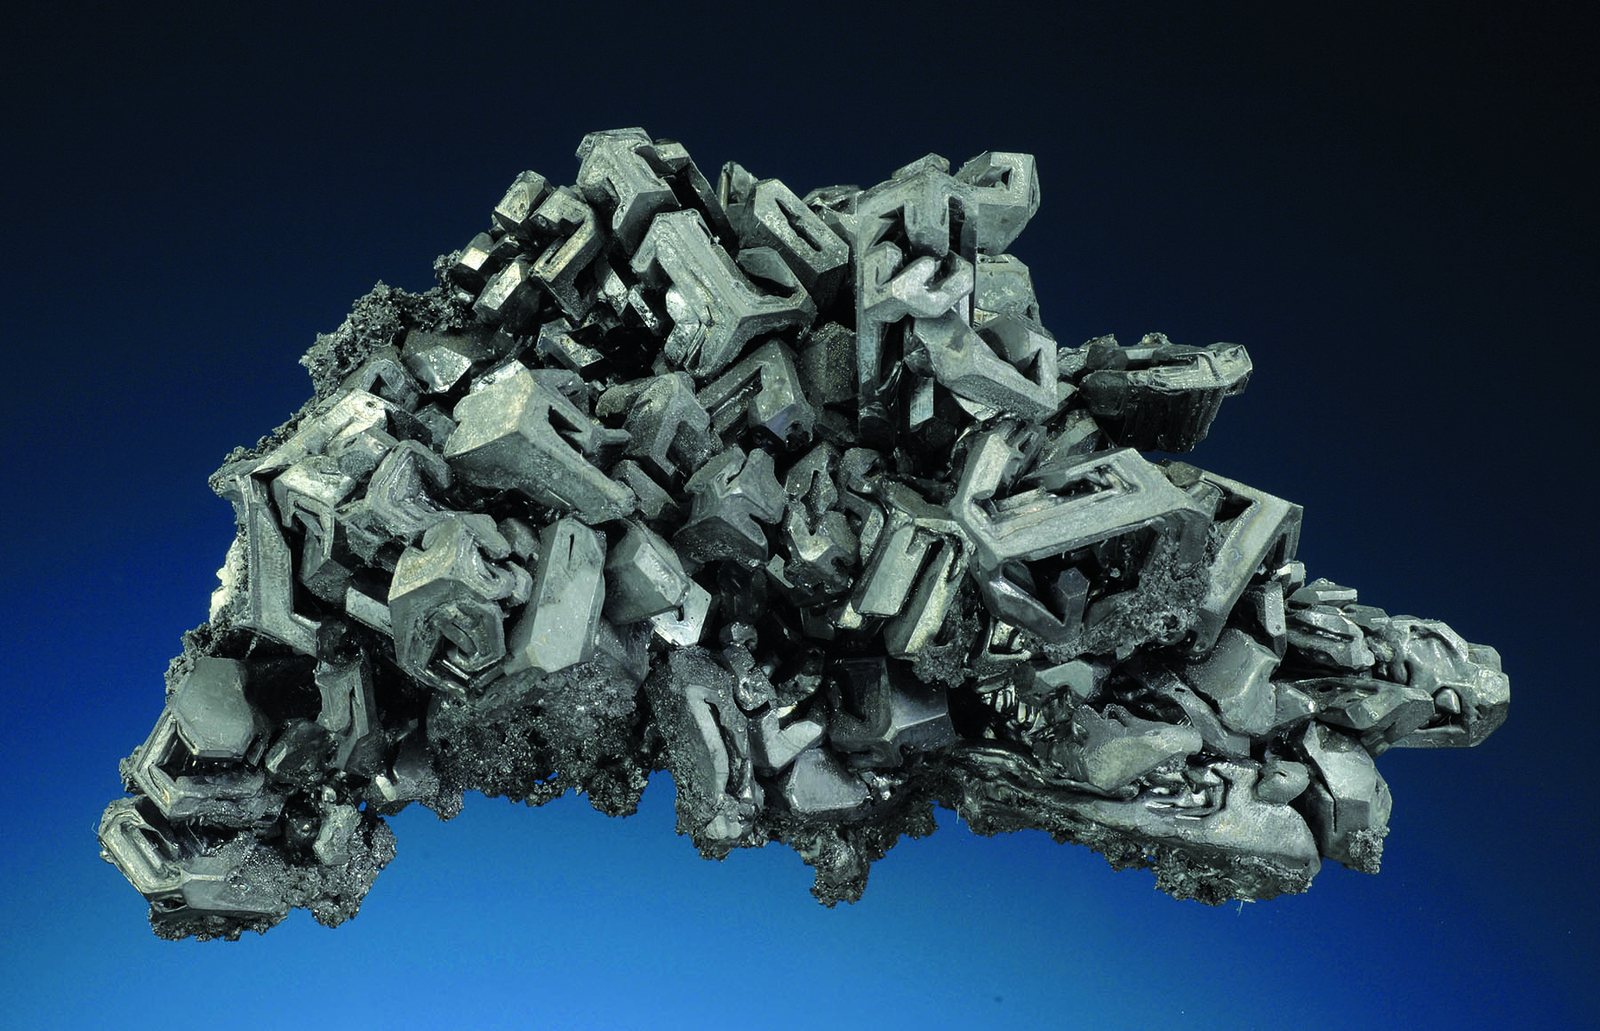
Acanthite (silver sulfide)
The main primary silver mineral, though most silver is recovered from lead-zinc and copper concentrates.
Who produces it
See it on a map →Mine production
Mine productionthousand metric tons 2025 (estimated) World total 4,500 thousand metric tons
USGS Mineral Commodity Summaries 2026 · Mine production of contained lead; refined output includes a large secondary (recycled) share. · source ↗
Scroll the table sideways for the remaining columns.
| Country | Production | Share of world |
|---|---|---|
| China | 1,900 | 42.2% |
| Other countries | 500.0 | 11.1% |
| Australia | 480.0 | 10.7% |
| Peru | 290.0 | 6.4% |
| United States | 280.0 | 6.2% |
| Russia | 260.0 | 5.8% |
| India | 220.0 | 4.9% |
| Mexico | 200.0 | 4.4% |
| Bolivia | 100.0 | 2.2% |
| Turkey | 70.00 | 1.6% |
| Sweden | 70.00 | 1.6% |
| Iran | 70.00 | 1.6% |
| Tajikistan | 40.00 | 0.9% |
| World total | 4,500 | 100% |
“Withheld” means the USGS suppressed the figure to avoid disclosing an individual company's data — it does not mean zero. Country rows do not always sum to the world total because the source rounds each figure independently and does not always break out an “other countries” line.
Who holds the reserves
Reserves
Reservesthousand metric tons 2025
USGS Mineral Commodity Summaries 2026 · source ↗
| Country | Reserves | Share of world |
|---|---|---|
| Australia | 34,000 | 35.8% |
| China | 22,000 | 23.2% |
| Russia | 8,900 | 9.4% |
| Other countries | 5,900 | 6.2% |
| Mexico | 5,600 | 5.9% |
| Peru | 5,000 | 5.3% |
| United States | 4,600 | 4.8% |
| Iran | 2,000 | 2.1% |
| India | 1,900 | 2.0% |
| Sweden | 1,700 | 1.8% |
| Bolivia | 1,600 | 1.7% |
| Turkey | 1,600 | 1.7% |
| Tajikistan | Not applicable | — |
| World total | 95,000 | 100% |
Price
Lead, global price
Annual averageUS$ per tonne
Basis: IMF global price of lead — 99.97% pure, LME spot. Annual averages as published in FRED (IMF primary commodity prices) · source ↗. These are reference annual averages, not a live market quote.
average, North American, cents per pound
Annual averagecents per pound
Basis: average, North American, cents per pound. Annual averages as published in USGS Mineral Commodity Summaries 2026 · source ↗. These are reference annual averages, not a live market quote.
Mines that produce it
All mines →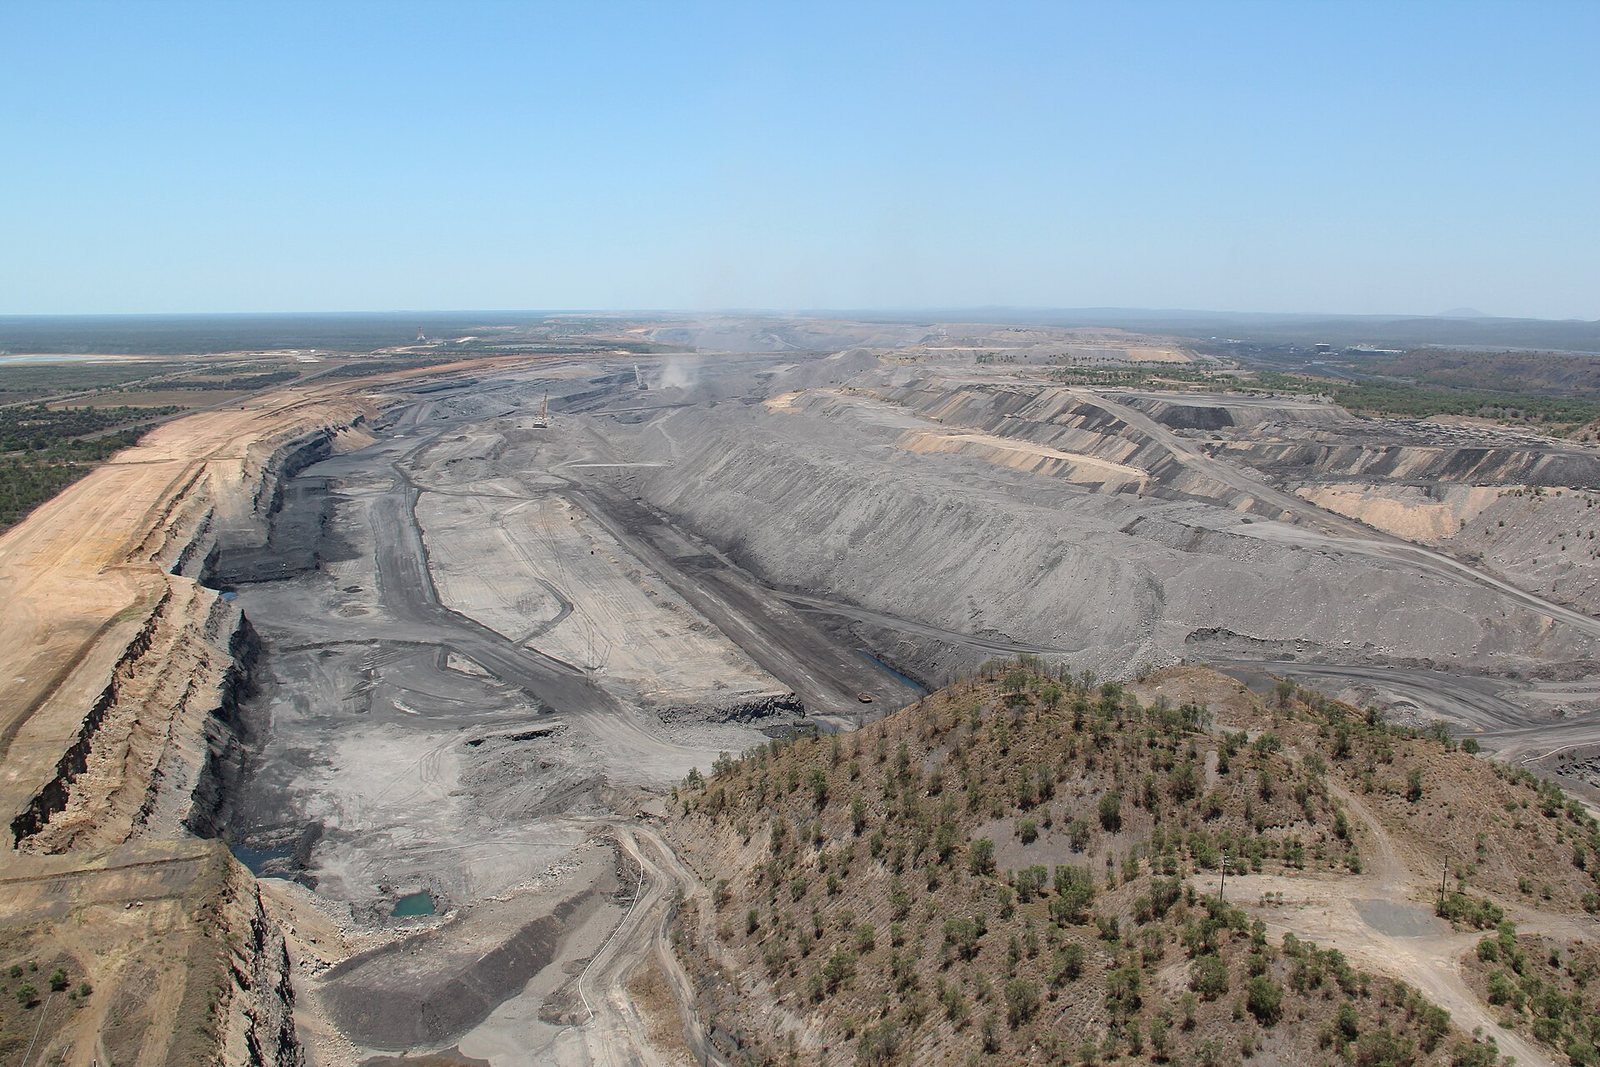

How much of it a technology needs
| Technology | Quantity | Quoted | Basis |
|---|---|---|---|
| HVDC Transmission Cable Being phased out in newer designs. | 10.00–40.00 t | per km of circuit | Moisture barrier sheath in subsea cable |
Indicative range compiled from published technology studies and chemistry; verify against a manufacturer specification before use. Run these numbers at any scale in the material calculator →
Export controls
| Country | Control | Applies to |
|---|---|---|
| Vietnam | Export ban | Raw materials of iron, lead-zinc, chromite, manganese, apatite, and rare earths and deeply processed titanium (2012). ↗ |
USGS Mineral Commodity Summaries 2026, table 4 — controls in effect as of January 2026, excluding controls since lifted.