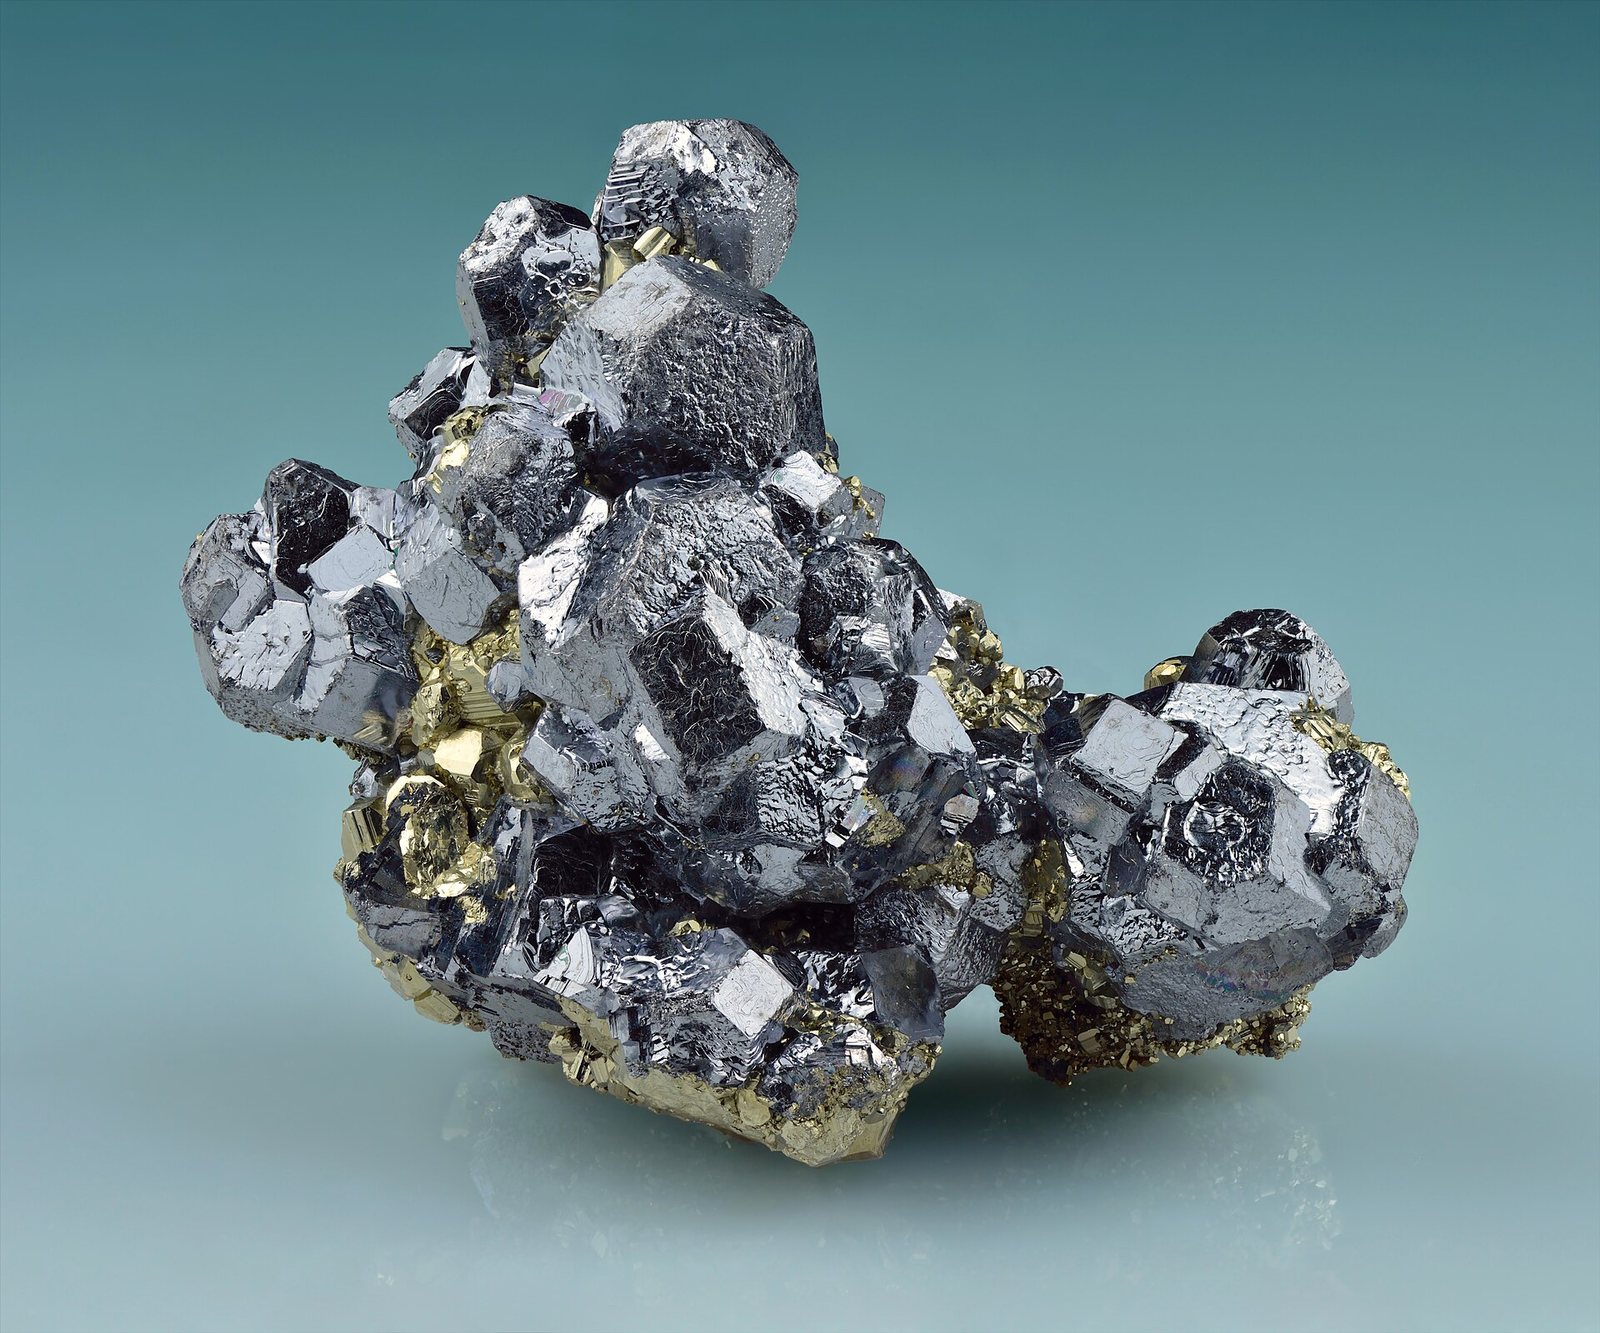
What is it?
A soft, dense, blue-grey metal that blocks radiation and stores charge cheaply — and that is also a well-documented neurotoxin.
Why does it matter?
It has the highest recycling rate of any major metal: most lead in use today has been through a battery before.
Deeper written sections for this material have not been published yet. Everything below is drawn straight from the source datasets and is complete.
Where it comes from in the rock
All ore minerals →These are the minerals that actually carry lead. A deposit is only an orebody if one of them is concentrated enough to pay for digging it up.
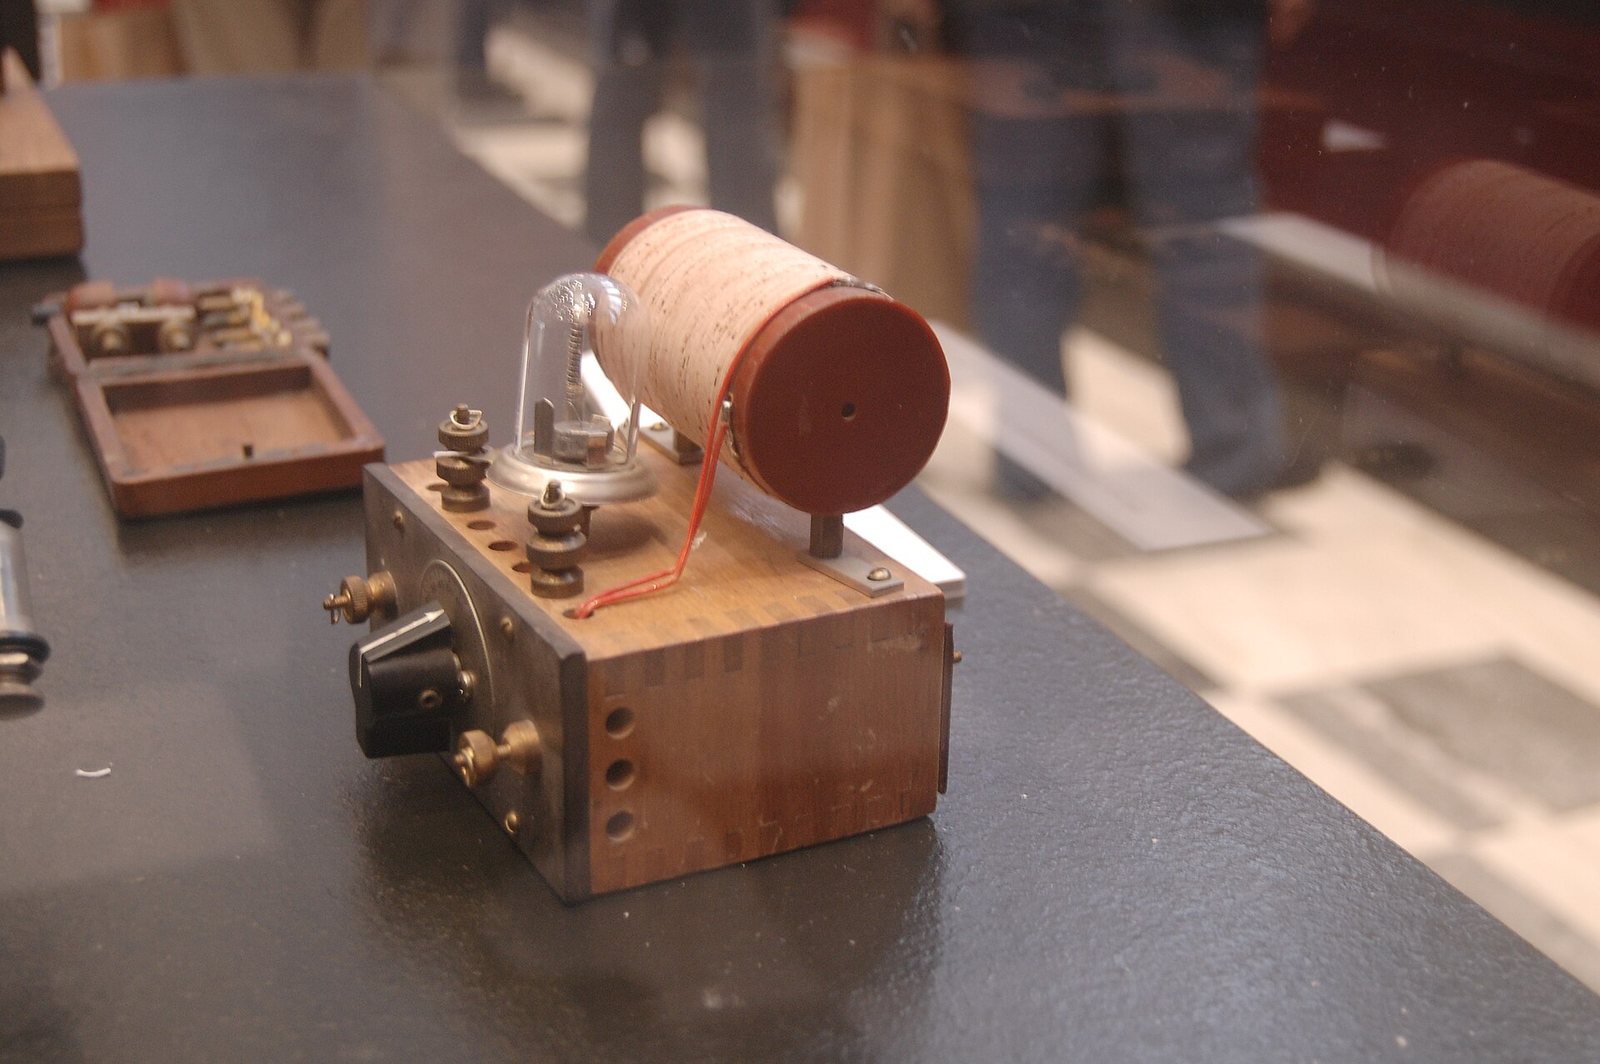
Galena
The main lead ore, and a principal carrier of silver — which is why most silver is a by-product.
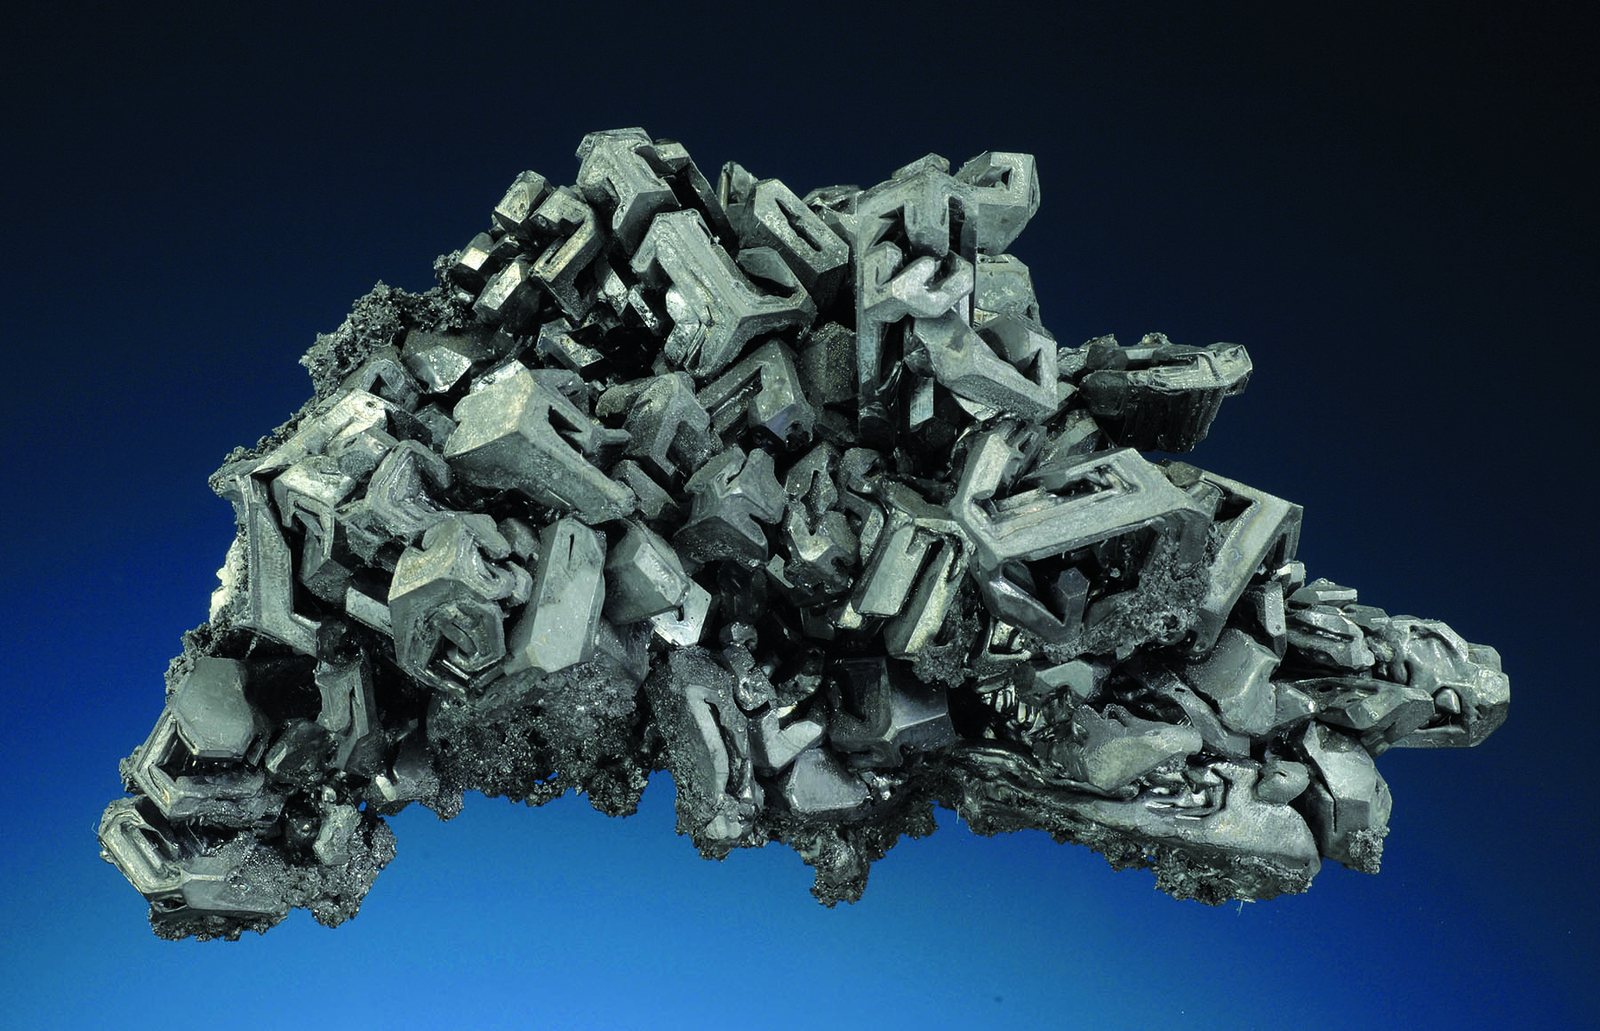
Acanthite (silver sulfide)
The main primary silver mineral, though most silver is recovered from lead-zinc and copper concentrates.
Who produces it
See it on a map →Mine production
Mine productionthousand metric tons 2025 (estimated) World total 4,500 thousand metric tons
USGS Mineral Commodity Summaries 2026 · Mine production of contained lead; refined output includes a large secondary (recycled) share. · source ↗
Scroll the table sideways for the remaining columns.
| Country | Production | Share of world |
|---|---|---|
| China | 1,900 | 42.2% |
| Other countries | 500.0 | 11.1% |
| Australia | 480.0 | 10.7% |
| Peru | 290.0 | 6.4% |
| United States | 280.0 | 6.2% |
| Russia | 260.0 | 5.8% |
| India | 220.0 | 4.9% |
| Mexico | 200.0 | 4.4% |
| Bolivia | 100.0 | 2.2% |
| Turkey | 70.00 | 1.6% |
| Sweden | 70.00 | 1.6% |
| Iran | 70.00 | 1.6% |
| Tajikistan | 40.00 | 0.9% |
| World total | 4,500 | 100% |
“Withheld” means the USGS suppressed the figure to avoid disclosing an individual company's data — it does not mean zero. Country rows do not always sum to the world total because the source rounds each figure independently and does not always break out an “other countries” line.
Who holds the reserves
Reserves
Reservesthousand metric tons 2025
USGS Mineral Commodity Summaries 2026 · source ↗
| Country | Reserves | Share of world |
|---|---|---|
| Australia | 34,000 | 35.8% |
| China | 22,000 | 23.2% |
| Russia | 8,900 | 9.4% |
| Other countries | 5,900 | 6.2% |
| Mexico | 5,600 | 5.9% |
| Peru | 5,000 | 5.3% |
| United States | 4,600 | 4.8% |
| Iran | 2,000 | 2.1% |
| India | 1,900 | 2.0% |
| Sweden | 1,700 | 1.8% |
| Bolivia | 1,600 | 1.7% |
| Turkey | 1,600 | 1.7% |
| Tajikistan | Not applicable | — |
| World total | 95,000 | 100% |
Price
Lead, global price
Annual averageUS$ per tonne
Basis: IMF global price of lead — 99.97% pure, LME spot. Annual averages as published in FRED (IMF primary commodity prices) · source ↗. These are reference annual averages, not a live market quote.
average, North American, cents per pound
Annual averagecents per pound
Basis: average, North American, cents per pound. Annual averages as published in USGS Mineral Commodity Summaries 2026 · source ↗. These are reference annual averages, not a live market quote.
Mines that produce it
All mines →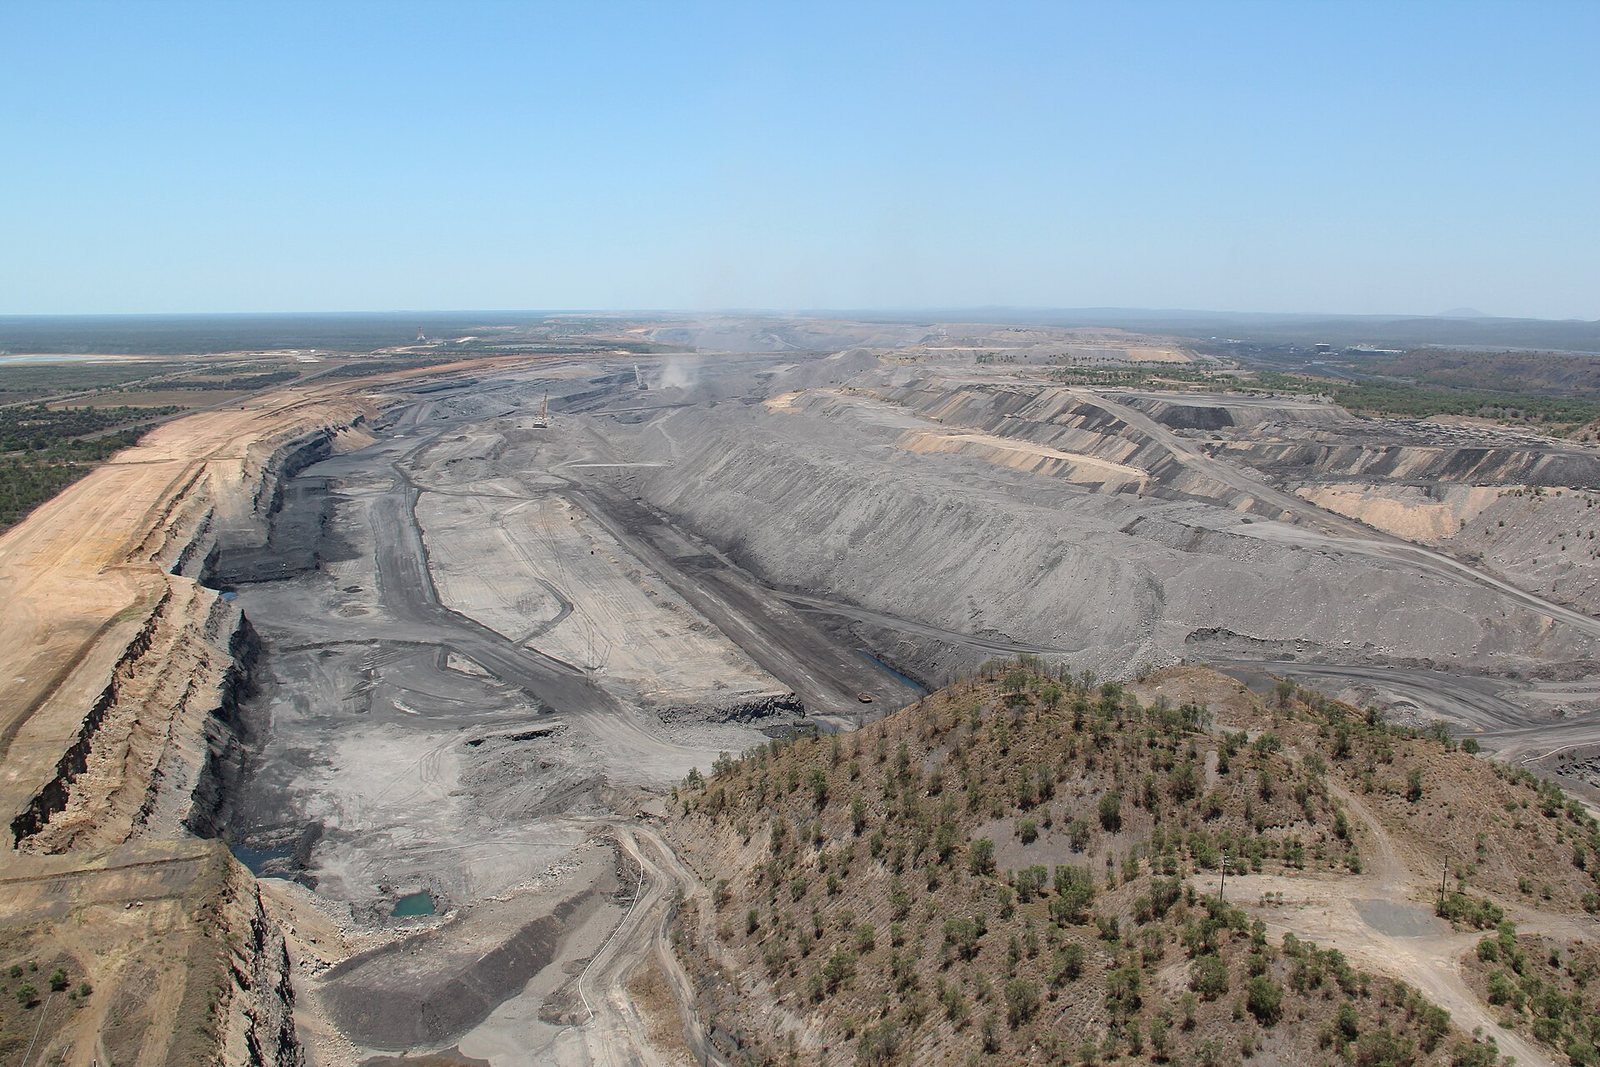
How much of it a technology needs
| Technology | Quantity | Quoted | Basis |
|---|---|---|---|
| HVDC Transmission Cable Being phased out in newer designs. | 10.00–40.00 t | per km of circuit | Moisture barrier sheath in subsea cable |
Indicative range compiled from published technology studies and chemistry; verify against a manufacturer specification before use. Run these numbers at any scale in the material calculator →
Export controls
| Country | Control | Applies to |
|---|---|---|
| Vietnam | Export ban | Raw materials of iron, lead-zinc, chromite, manganese, apatite, and rare earths and deeply processed titanium (2012). ↗ |
USGS Mineral Commodity Summaries 2026, table 4 — controls in effect as of January 2026, excluding controls since lifted.