What is it?
Half-rotted plant matter from waterlogged bogs — the first stage on the road from a swamp to a coal seam.
Why does it matter?
Peatlands hold more carbon than all the world's forests, which is why cutting them for fuel and compost is now contested rather than routine.
Where it is in the Earth
Where it is in the Earth
Peat is not a rock in the conventional sense. It is an accumulation of partially decomposed plant material — leaves, stems, roots, mosses — that has built up in waterlogged conditions where the lack of oxygen slows bacterial decay almost to a standstill. Because organic matter is added faster than it breaks down, the unrotted residue compresses under its own weight into a soft, spongy deposit that can, over thousands of years, reach many metres in depth. Left long enough, buried deep enough, and subjected to heat and pressure, peat would eventually become lignite and then harder coals. What we call a peat bog is therefore the earliest recognisable stage of the coal-forming process, caught before burial has gone very far.
The geographical pattern of peat deposits follows the logic of moisture and cool temperatures. Sustained waterlogging is the first requirement, and that tends to occur either where rainfall reliably exceeds evaporation or where flat, poorly drained terrain lets water pond year-round. Both conditions are well met across the high latitudes of the Northern Hemisphere — Finland, Russia, Canada, the Baltic states and Belarus together account for the overwhelming majority of known reserves. Tropical peatlands exist too, particularly in insular Southeast Asia, where deep deposits formed under equatorial rainfall, but those regions feature little in current commercial extraction. The character of the plant community shapes the peat's properties: bogs dominated by Sphagnum mosses tend to be highly fibrous, acidic and low in nutrients, making them valuable for horticulture, while sedge- and reed-dominated fens produce a more decomposed, darker material that has historically been burned as fuel.
The degree of decomposition within a peat profile is described using the von Post scale, which runs from H1 (entirely undecomposed, water squeezed from the peat is clear) to H10 (completely amorphous, no plant structure visible). Near the surface of an undisturbed bog, von Post values are typically low; deeper layers, under greater pressure and having had longer to decompose anaerobically, read higher on the scale. Harvesters and processors pay close attention to this gradient because horticulture buyers generally want lightly decomposed, fibrous material, while energy applications historically preferred the more humified, denser lower layers.
Getting it out
Getting it out
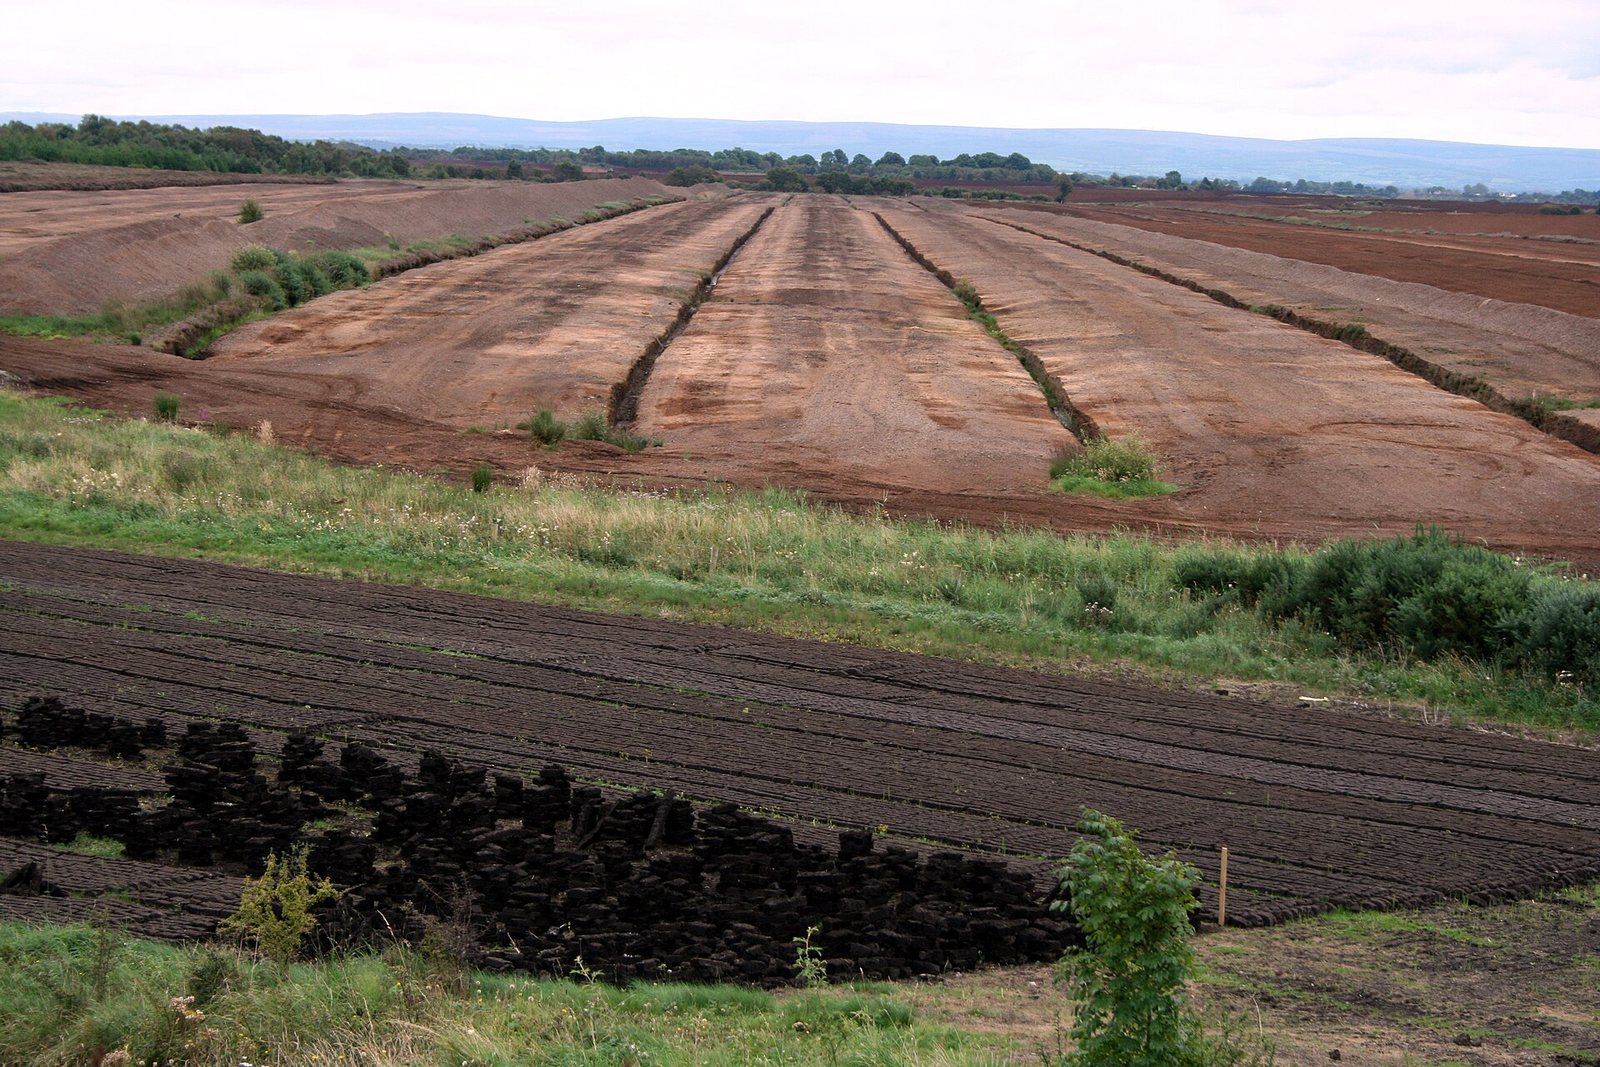
Peat extraction is essentially a surface operation. The deposit lies at or very close to ground level, so there is no underground mining, no shaft sinking and no blasting of hard rock. The practical challenge is almost the opposite: the material is waterlogged and structurally weak, and the working surface is too soft to support heavy equipment without preparation. Before any harvest begins, an area is drained by cutting a network of drainage ditches — a process that can take several seasons before the upper peat layer is dry enough to work. Vegetation is then stripped from the surface and the exposed peat is allowed to dry further under ambient conditions.
Two main harvesting methods are in use. In milled peat production, a rotating drum fitted with cutting teeth shaves a thin layer — typically a few centimetres — from the surface. This milled material is spread to dry in the open air, then harrowed to speed drying, then collected by vacuum harvesters and stacked into storage ridges. The cycle repeats until the growing season ends or rainfall interrupts. Because each pass removes only a small thickness, a productive season may involve many individual cuts across the same field. In sod peat production, extruded sausage-shaped blocks are cut from the surface and left to dry in rows before collection; this method is older and less mechanised, now mostly confined to small-scale or traditional fuel use.
Waste in the conventional sense is minimal — nearly everything removed from the field is saleable in some grade. What does vary greatly is the yield of usable product per hectare per season, which depends heavily on weather, the depth and von Post rating of the deposit, and how far drainage has progressed. The environmental footprint, however, is large relative to the volume extracted. Draining a bog releases carbon dioxide from the now-aerobic peat below the water table, and the surface disturbance destroys the habitat that accumulated the deposit over millennia. This asymmetry — fast extraction, very slow natural regeneration — is the central reason that peat harvesting is subject to increasing regulatory scrutiny in many producing countries.
What pulls on it
What pulls on it
Peat serves two quite distinct markets that have followed opposite trajectories over recent decades. The horticultural market — growing media for professional nurseries, mushroom cultivation substrates, and retail garden composts — has remained the more durable of the two. Commercial horticulture values Sphagnum peat for properties that are genuinely difficult to replicate cheaply at scale: consistent particle structure, stable chemistry, low nutrient content that gives growers precise control over feeding, and reliable water retention combined with good drainage. Canada supplies a large share of this market internationally, with the United States being by far the dominant destination for Canadian production, as the import reliance figure in the statistics table indicates.
Energy use of peat tells a different story. Several northern European countries, most notably Finland and Ireland, built electricity generating capacity and district heating systems around domestic peat, treating it as a locally available solid fuel at a time when energy security arguments favoured indigenous resources over imported coal or gas. That logic has weakened considerably as climate policy has tightened. Peat releases carbon dioxide when burned, and its harvest also releases stored carbon from the drained bog below — giving it a carbon footprint that compares unfavourably even with coal on some accounting methods. Policy-driven reductions in peat burning for electricity and heat are already visible in production statistics from Finland and several other European producers, and this contraction is expected to continue as emissions targets take effect.
For demand to shift sharply in the horticultural segment, a substitute would need to match peat's physical and chemical consistency at comparable cost and at the volumes required by industrial-scale nurseries. For energy use, the direction of change is already determined by policy rather than price: the question is the pace of wind-down rather than whether it will occur. The carbon-sequestration value of intact peatlands is increasingly being recognised in environmental accounting, which adds a further policy dimension to the economic case for extraction.
Who produces it
See it on a map →Mine production
Mine productionthousand metric tons 2025 (estimated) World total 17,000 thousand metric tons
USGS Mineral Commodity Summaries 2026 · Gross weight, air-dried basis. · source ↗
Scroll the table sideways for the remaining columns.
| Country | Production | Share of world |
|---|---|---|
| Finland | 2,500 | 14.7% |
| Canada | 2,000 | 11.8% |
| Latvia | 2,000 | 11.8% |
| Belarus | 1,800 | 10.6% |
| Sweden | 1,800 | 10.6% |
| Russia | 1,800 | 10.6% |
| Estonia | 1,100 | 6.5% |
| Other countries | 960.0 | 5.6% |
| Poland | 890.0 | 5.2% |
| Germany | 830.0 | 4.9% |
| Lithuania | 540.0 | 3.2% |
| Ukraine | 450.0 | 2.6% |
| United States | 330.0 | 1.9% |
| World total | 17,000 | 100% |
“Withheld” means the USGS suppressed the figure to avoid disclosing an individual company's data — it does not mean zero. Country rows do not always sum to the world total because the source rounds each figure independently and does not always break out an “other countries” line.
Who holds the reserves
Reserves
Reservesthousand metric tons 2025
USGS Mineral Commodity Summaries 2026 · source ↗
| Country | Reserves | Share of world |
|---|---|---|
| Finland | 6,000,000 | 46.2% |
| Belarus | 2,600,000 | 20.0% |
| Other countries | 1,400,000 | 10.8% |
| Russia | 1,000,000 | 7.7% |
| Canada | 720,000 | 5.5% |
| Estonia | 570,000 | 4.4% |
| Lithuania | 210,000 | 1.6% |
| United States | 150,000 | 1.2% |
| Latvia | 150,000 | 1.2% |
| Poland | s | — |
| Sweden | s | — |
| Ukraine | s | — |
| Germany | s | — |
| World total | 13,000,000 | 100% |
Price
average unit value, f.o.b. mine, dollars per metric ton
Annual averagedollars per metric ton
Basis: average unit value, f.o.b. mine, dollars per metric ton. Annual averages as published in USGS Mineral Commodity Summaries 2026 · source ↗. These are reference annual averages, not a live market quote.