South America
Argentina
What comes out of the ground here, what is still in it, and who operates the assets.
6 materials produced
1 mines in the database
0 plants in the database
What it produces
Maps →USGS Mineral Commodity Summaries 2026 · 2025 (estimated) · each row keeps the unit the source uses for that commodity · source ↗
Scroll the table sideways for the remaining columns.
| Material | Series | Production | Unit | Share of world |
|---|---|---|---|---|
| Lithium | Mine production | 23,000 | metric tons | 7.9% |
| Industrial Sand & Gravel | Mine production | 4,500 | thousand metric tons | 1.0% |
| Silver | Mine production | 800.0 | metric tons | 3.1% |
| Strontium | Mine production | 700.0 | metric tons | 0.2% |
| Diatomite | Mine production | 190.0 | thousand metric tons | 7.6% |
| Perlite | Production | 30.00 | thousand metric tons | 0.7% |
What it holds in reserve
USGS Mineral Commodity Summaries 2026 · reserves as most recently published
| Material | Series | Reserves | Unit | Share of world |
|---|---|---|---|---|
| Lithium | Reserves | 4,400,000 | metric tons | 11.9% |
| Silver | Reserves | 6,500 | metric tons | 1.1% |
| Diatomite | Reserves | Not applicable | thousand metric tons | — |
| Perlite | Reserves | Not applicable | thousand metric tons | — |
| Strontium | Reserves | Not applicable | metric tons | — |
Mines in the database
All →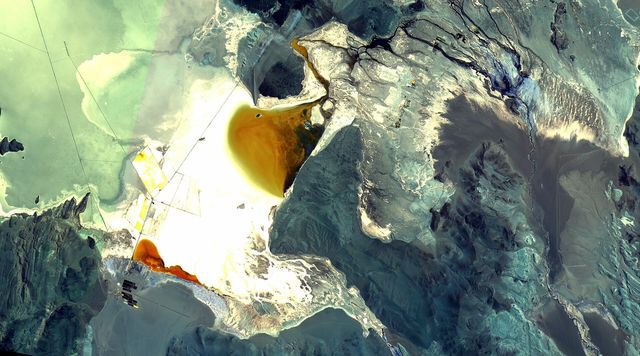
A leading U.S. import source for
USGS Mineral Commodity Summaries 2026 · major U.S. import sources, 2021–2024