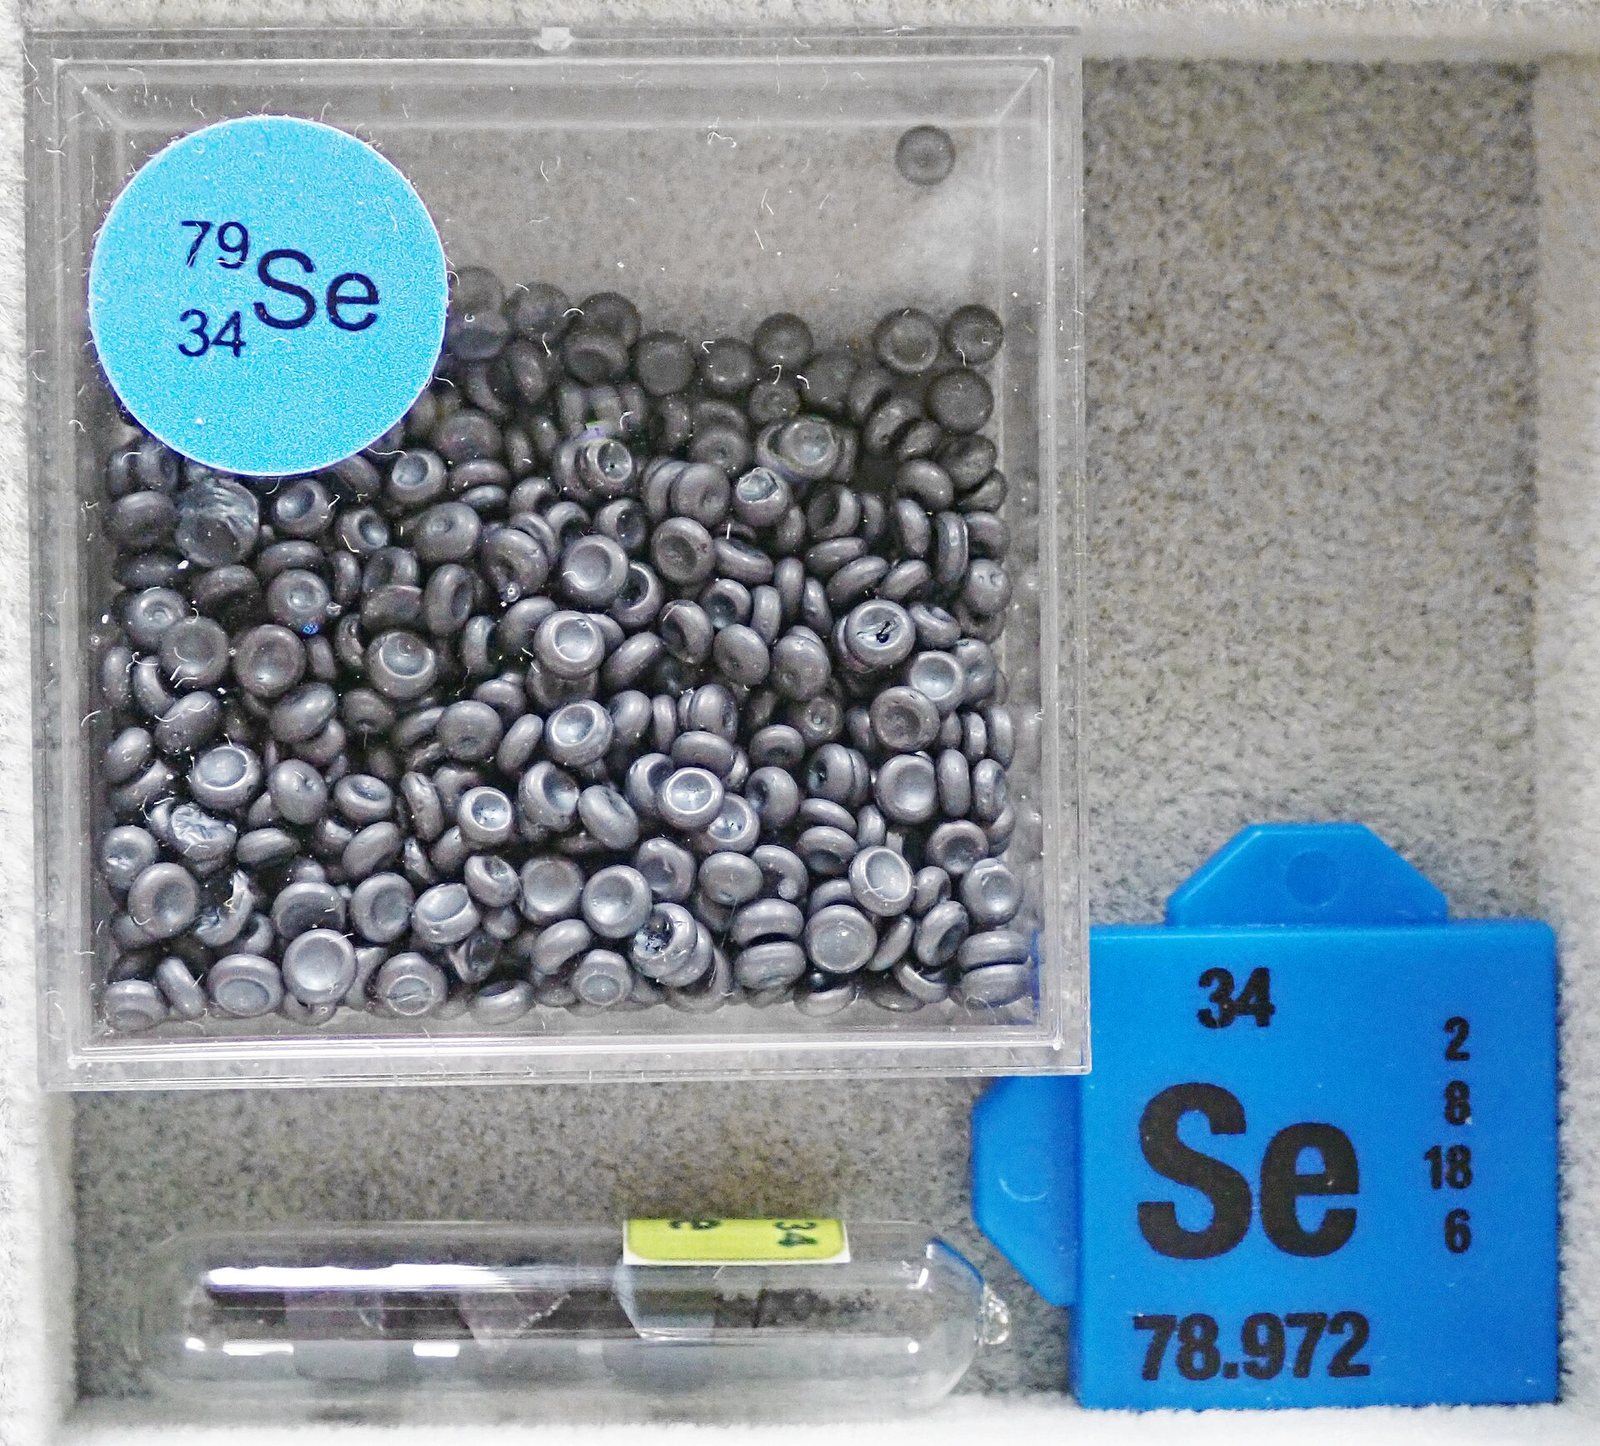
Was ist das?
An element recovered from copper refinery slimes, used in glass, in animal feed and in thin-film solar cells.
Warum ist das wichtig?
Selenium is a required trace nutrient and a required semiconductor dopant, which is an unusual pair of jobs.
Where it is in the Earth
Selenium belongs to the chalcogen group of elements, which means it has a strong chemical affinity for sulfur and for the metals that sulfur tends to accompany underground. In practice, selenium does not form ore deposits of its own in any economically meaningful sense. Instead, it substitutes for sulfur in the crystal structures of sulfide minerals — principally copper sulfides such as chalcopyrite and bornite — at concentrations so low that selenium is invisible to any extraction process designed for the host mineral itself. The tables on this page show no selenium ore minerals because there are none in commercial use; the element arrives as a chemical passenger rather than a target.
The geological settings that matter are therefore the same settings that matter for copper: large porphyry copper deposits, formed when silica-rich magmas intruded into continental crust and released hot, metal-laden fluids that mineralised the surrounding rock over enormous volumes; and volcanic-hosted massive sulfide deposits, where submarine volcanic activity once precipitated dense masses of metal sulfides on the seafloor. Both deposit types concentrate copper and, with it, selenium. The selenium content of any given copper ore varies considerably from deposit to deposit, controlled by the original magma chemistry and by the degree of subsequent weathering, which can leach selenium selectively. This variability is one reason why selenium supply is difficult to predict even when copper production is well understood.
Geographically, the map of selenium production follows the map of copper smelting rather than the map of copper mining, because it is at the smelter and refinery — not the mine — where selenium is actually captured. Countries that process large volumes of copper concentrates, whether from domestic mines or imported from elsewhere, tend to dominate selenium output. China's position at the top of the production table reflects its scale as a copper processor; Japan's historically significant output reflects decades of importing and smelting concentrates from around the Pacific.
Getting it out
Selenium is not mined. That statement needs a moment's explanation, because it runs counter to the way most materials on this site are described. There is no selenium mine anywhere in the world, no shaft sunk for it, no open pit blasted for it, no grade measured in terms of kilograms of selenium per tonne of rock. The element is recovered entirely as a by-product of copper production, and the decision to mine the copper deposit that carries it is made entirely on the economics of copper, not selenium. This gives selenium the tag shown in the database: by-product only.
The practical sequence begins at a copper smelter, where sulfide concentrates are roasted and smelted at high temperature. Selenium, being volatile at smelting temperatures, tends to follow the sulfur dioxide gas stream rather than staying with the molten metal. It can be captured from the gas at this stage in some flowsheets, but the more consistent and widely used route is electrorefining. In electrorefining, impure copper anodes are dissolved in a sulfuric acid bath and the copper is deposited in pure form on a cathode. The impurities — selenium among them, along with tellurium, silver, gold and platinum-group metals — do not dissolve cleanly and instead accumulate as a sludge on the surface of the dissolving anode. This sludge is called anode slime, and it is the raw material from which selenium is extracted.
The concept of grade, as used for conventional mining, does not translate directly here. What matters instead is the selenium content of the anode slime, which varies with the ore source, and the volume of copper anodes being refined. A refinery processing a large tonnage of copper anodes will generate a proportionally larger mass of slime, but the selenium yield per tonne of copper refined differs from one refinery to the next depending on where the concentrates came from. This coupling to copper throughput is the defining constraint of selenium supply and will be returned to in the section on supply risk.
What pulls on it
Selenium sits at an unusual intersection: it is simultaneously a micronutrient without which certain biochemical processes in animals and humans do not function correctly, and a semiconductor material whose electronic properties make it useful in a handful of specific industrial applications. These two roles are largely independent of each other, served by different product forms, and respond to different economic signals.
The glass industry has historically been one of the larger consumers. Selenium compounds give glass a neutral grey or bronze tint and can counteract the green colour that iron impurities produce in ordinary glass. As architectural glass standards have become more demanding — thicker coatings, more precise colour control — the use of selenium in some formulations has shifted, though it remains relevant in specialist products. Separately, selenium has long been used as a red or orange pigment in ceramics and plastics, though environmental pressure on cadmium-selenium pigments has reduced this application over time. The free-machining steel sector adds selenium to certain alloy grades to improve machinability, though this is a relatively small share of total demand.
Animal nutrition represents a structurally stable demand base. Selenium is deficient in soils across large parts of the world, which means livestock fed on locally grown feed may not obtain adequate dietary selenium; sodium selenite is added to compound feeds and mineral supplements to correct this. This use is regulated and relatively price-inelastic — the dose is small, the cost per animal is negligible, and there is no practical alternative. The use that has attracted the most attention in recent years is thin-film solar photovoltaics, specifically copper indium gallium selenide cells, known as CIGS. CIGS cells use selenium as a core component of the photoactive semiconductor layer. Growth in CIGS manufacturing would increase selenium demand noticeably, given how small the overall market is, but CIGS competes against silicon-based solar technologies that have seen sustained cost reductions, and its market share has not grown as quickly as some earlier projections suggested.
Turning ore into product Ebene 3
Anode slime processing is a dedicated metallurgical operation, typically carried out either at the copper refinery itself or at a separate facility that receives slime from multiple refineries. The slime arriving from the electrolytic tanks is a complex mixture: copper, nickel, selenium, tellurium, silver, gold, and sometimes platinum-group metals are all present, each requiring a different separation step. The first objective is usually to remove the bulk copper and nickel by leaching with dilute sulfuric acid or by a pressure oxidation step, leaving a residue enriched in the less soluble components including selenium.
Selenium is then separated from the residue — which at this point is sometimes called decopperised slime — by one of two main routes. In the soda ash fusion or roasting route, the slime is mixed with sodium carbonate and heated, converting selenium to sodium selenite or selenate, which is water-soluble and can be leached away from the remaining precious metals. Alternatively, a sulfatising roast can volatilise selenium as selenium dioxide, which is then captured in a wet scrubbing system and reduced to elemental selenium by treatment with sulfur dioxide gas. The reduction reaction deposits selenium as a red or grey powder, which after further refining — typically involving distillation to drive off remaining impurities — becomes commercial-grade selenium powder or is melted into pellets. Losses occur at every stage: some selenium escapes with the copper leach solutions, some is carried off with furnace gases not fully captured, and the recovery efficiency across the whole chain is substantially below one hundred percent, though the actual figures vary by plant and are rarely disclosed publicly.
The commercial product form matters for the end use. Elemental selenium in powder or pellet form is the standard traded commodity for glass and pigment applications. For animal nutrition, the element is sold as sodium selenite, which requires a separate chemical synthesis step from elemental selenium. For thin-film photovoltaic manufacture, extremely high purity selenium is required, and an additional purification stage — often zone refining or repeated distillation — is needed beyond the standard refinery output. These quality tiers are distinct markets with distinct pricing, even though they draw from the same upstream slime-processing chain.
Substitution and recycling Ebene 3
Substitution for selenium is possible in some end uses but comes with meaningful trade-offs. In glass colouring and decolourising, alternative chemistry exists — iron and cobalt compounds, for instance, can achieve some similar visual effects — but the precise spectral properties of selenium-containing formulations are not exactly reproduced, which matters for architectural glass specifications. In red and orange pigments, azo-based organic pigments can replace cadmium-selenium pigments and have largely done so under regulatory pressure, which represents a case where substitution happened at scale but was driven by environmental regulation rather than economics or performance.
In free-machining steel, sulfur and lead are the main alternatives for improving machinability, and both have been used for much longer than selenium; the choice among them is typically made on the basis of specific alloy properties required by the end customer rather than on selenium availability. In the thin-film solar sector, CIGS has no simple drop-in substitute within the thin-film category, but silicon-based photovoltaics are functionally substitutable at the system level. The competitive pressure from silicon is real and ongoing, though CIGS retains advantages in certain applications such as flexible substrates and low-light performance.
Recycling of selenium is limited in practice. The element is dispersed in glass at low concentrations, in animal feed it is metabolised, and in solar panels it is present in thin layers bonded to substrates. End-of-life CIGS panel recycling is technically feasible and small-scale programmes exist, but the infrastructure is not developed at a scale that returns significant quantities to the market. The primary reason is economic: selenium values in a panel are small relative to the cost of collection and processing, and secondary selenium from this source currently contributes little to overall supply. This may change as the installed base of CIGS panels grows and as recycling obligations expand under extended producer responsibility regulations in various jurisdictions, but at present recycling is not a meaningful supply buffer.
Wer es produziert
Auf einer Karte anzeigen →Refinery production
Refinery productionmetric tons 2025 (geschätzt) Weltgesamt 3,800 metric tons
USGS Mineral Commodity Summaries 2026 · Refinery production; a by-product of copper electrorefining. · Quelle ↗
Tabelle seitwärts scrollen, um die restlichen Spalten zu sehen.
| Land | Produktion | Anteil an der Weltproduktion |
|---|---|---|
| China | 2,000 | 52.6% |
| Japan | 640.0 | 16.8% |
| Russia | 320.0 | 8.4% |
| Belgium | 200.0 | 5.3% |
| Canada | 130.0 | 3.4% |
| India | 90.00 | 2.4% |
| Mexico | 88.00 | 2.3% |
| Serbia | 71.00 | 1.9% |
| Poland | 67.00 | 1.8% |
| Kazakhstan | 50.00 | 1.3% |
| Peru | 48.00 | 1.3% |
| Germany | 47.00 | 1.2% |
| Turkey | 43.00 | 1.1% |
| Finland | 39.00 | 1.0% |
| South Africa | 10.00 | 0.3% |
| Uzbekistan | 2.00 | 0.1% |
| Other countries | Not applicable | — |
| Weltgesamt | 3,800 | 100% |
Refinery production: crude and anode slimes
Refinery production: crude and anode slimesmetric tons 2025 (geschätzt)
USGS Mineral Commodity Summaries 2026 · Refinery production; a by-product of copper electrorefining. · Quelle ↗
Tabelle seitwärts scrollen, um die restlichen Spalten zu sehen.
| Land | Produktion | Anteil an der Weltproduktion |
|---|---|---|
| United States | Withheld | — |
„Withheld" bedeutet, dass der USGS den Wert zurückgehalten hat, um keine Rückschlüsse auf Daten einzelner Unternehmen zuzulassen – er bedeutet nicht null. Die Länderwerte addieren sich nicht immer zum Weltgesamt, weil die Quelle jeden Einzelwert unabhängig rundet und eine Zeile „sonstige Länder" nicht immer ausweist.
Preis
annual average, dollars per kilogram: Europe
Jahresdurchschnittdollars per kilogram
Grundlage: annual average, dollars per kilogram: Europe. Jahresdurchschnitte gemäß Veröffentlichung in USGS Mineral Commodity Summaries 2026 · Quelle ↗. Dies sind jährliche Referenzdurchschnittswerte, kein Live-Marktpreis.
annual average, dollars per kilogram: United States
Jahresdurchschnittdollars per kilogram
Grundlage: annual average, dollars per kilogram: United States. Jahresdurchschnitte gemäß Veröffentlichung in USGS Mineral Commodity Summaries 2026 · Quelle ↗. Dies sind jährliche Referenzdurchschnittswerte, kein Live-Marktpreis.
Wo es aufbereitet und raffiniert wird
| Anlage | Art | Stufe | Land | Rolle |
|---|---|---|---|---|
| Atlantic Copper Smelter, Huelva | Hütte | Aufbereitung | Spain | Ausgabe |
Wofür es verwendet wird
Alle Endmärkte →| Endmarkt | Was es dort tut | Bedeutung |
|---|---|---|
| Agriculture & Food | Livestock feed supplement | Gegenwart |