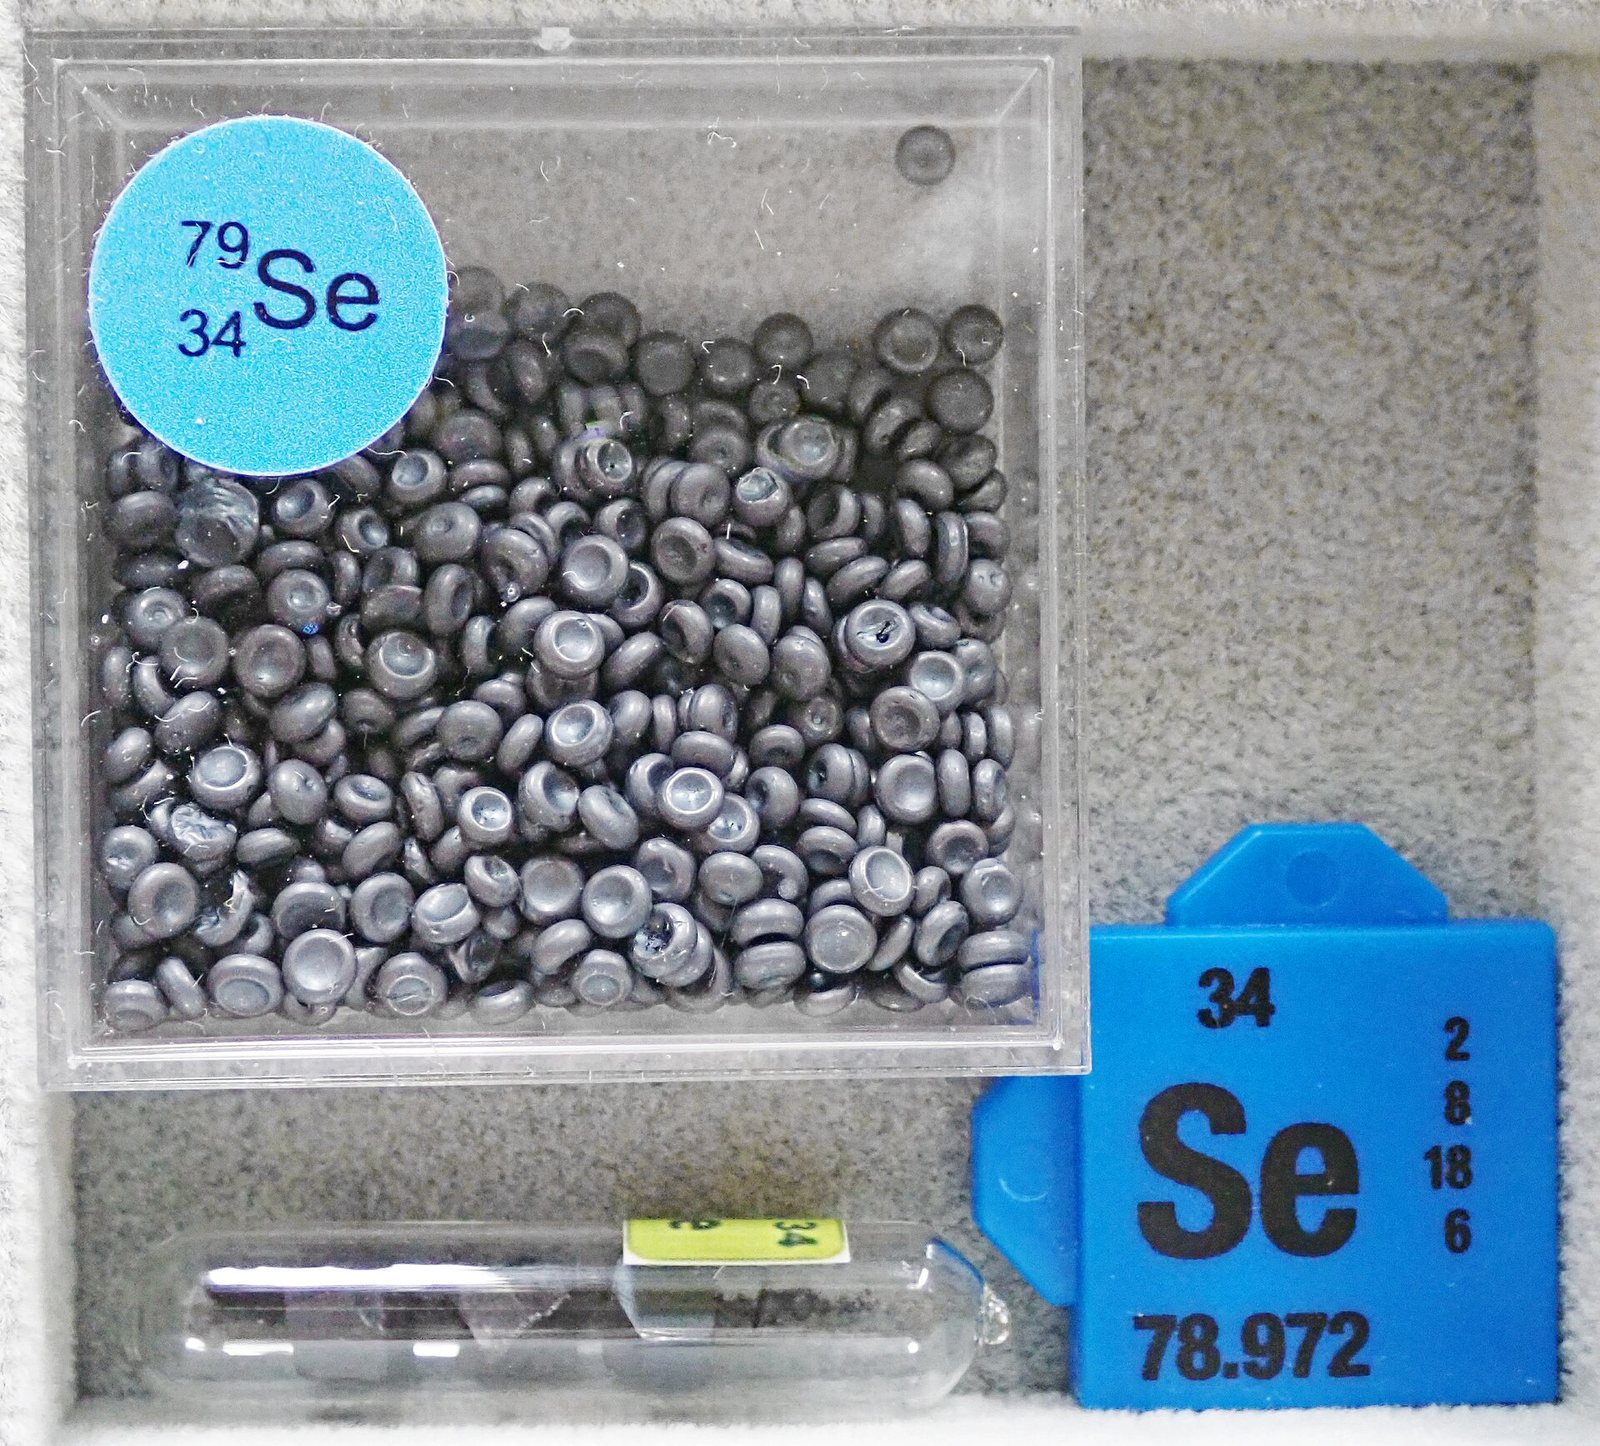
Che cos'è?
An element recovered from copper refinery slimes, used in glass, in animal feed and in thin-film solar cells.
Perché è importante?
Selenium is a required trace nutrient and a required semiconductor dopant, which is an unusual pair of jobs.
Where it is in the Earth
Selenium belongs to the chalcogen group of elements, which means it has a strong chemical affinity for sulfur and for the metals that sulfur tends to accompany underground. In practice, selenium does not form ore deposits of its own in any economically meaningful sense. Instead, it substitutes for sulfur in the crystal structures of sulfide minerals — principally copper sulfides such as chalcopyrite and bornite — at concentrations so low that selenium is invisible to any extraction process designed for the host mineral itself. The tables on this page show no selenium ore minerals because there are none in commercial use; the element arrives as a chemical passenger rather than a target.
The geological settings that matter are therefore the same settings that matter for copper: large porphyry copper deposits, formed when silica-rich magmas intruded into continental crust and released hot, metal-laden fluids that mineralised the surrounding rock over enormous volumes; and volcanic-hosted massive sulfide deposits, where submarine volcanic activity once precipitated dense masses of metal sulfides on the seafloor. Both deposit types concentrate copper and, with it, selenium. The selenium content of any given copper ore varies considerably from deposit to deposit, controlled by the original magma chemistry and by the degree of subsequent weathering, which can leach selenium selectively. This variability is one reason why selenium supply is difficult to predict even when copper production is well understood.
Geographically, the map of selenium production follows the map of copper smelting rather than the map of copper mining, because it is at the smelter and refinery — not the mine — where selenium is actually captured. Countries that process large volumes of copper concentrates, whether from domestic mines or imported from elsewhere, tend to dominate selenium output. China's position at the top of the production table reflects its scale as a copper processor; Japan's historically significant output reflects decades of importing and smelting concentrates from around the Pacific.
Getting it out
Selenium is not mined. That statement needs a moment's explanation, because it runs counter to the way most materials on this site are described. There is no selenium mine anywhere in the world, no shaft sunk for it, no open pit blasted for it, no grade measured in terms of kilograms of selenium per tonne of rock. The element is recovered entirely as a by-product of copper production, and the decision to mine the copper deposit that carries it is made entirely on the economics of copper, not selenium. This gives selenium the tag shown in the database: by-product only.
The practical sequence begins at a copper smelter, where sulfide concentrates are roasted and smelted at high temperature. Selenium, being volatile at smelting temperatures, tends to follow the sulfur dioxide gas stream rather than staying with the molten metal. It can be captured from the gas at this stage in some flowsheets, but the more consistent and widely used route is electrorefining. In electrorefining, impure copper anodes are dissolved in a sulfuric acid bath and the copper is deposited in pure form on a cathode. The impurities — selenium among them, along with tellurium, silver, gold and platinum-group metals — do not dissolve cleanly and instead accumulate as a sludge on the surface of the dissolving anode. This sludge is called anode slime, and it is the raw material from which selenium is extracted.
The concept of grade, as used for conventional mining, does not translate directly here. What matters instead is the selenium content of the anode slime, which varies with the ore source, and the volume of copper anodes being refined. A refinery processing a large tonnage of copper anodes will generate a proportionally larger mass of slime, but the selenium yield per tonne of copper refined differs from one refinery to the next depending on where the concentrates came from. This coupling to copper throughput is the defining constraint of selenium supply and will be returned to in the section on supply risk.
What pulls on it
Selenium sits at an unusual intersection: it is simultaneously a micronutrient without which certain biochemical processes in animals and humans do not function correctly, and a semiconductor material whose electronic properties make it useful in a handful of specific industrial applications. These two roles are largely independent of each other, served by different product forms, and respond to different economic signals.
The glass industry has historically been one of the larger consumers. Selenium compounds give glass a neutral grey or bronze tint and can counteract the green colour that iron impurities produce in ordinary glass. As architectural glass standards have become more demanding — thicker coatings, more precise colour control — the use of selenium in some formulations has shifted, though it remains relevant in specialist products. Separately, selenium has long been used as a red or orange pigment in ceramics and plastics, though environmental pressure on cadmium-selenium pigments has reduced this application over time. The free-machining steel sector adds selenium to certain alloy grades to improve machinability, though this is a relatively small share of total demand.
Animal nutrition represents a structurally stable demand base. Selenium is deficient in soils across large parts of the world, which means livestock fed on locally grown feed may not obtain adequate dietary selenium; sodium selenite is added to compound feeds and mineral supplements to correct this. This use is regulated and relatively price-inelastic — the dose is small, the cost per animal is negligible, and there is no practical alternative. The use that has attracted the most attention in recent years is thin-film solar photovoltaics, specifically copper indium gallium selenide cells, known as CIGS. CIGS cells use selenium as a core component of the photoactive semiconductor layer. Growth in CIGS manufacturing would increase selenium demand noticeably, given how small the overall market is, but CIGS competes against silicon-based solar technologies that have seen sustained cost reductions, and its market share has not grown as quickly as some earlier projections suggested.
Chi lo produce
Visualizza sulla mappa →Refinery production
Refinery productionmetric tons 2025 (stimato) Totale mondiale 3,800 metric tons
USGS Mineral Commodity Summaries 2026 · Refinery production; a by-product of copper electrorefining. · fonte ↗
Scorrere la tabella lateralmente per visualizzare le colonne rimanenti.
| Paese | Produzione | Quota mondiale |
|---|---|---|
| China | 2,000 | 52.6% |
| Japan | 640.0 | 16.8% |
| Russia | 320.0 | 8.4% |
| Belgium | 200.0 | 5.3% |
| Canada | 130.0 | 3.4% |
| India | 90.00 | 2.4% |
| Mexico | 88.00 | 2.3% |
| Serbia | 71.00 | 1.9% |
| Poland | 67.00 | 1.8% |
| Kazakhstan | 50.00 | 1.3% |
| Peru | 48.00 | 1.3% |
| Germany | 47.00 | 1.2% |
| Turkey | 43.00 | 1.1% |
| Finland | 39.00 | 1.0% |
| South Africa | 10.00 | 0.3% |
| Uzbekistan | 2.00 | 0.1% |
| Other countries | Not applicable | — |
| Totale mondiale | 3,800 | 100% |
Refinery production: crude and anode slimes
Refinery production: crude and anode slimesmetric tons 2025 (stimato)
USGS Mineral Commodity Summaries 2026 · Refinery production; a by-product of copper electrorefining. · fonte ↗
Scorrere la tabella lateralmente per visualizzare le colonne rimanenti.
| Paese | Produzione | Quota mondiale |
|---|---|---|
| United States | Withheld | — |
«Withheld» significa che l'USGS ha soppresso il dato per evitare di divulgare informazioni relative a una singola azienda — non equivale a zero. I valori per paese non sempre sommano al totale mondiale perché la fonte arrotonda ciascun dato in modo indipendente e non sempre disaggrega la voce «altri paesi».
Prezzo
annual average, dollars per kilogram: Europe
Media annualedollars per kilogram
Base: annual average, dollars per kilogram: Europe. Medie annuali pubblicate in USGS Mineral Commodity Summaries 2026 · fonte ↗. Queste sono medie annuali di riferimento, non quotazioni di mercato in tempo reale.
annual average, dollars per kilogram: United States
Media annualedollars per kilogram
Base: annual average, dollars per kilogram: United States. Medie annuali pubblicate in USGS Mineral Commodity Summaries 2026 · fonte ↗. Queste sono medie annuali di riferimento, non quotazioni di mercato in tempo reale.
Dove viene lavorato e raffinato
| Impianto | Tipo | Fase | Paese | Ruolo |
|---|---|---|---|---|
| Atlantic Copper Smelter, Huelva | Fonderia | Lavorazione | Spain | Output |
A cosa serve
Tutti i mercati finali →| Mercato finale | Cosa fa lì | Importanza |
|---|---|---|
| Agriculture & Food | Livestock feed supplement | Presente |