In 1947, a geologist in northern Canada noticed that his compass needle swung erratically as he walked across a frozen lake. That deflection eventually led to the discovery of a major iron deposit beneath the ice. The story is almost archetypal: something invisible in the ground disturbs a measurement at the surface, a human notices, and a long chain of investigation begins. Most such chains end in nothing. A few end in a mine. Understanding why requires following that chain from the first anomaly to the drill core.
Reading the ground from a distance
Exploration begins, almost always, before anyone puts a boot on the ground. Aircraft or satellites carry instruments that measure variations in gravity, magnetism, electrical conductivity, or the way rock reflects different wavelengths of light. These are the tools of geophysics: the study of the earth through its physical properties rather than through direct observation.
Magnetic surveys are among the oldest and most widely used. Iron-bearing minerals such as magnetite are strongly magnetic, so a deposit enriched in iron — or in certain sulphide minerals associated with copper, nickel, or gold — can pull the local magnetic field slightly out of line with the regional pattern. The instrument that detects this is a magnetometer, and when it records an anomaly, the geologist's task is to decide whether that anomaly represents something worth investigating or simply a buried dyke of ordinary igneous rock. Most anomalies are the latter.
Gravity surveys work on a similar principle. Dense rock exerts a slightly stronger gravitational pull than less dense rock. A body of massive sulphide ore, which is heavy, may register as a positive gravity anomaly. A salt dome or a cavity may register as a negative one. The measurements involved are extraordinarily small — fractions of a unit called the milligal — but modern instruments resolve them reliably.
Electromagnetic surveys send an electrical signal into the ground and measure how it returns. Rock that conducts electricity — because it contains sulphide minerals or saline water — responds differently from resistive rock. This makes electromagnetic methods particularly useful when the target mineral is itself a conductor, as many base-metal sulphides are.
What the chemistry reveals
Geochemistry works from a different angle. Ore deposits leak. Weathering, groundwater, and the slow diffusion of gases carry trace amounts of metals away from a deposit and into the surrounding soil, stream sediments, and vegetation. By sampling these materials systematically and mapping the concentrations, a geochemist can identify halos of elevated metal that point back toward a source.
Stream-sediment sampling is a practical example. A field team collects sediment from streambeds across a large area, dries and sifts the material, and sends it to a laboratory for chemical analysis. Elevated copper in several adjacent catchments might indicate that erosion is carrying metal down from a source somewhere upstream. The geologist then works up-slope, collecting more closely spaced samples, until the anomaly tightens around a likely source area. This does not confirm a deposit; it confirms that something worth looking at more closely is present in the ground.
Drilling: the only way to be sure
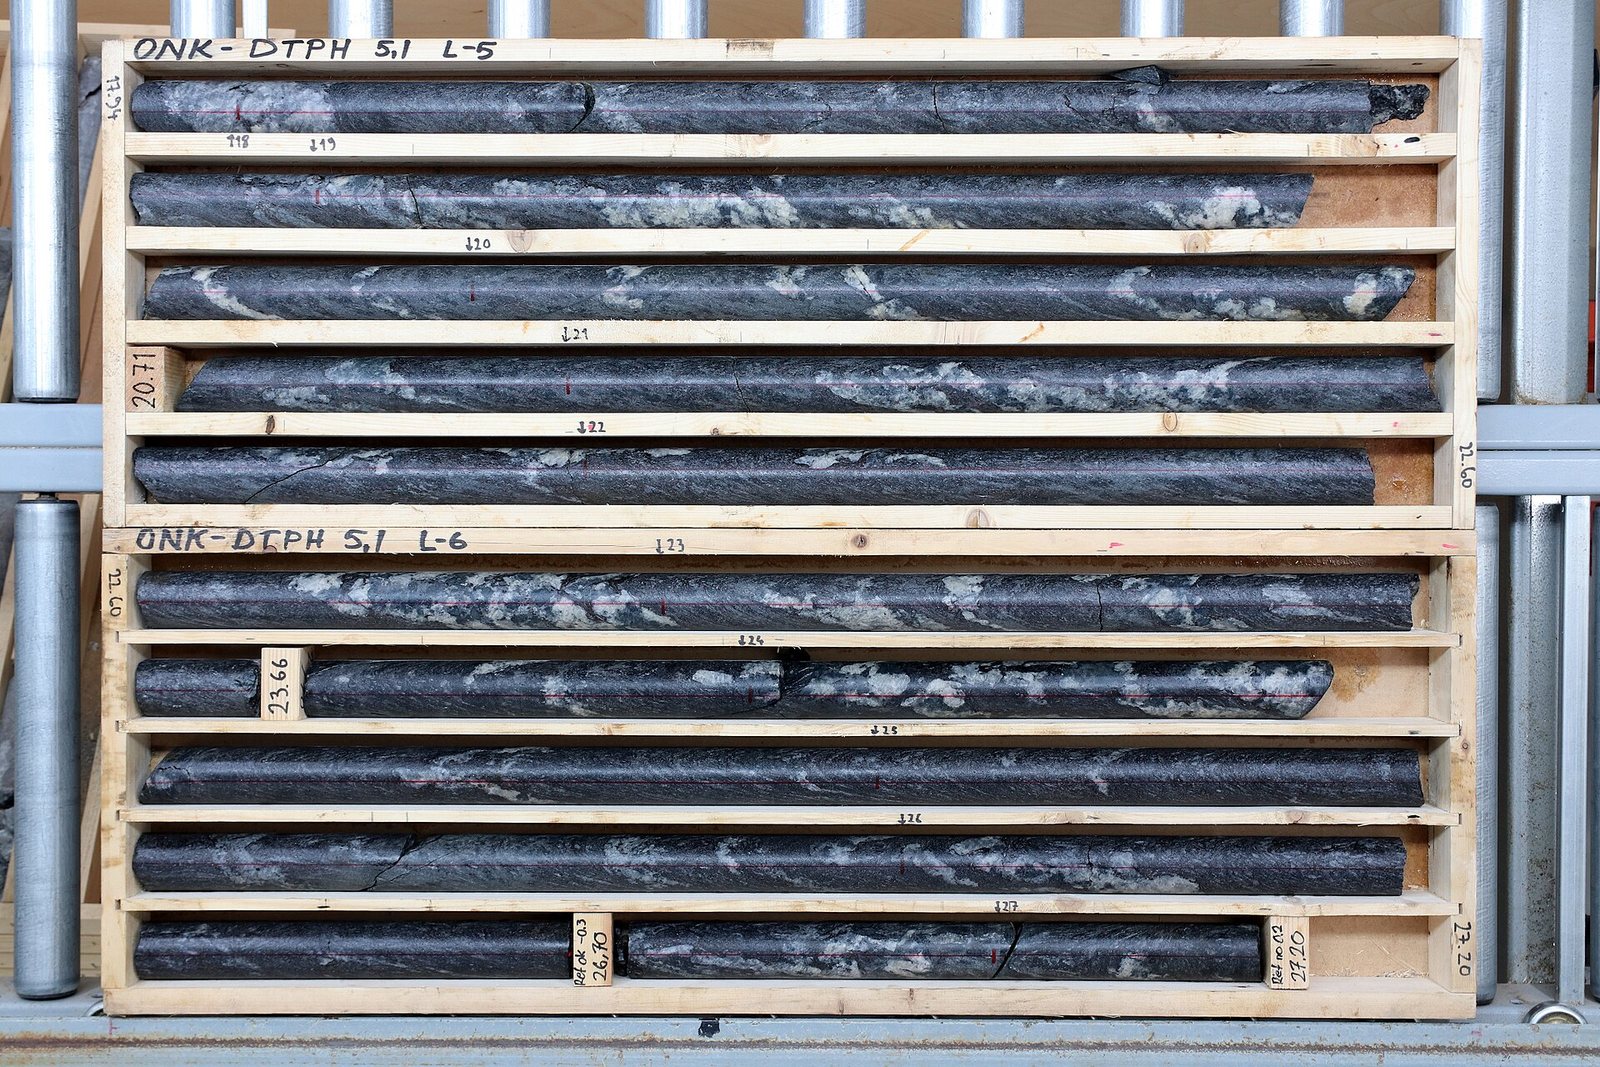
Geophysics and geochemistry can narrow a large region to a small target, but they cannot say what the rock actually looks like or how much metal it contains. For that, drilling is necessary. A diamond drill — so called because the rotating bit is studded with industrial diamonds — bores a hole, typically between five and fifteen centimetres in diameter, and recovers a continuous cylinder of rock called a core. The core is laid out in trays, photographed, described by a geologist, and then sampled for laboratory assay.
The assay tells the geologist the grade of the rock: how many grams of gold per tonne, or what percentage of copper by weight. Grade alone is not enough. A very small body of high-grade rock may be uneconomic to mine. A very large body of low-grade rock may be economic if the geometry is favourable — that is, if the ore is shallow, continuous, and capable of being extracted in bulk.
Here is an illustrative example to show how grade and volume interact. Suppose a geologist is evaluating a porphyry copper target. Early drill holes suggest an average grade of around 0.4% copper across a wide zone. To decide whether further drilling is worthwhile, the team estimates a rough volume from the drill spacing and the geometry suggested by the geophysical data. If that volume — expressed as a mass of rock — is multiplied by 0.4%, the result is a rough estimate of contained copper. At this stage the estimate carries enormous uncertainty; it is called an exploration target, not a resource, and it carries no regulatory standing. It is simply a way of asking whether the numbers are in the right order of magnitude to justify spending more money. In many cases, deeper or wider drilling shows that the grade falls off quickly, the geometry is irregular, or both, and the project is quietly set aside.
The odds against
The statistical reality of mineral exploration is sobering. Industry experience, accumulated over many decades and across commodity types, consistently shows that a very large number of grassroots prospects — areas identified by regional geophysics or geochemistry as worth a first look — are needed to eventually produce a single operating mine. The ratio is often described as somewhere in the hundreds to one, and some studies of certain commodities place it higher. This is not a failure of exploration technique; it is a reflection of how rare it is for all the necessary geological conditions to coincide in one place at sufficient scale and grade to be economically recoverable with available technology.
Each stage of work — reconnaissance geophysics, follow-up geochemistry, first-pass drilling, infill drilling, resource estimation — costs money and eliminates some fraction of the original prospects. The work is cumulative and sequential. A project does not skip from a magnetic anomaly to a mine; it earns the right to each subsequent stage by surviving the previous one. Many never do.
Where to go next
Readers with a background in earth sciences or mine finance will find that this account glosses over several important stages: the formal classification of drill results into measured, indicated, and inferred mineral resources under reporting codes such as JORC or NI 43-101; the role of geostatistics in estimating grade continuity between drill holes; and the distinction between a mineral resource and an ore reserve. Those topics are covered in the level 3 articles on resource estimation and feasibility studies elsewhere in this site.