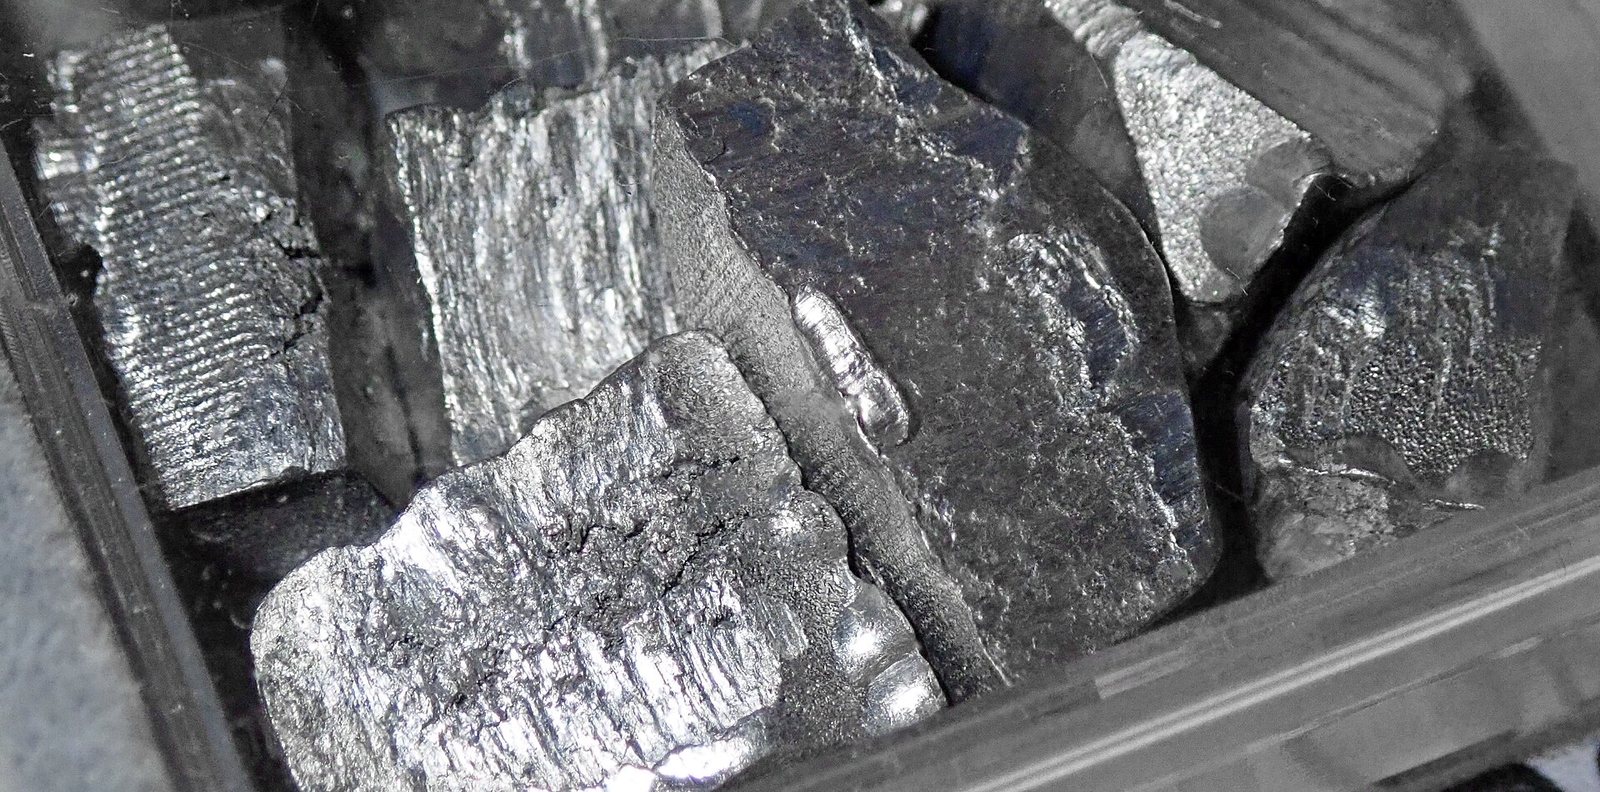
Bu nedir?
A toxic soft metal recovered from zinc refining, now used mainly in thin-film solar panels rather than in the batteries that made it famous.
Neden önemli?
Cadmium telluride solar shows how a regulated waste product can become an energy technology.
Where it is in the Earth
Cadmium does not form ore deposits of its own. It is a trace element that substitutes chemically for zinc inside the crystal structure of sphalerite, the most abundant zinc sulphide mineral. Because zinc and cadmium sit in the same column of the periodic table, their atoms are similar enough in size and charge that cadmium slots into sphalerite's lattice almost without distortion. The result is that cadmium is dispersed invisibly through zinc ore rather than concentrated into a distinct mineral that could be selectively mined. When geologists sample a zinc deposit they typically report cadmium as a ratio to zinc, because the two elements travel together through every geological process that created the deposit.
The zinc deposits that carry cadmium formed in several ways. Sediment-hosted massive sulphide deposits, where metal-rich hydrothermal fluids circulated through ancient seafloor sediments, are among the most important. So are Mississippi Valley-type deposits, where warm brines migrated through carbonate rocks — limestones and dolostones — and deposited zinc and lead sulphides in cavities and fractures. Skarn deposits, formed where magmatic fluids reacted with carbonate rocks near an igneous intrusion, also carry zinc and therefore cadmium. In each setting the controlling factor is the same: a source of zinc and cadmium in solution, a pathway for those fluids to travel, and a chemical trap where sulphides can precipitate. Cadmium's concentration in the final ore depends on the composition of the original hydrothermal fluid, which varies from deposit to deposit and even from one part of a single deposit to another.
Because cadmium piggybacks entirely on zinc, its geographical distribution mirrors that of the zinc industry rather than reflecting any independent geological logic. Countries with large zinc smelting capacity — China foremost among them — produce the most cadmium, regardless of whether the zinc ore mined locally is particularly cadmium-rich. The geology sets the range of cadmium-to-zinc ratios in the ore; the scale of zinc processing determines how much cadmium actually reaches the market.
Getting it out
No mine in the world operates to extract cadmium. Every tonne of cadmium in commercial use is a by-product, meaning it emerges as an unwanted passenger during the mining and smelting of zinc. The mining method used at any given zinc operation — open pit where ore is shallow and the deposit is large and low-grade, underground where ore sits deep or in narrow veins — is chosen entirely on the basis of the zinc economics. Cadmium has no influence on that decision. From the cadmium perspective, the mine is simply a machine for delivering zinc ore to the surface, and cadmium comes along for the ride.
The grade of a zinc ore is expressed as a percentage of zinc by weight. Cadmium grades are far smaller, and are usually expressed in parts per million or as a cadmium-to-zinc ratio. Because these figures are not in the data provided here, it is enough to say that the cadmium content of any given ore parcel is a small fraction of its zinc content, and that this ratio is not fixed — it varies with the ore type and with where in the deposit the material was extracted. In practical terms this means cadmium supply responds to decisions made about zinc, not to any signal specific to cadmium itself. When a zinc mine ramps up, cadmium supply rises. When a zinc smelter closes for maintenance or is shut permanently, cadmium supply falls, regardless of what is happening in the cadmium market.
There is essentially no waste rock moved specifically to win cadmium, because that concept does not apply to a by-product. The relevant waste figures — strip ratio for open pits, dilution and development rock for underground mines — belong entirely to the zinc accounting. Cadmium inherits whatever environmental footprint the zinc operation carries, which is one reason its life-cycle profile is treated as an allocation problem rather than a straightforward calculation.
What pulls on it
For most of the twentieth century cadmium's principal use was in nickel-cadmium rechargeable batteries, the kind that powered portable tools, emergency lighting and early mobile phones. Those batteries have been displaced in most consumer applications by lithium-ion chemistry, and demand from that sector has declined substantially over time. Regulatory pressure played a direct part: the European Union and other jurisdictions restricted or banned cadmium in batteries for consumer products, which accelerated the shift away from nickel-cadmium technology. Industrial nickel-cadmium batteries, which offer tolerance to rapid charging and discharging in applications like aircraft emergency power and railway signalling, retain a market that is more stable but not growing.
The use that is now expanding is cadmium telluride thin-film solar panels. In this technology a very thin layer of cadmium telluride acts as the semiconductor that converts sunlight to electricity. The panels are manufactured at scale by a small number of producers and have achieved conversion efficiencies that make them commercially competitive with silicon-based panels in utility-scale installations. The cadmium content per unit of generating capacity — somewhere between 25 and 60 kilograms per megawatt — means that growth in solar deployment translates directly into cadmium demand, though the total tonnage consumed is still modest compared to the scale of the zinc industry that produces it as a by-product.
Other uses — cadmium-based pigments, surface coatings on metal parts, stabilisers in plastics — have contracted under environmental regulation and substitution pressure. The net picture is a material whose traditional large market has shrunk, whose regulatory environment remains restrictive, and whose growth now depends almost entirely on the pace of thin-film solar installation. A significant slowdown in that technology, or a shift in solar manufacturing toward other semiconductor materials, would reduce demand with few other markets large enough to absorb the difference.
Kayada nereden gelir
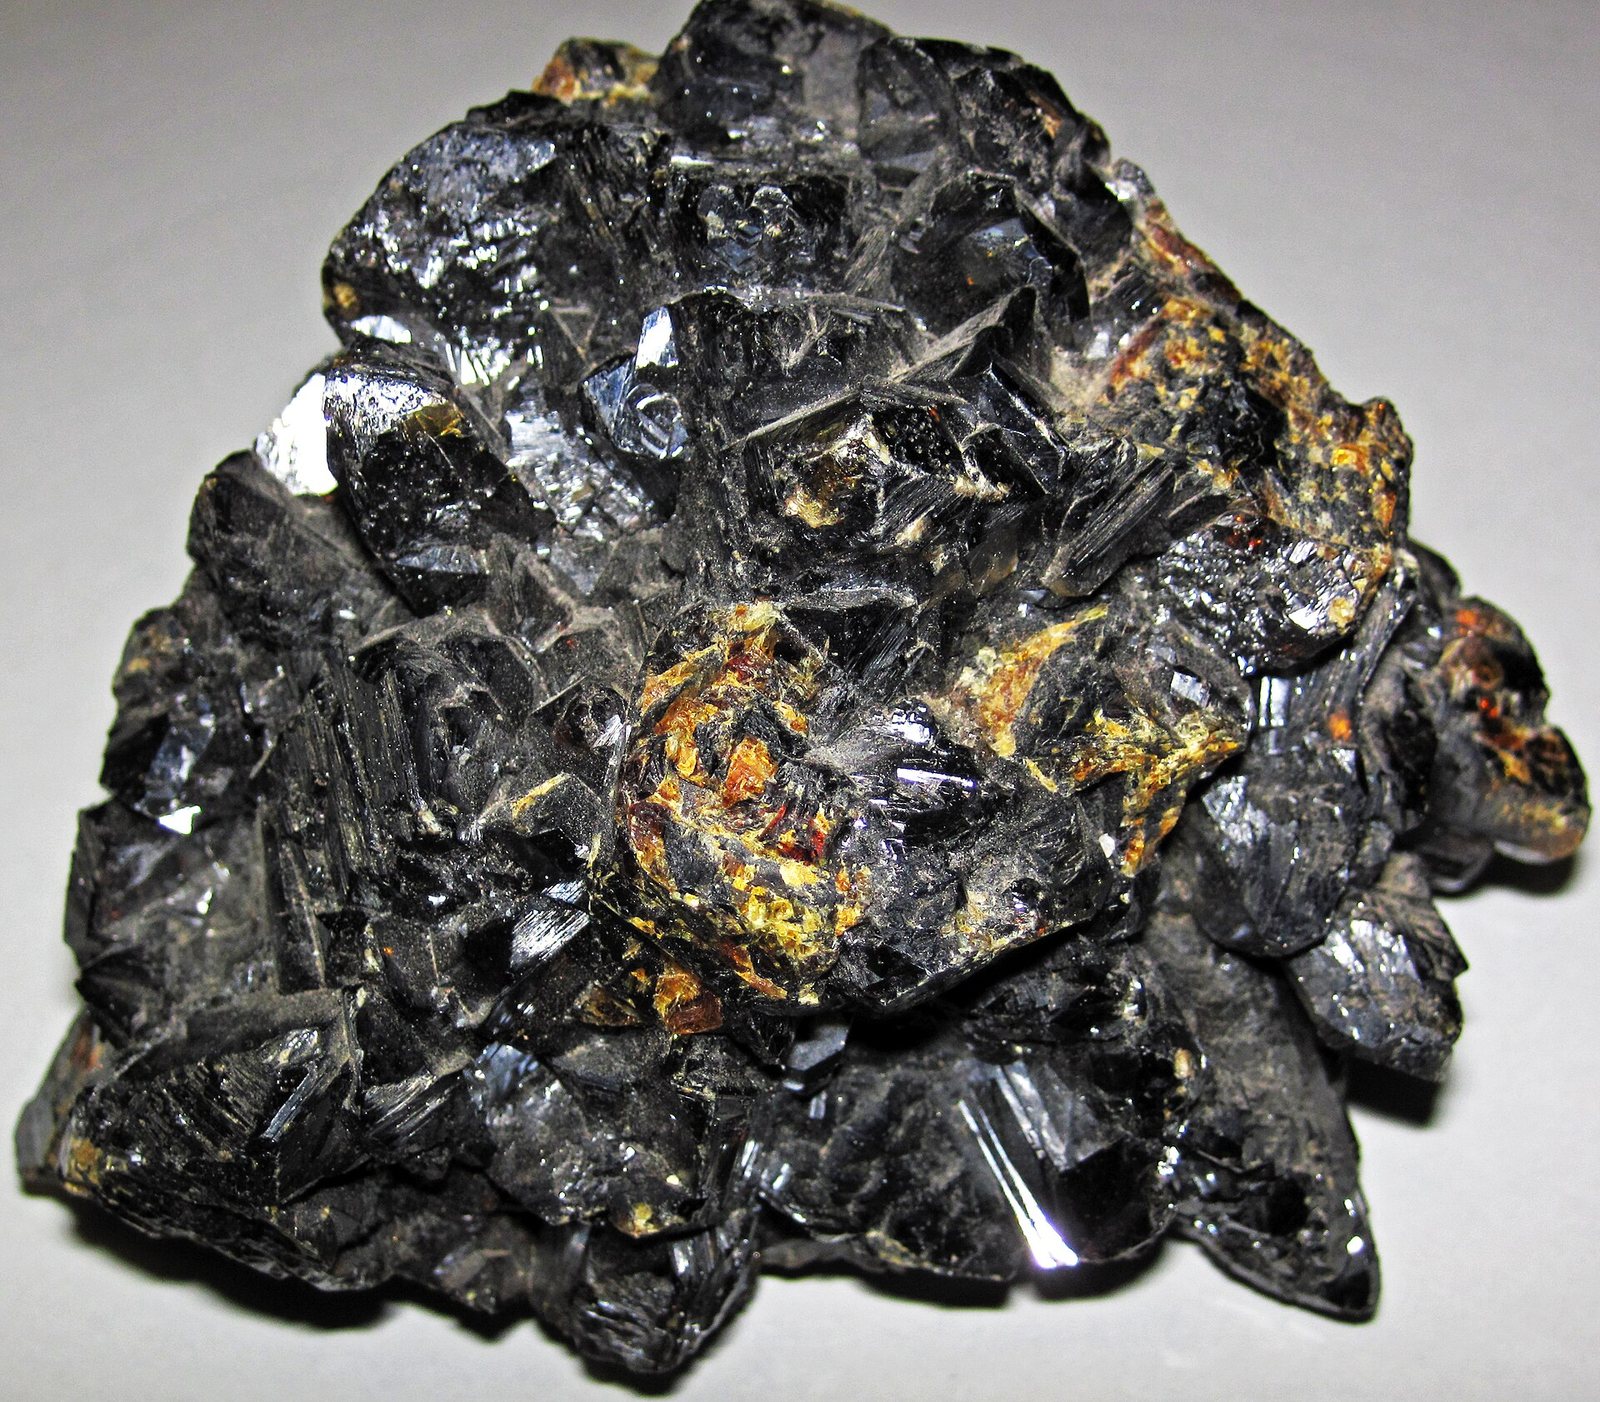
Tüm cevher mineralleri →Bunlar gerçekten taşıyan mineraller cadmium. Bir yatak, ancak içindeki minerallerden biri çıkarma maliyetini karşılayacak kadar yüksek tenörde olduğunda cevher kütlesi sayılır.
Kim üretiyor
Haritada gör →Refinery production
Refinery productionmetric tons 2025 (tahmini) Dünya toplamı 23,000 metric tons
USGS Mineral Commodity Summaries 2026 · Refinery production; entirely a by-product of zinc. · kaynak ↗
Kalan sütunlar için tabloyu yatay kaydırın.
| Ülke | Üretim | Dünya payı |
|---|---|---|
| China | 9,500 | 41.3% |
| Korea, Republic of | 4,300 | 18.7% |
| Japan | 1,300 | 5.7% |
| Canada | 1,300 | 5.7% |
| Kazakhstan | 1,100 | 4.8% |
| Russia | 1,000 | 4.3% |
| Mexico | 1,000 | 4.3% |
| Netherlands | 600.0 | 2.6% |
| Peru | 600.0 | 2.6% |
| Australia | 600.0 | 2.6% |
| Norway | 430.0 | 1.9% |
| Poland | 400.0 | 1.7% |
| Bulgaria | 380.0 | 1.7% |
| Uzbekistan | 230.0 | 1.0% |
| Germany | 220.0 | 1.0% |
| United States | 200.0 | 0.9% |
| Dünya toplamı | 23,000 | 100% |
"Gizli tutulmuş", USGS'nin tek bir şirketin verisini ifşa etmekten kaçınmak amacıyla rakamı yayımlamadığı anlamına gelir; sıfır anlamına gelmez. Kaynak her rakamı bağımsız olarak yuvarladığı ve her zaman "diğer ülkeler" satırını ayrıştırmadığı için ülke satırları her zaman dünya toplamına eşit olmayabilir.
Fiyat
metal, annual average, dollars per kilogram
Yıllık ortalamadollars per kilogram
Dayanak: metal, annual average, dollars per kilogram. Şurada yayımlanan yıllık ortalamalar: USGS Mineral Commodity Summaries 2026 · kaynak ↗. Bunlar referans yıllık ortalamalar olup canlı piyasa fiyatı değildir.
Bir teknolojinin ne kadar ihtiyaç duyduğu
| Teknoloji | Miktar | Kote edilen | Dayanak |
|---|---|---|---|
| Cadmium Telluride Thin-Film Module | 25.00–60.00 kg | per MW of capacity | Semiconductor layer |
Indicative range compiled from published technology studies and chemistry; verify against a manufacturer specification before use. Bu rakamları malzeme hesaplayıcısında istediğiniz ölçekte çalıştırın →