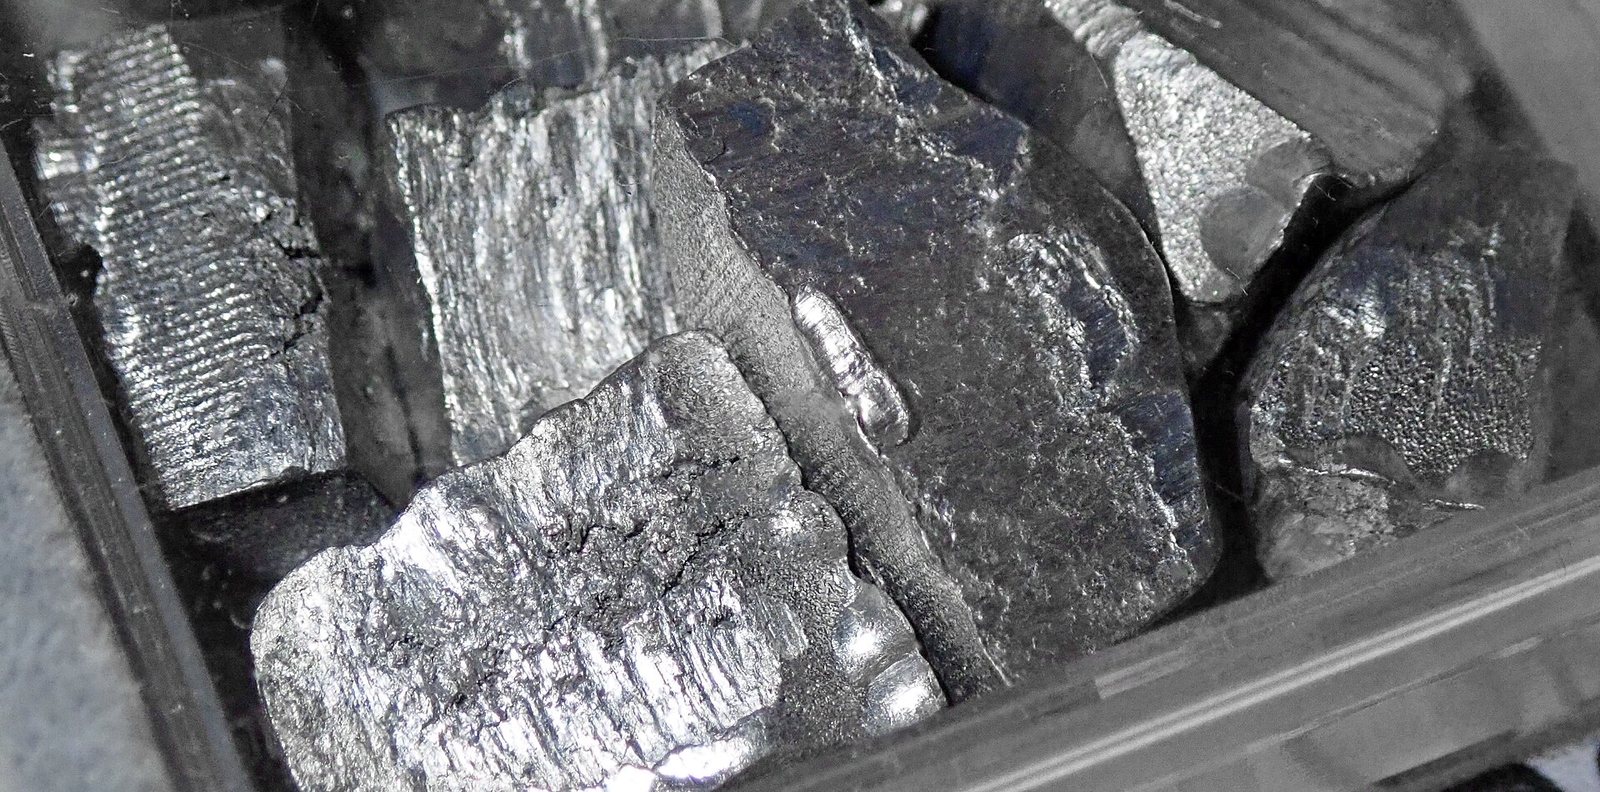
이것은 무엇인가?
A toxic soft metal recovered from zinc refining, now used mainly in thin-film solar panels rather than in the batteries that made it famous.
왜 중요한가?
Cadmium telluride solar shows how a regulated waste product can become an energy technology.
Where it is in the Earth
Cadmium does not form ore deposits of its own. It is a trace element that substitutes chemically for zinc inside the crystal structure of sphalerite, the most abundant zinc sulphide mineral. Because zinc and cadmium sit in the same column of the periodic table, their atoms are similar enough in size and charge that cadmium slots into sphalerite's lattice almost without distortion. The result is that cadmium is dispersed invisibly through zinc ore rather than concentrated into a distinct mineral that could be selectively mined. When geologists sample a zinc deposit they typically report cadmium as a ratio to zinc, because the two elements travel together through every geological process that created the deposit.
The zinc deposits that carry cadmium formed in several ways. Sediment-hosted massive sulphide deposits, where metal-rich hydrothermal fluids circulated through ancient seafloor sediments, are among the most important. So are Mississippi Valley-type deposits, where warm brines migrated through carbonate rocks — limestones and dolostones — and deposited zinc and lead sulphides in cavities and fractures. Skarn deposits, formed where magmatic fluids reacted with carbonate rocks near an igneous intrusion, also carry zinc and therefore cadmium. In each setting the controlling factor is the same: a source of zinc and cadmium in solution, a pathway for those fluids to travel, and a chemical trap where sulphides can precipitate. Cadmium's concentration in the final ore depends on the composition of the original hydrothermal fluid, which varies from deposit to deposit and even from one part of a single deposit to another.
Because cadmium piggybacks entirely on zinc, its geographical distribution mirrors that of the zinc industry rather than reflecting any independent geological logic. Countries with large zinc smelting capacity — China foremost among them — produce the most cadmium, regardless of whether the zinc ore mined locally is particularly cadmium-rich. The geology sets the range of cadmium-to-zinc ratios in the ore; the scale of zinc processing determines how much cadmium actually reaches the market.
Getting it out
No mine in the world operates to extract cadmium. Every tonne of cadmium in commercial use is a by-product, meaning it emerges as an unwanted passenger during the mining and smelting of zinc. The mining method used at any given zinc operation — open pit where ore is shallow and the deposit is large and low-grade, underground where ore sits deep or in narrow veins — is chosen entirely on the basis of the zinc economics. Cadmium has no influence on that decision. From the cadmium perspective, the mine is simply a machine for delivering zinc ore to the surface, and cadmium comes along for the ride.
The grade of a zinc ore is expressed as a percentage of zinc by weight. Cadmium grades are far smaller, and are usually expressed in parts per million or as a cadmium-to-zinc ratio. Because these figures are not in the data provided here, it is enough to say that the cadmium content of any given ore parcel is a small fraction of its zinc content, and that this ratio is not fixed — it varies with the ore type and with where in the deposit the material was extracted. In practical terms this means cadmium supply responds to decisions made about zinc, not to any signal specific to cadmium itself. When a zinc mine ramps up, cadmium supply rises. When a zinc smelter closes for maintenance or is shut permanently, cadmium supply falls, regardless of what is happening in the cadmium market.
There is essentially no waste rock moved specifically to win cadmium, because that concept does not apply to a by-product. The relevant waste figures — strip ratio for open pits, dilution and development rock for underground mines — belong entirely to the zinc accounting. Cadmium inherits whatever environmental footprint the zinc operation carries, which is one reason its life-cycle profile is treated as an allocation problem rather than a straightforward calculation.
What pulls on it
For most of the twentieth century cadmium's principal use was in nickel-cadmium rechargeable batteries, the kind that powered portable tools, emergency lighting and early mobile phones. Those batteries have been displaced in most consumer applications by lithium-ion chemistry, and demand from that sector has declined substantially over time. Regulatory pressure played a direct part: the European Union and other jurisdictions restricted or banned cadmium in batteries for consumer products, which accelerated the shift away from nickel-cadmium technology. Industrial nickel-cadmium batteries, which offer tolerance to rapid charging and discharging in applications like aircraft emergency power and railway signalling, retain a market that is more stable but not growing.
The use that is now expanding is cadmium telluride thin-film solar panels. In this technology a very thin layer of cadmium telluride acts as the semiconductor that converts sunlight to electricity. The panels are manufactured at scale by a small number of producers and have achieved conversion efficiencies that make them commercially competitive with silicon-based panels in utility-scale installations. The cadmium content per unit of generating capacity — somewhere between 25 and 60 kilograms per megawatt — means that growth in solar deployment translates directly into cadmium demand, though the total tonnage consumed is still modest compared to the scale of the zinc industry that produces it as a by-product.
Other uses — cadmium-based pigments, surface coatings on metal parts, stabilisers in plastics — have contracted under environmental regulation and substitution pressure. The net picture is a material whose traditional large market has shrunk, whose regulatory environment remains restrictive, and whose growth now depends almost entirely on the pace of thin-film solar installation. A significant slowdown in that technology, or a shift in solar manufacturing toward other semiconductor materials, would reduce demand with few other markets large enough to absorb the difference.
Turning ore into product 수준 3
Cadmium is separated from zinc during the refining of zinc concentrate, not at the mine. The standard route begins with roasting the zinc sulphide concentrate to produce zinc oxide, then leaching that oxide in sulfuric acid to produce a zinc sulfate solution. Cadmium dissolves alongside zinc in this leach. The two metals are then separated by cementation: zinc dust is added to the solution, and because cadmium is less reactive than zinc, cadmium metal precipitates out of solution as a sponge-like solid while zinc stays in solution. That cadmium sponge is filtered off, re-dissolved, purified further through electrowinning — where an electric current drives cadmium onto cathode plates — and finally melted and cast into sticks or balls for sale. At zinc smelters using the older pyrometallurgical route, cadmium is captured in the gas phase during roasting and recovered through a separate condensation and refining step; the chemistry differs but the outcome is similar.
The losses in cadmium processing occur at several points. Incomplete leaching leaves some cadmium locked in the roaster calcine. Cementation efficiency is never total, and some cadmium remains in the zinc raffinate. Each purification step — washing, re-dissolution, electrowinning — carries a small but real loss. The overall recovery from zinc concentrate to refined cadmium metal varies with the efficiency of the individual plant, the cadmium-to-zinc ratio of the feed, and how carefully the operator manages the intermediate streams. Because cadmium is a regulated hazardous substance in most jurisdictions, operators face strict requirements on how cadmium-bearing residues and effluents are handled, and compliance costs are a genuine part of the processing economics. For downstream users wanting cadmium telluride rather than cadmium metal, the cadmium is combined with tellurium in a separate chemical step, typically at or near the solar panel manufacturing facility rather than at the zinc refinery.
One point that complicates production statistics is that cadmium recovery is not obligatory everywhere. A zinc smelter that lacks the equipment or the economic incentive to capture cadmium may simply allow it to report to slag or flue dust, where it becomes a waste-management problem rather than a saleable product. Published refinery production figures therefore undercount total cadmium mobilised by the zinc industry; the gap between cadmium produced and cadmium discarded is not well characterised in public data.
Substitution and recycling 수준 3
In nickel-cadmium batteries, the principal substitute is lithium-ion chemistry, which offers higher energy density — more energy stored per unit of weight — at costs that have fallen dramatically over the past two decades. Nickel-metal hydride is a further alternative that avoids cadmium entirely. The performance trade-off that keeps nickel-cadmium alive in some industrial settings is its ability to be charged and discharged very rapidly without damage, and its reliability at temperature extremes. Where those properties are not required, substitution is essentially complete and will not reverse. Where they are required — aircraft, railways, standby power — the installed base and the qualification requirements of those industries slow the transition rather than stop it.
In thin-film solar, the semiconductor layer of a cadmium telluride panel could in principle be replaced by other thin-film materials, notably copper indium gallium selenide (CIGS) and amorphous silicon. Each of these has reached commercial production. The competitive position among thin-film technologies depends on efficiency, manufacturing cost and the availability of the constituent materials; cadmium telluride has so far held its ground in utility-scale markets. A further conceptual substitute is crystalline silicon, which dominates the solar market overall, but silicon panels are a different product category rather than a drop-in replacement for the same installation. The cadmium content of a thin-film panel is largely sealed within the glass laminate structure, which reduces direct handling exposure during use but raises questions about end-of-life management that the industry is still working through.
Recycling of cadmium from spent nickel-cadmium batteries exists as an industrial process, particularly in Europe where collection and recycling obligations apply under waste battery regulations. The recovered metal re-enters the supply chain and reduces, at the margin, the call on primary production. The rate of return is constrained by collection logistics — many batteries are not returned through formal channels — and by the economics of processing small, mixed streams of spent cells. Cadmium from end-of-life solar panels is at an earlier stage of the recycling infrastructure, partly because the large cohorts of thin-film panels installed during the growth of that sector have not yet reached end of life in significant quantities.
Where the chain is fragile 수준 4
The central structural feature of cadmium supply is that it cannot respond independently to demand signals. Output is set by zinc smelting capacity and throughput, and zinc smelting decisions are made on zinc economics alone. If zinc demand weakens, cadmium supply falls regardless of conditions in the cadmium market. If zinc demand is strong but cadmium markets are oversupplied, there is no mechanism to reduce cadmium production short of allowing it to report to waste — which some smelters do. This asymmetry means the cadmium market can oscillate between surplus and shortage for reasons entirely external to cadmium end-use, and that the price signal carries limited information about underlying physical scarcity.
Geographic concentration in refining adds a further dimension. China accounts for roughly 9,500 of the 23,000 metric tonnes of world refinery production reported for 2025, and the Republic of Korea adds another 4,300 metric tonnes. Together these two countries represent well over half of global output. Neither produces all of its cadmium from domestically mined zinc; both are major importers of zinc concentrate from elsewhere, which means a disruption to concentrate trade — through shipping, trade policy or other means — could affect refinery output in ways that production statistics alone do not reveal. The Netherlands and Norway appear in the production table despite having no significant zinc mining, precisely because they host zinc smelters fed by imported concentrate.
There are also reporting conventions that complicate the supply picture for researchers. The figures in this dataset represent refinery production of cadmium metal, which is the standard basis used by the United States Geological Survey and most national statistical agencies. That basis excludes cadmium that is mobilised during zinc smelting but not captured as metal — material that goes to slag, flue dust or effluent treatment. It also excludes cadmium recycled within smelter circuits that never becomes separately reported output. The gap between total cadmium mobilised and total cadmium reported as refined metal is not published systematically, and estimates of it vary. Analysts working from refinery production figures should treat them as a lower bound on the cadmium actually handled by the zinc industry, while recognising that the uncaptured fraction is not available to the market. Finally, because cadmium is a hazardous substance subject to national and international regulation — including the Rotterdam Convention on trade in hazardous chemicals — any tightening of regulatory controls on its use or cross-border movement introduces a constraint that sits outside the usual supply-demand framework and can affect particular end-use sectors with little warning.
암석 내 산출 위치
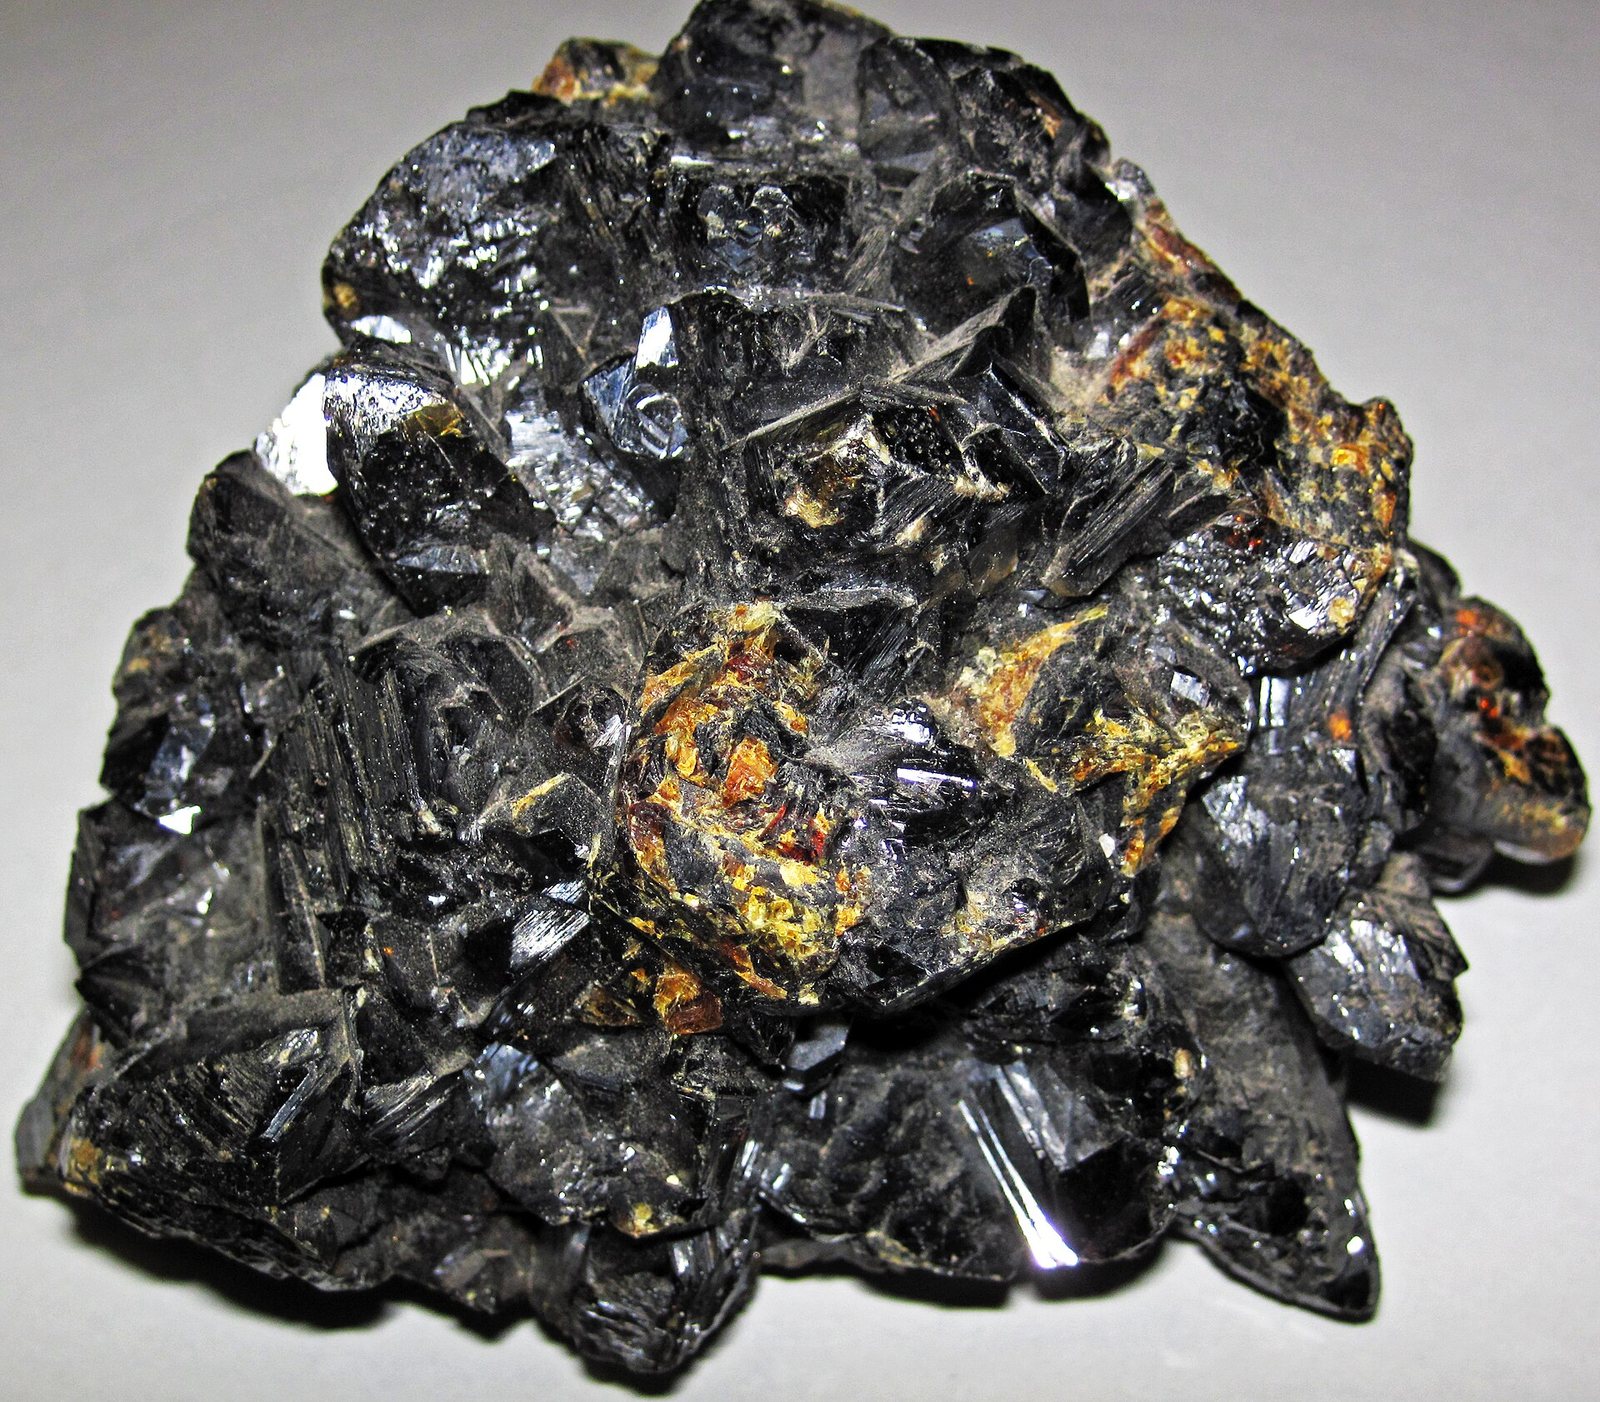
전체 광석 광물 →실제로 이를 함유하는 광물은 다음과 같다: cadmium. 광체(orebody)란 채굴 비용을 충당할 만큼 특정 광물이 충분히 농집된 광상을 말한다.
생산 주체
지도에서 보기 →Refinery production
Refinery productionmetric tons 2025 (추정치) 세계 합계 23,000 metric tons
USGS Mineral Commodity Summaries 2026 · Refinery production; entirely a by-product of zinc. · 출처 ↗
나머지 열을 보려면 표를 옆으로 스크롤하십시오.
| 국가 | 생산 | 세계 비중 |
|---|---|---|
| China | 9,500 | 41.3% |
| Korea, Republic of | 4,300 | 18.7% |
| Japan | 1,300 | 5.7% |
| Canada | 1,300 | 5.7% |
| Kazakhstan | 1,100 | 4.8% |
| Russia | 1,000 | 4.3% |
| Mexico | 1,000 | 4.3% |
| Netherlands | 600.0 | 2.6% |
| Peru | 600.0 | 2.6% |
| Australia | 600.0 | 2.6% |
| Norway | 430.0 | 1.9% |
| Poland | 400.0 | 1.7% |
| Bulgaria | 380.0 | 1.7% |
| Uzbekistan | 230.0 | 1.0% |
| Germany | 220.0 | 1.0% |
| United States | 200.0 | 0.9% |
| 세계 합계 | 23,000 | 100% |
'비공개'는 USGS가 개별 기업의 데이터 노출을 막기 위해 수치를 억제한 것으로, 0을 의미하지 않습니다. 출처가 각 수치를 독립적으로 반올림하고 '기타 국가' 항목을 항상 별도로 구분하지는 않기 때문에, 국가별 합계가 세계 합계와 일치하지 않을 수 있습니다.
가격
metal, annual average, dollars per kilogram
연간 평균dollars per kilogram
기준: metal, annual average, dollars per kilogram. 다음 자료에 게재된 연간 평균 USGS Mineral Commodity Summaries 2026 · 출처 ↗. 이 수치는 기준 연간 평균값이며, 실시간 시장 가격이 아니다.
기술별 소요량
| 기술 | 수량 | 고시 가격 | 기준 |
|---|---|---|---|
| Cadmium Telluride Thin-Film Module | 25.00–60.00 kg | per MW of capacity | Semiconductor layer |
Indicative range compiled from published technology studies and chemistry; verify against a manufacturer specification before use. 재료 계산기에서 임의의 규모로 이 수치를 계산하십시오. →