Rock to product, traced
Commodity Education
★
Commodity Education
Materials Mines & deposits Processing & refining Custody journeys Supply chains Companies Countries News
Materials by shelf Battery Materials Rare Earth Elements Copper & Electrical Semiconductor Materials Nuclear Materials Aerospace & Defence Precious Metals Steel & Alloy Metals Industrial Minerals Agricultural Minerals Energy Raw Materials Ore minerals Periodic table
Demand End markets Technologies Material calculator Maps Screener
Learn & tools LearnGlossary Courses Identify the Commodity Ask the DataAI agents Research & dataAPI ★ Saved
About About usMethodology Data sourcesContact Disclaimer
Reading options
Guided View New to ore grades, concentrate, refining and by-products? We explain every term as you browse, in plain English. Same data, with the help built in.
Expert View You already know the industry. Just the data: clean, fast and compact, with no extra explanations. This is the default view.
Theme
Interface language
Depth Material pages are written at four levels. Pick one on any material page and it is remembered.
★ Saved Research & data
Crushed Stone

Industrial Minerals

Crushed Stone

Rock blasted and broken to size — limestone, granite, trap rock — and, with sand, the largest tonnage humans move.

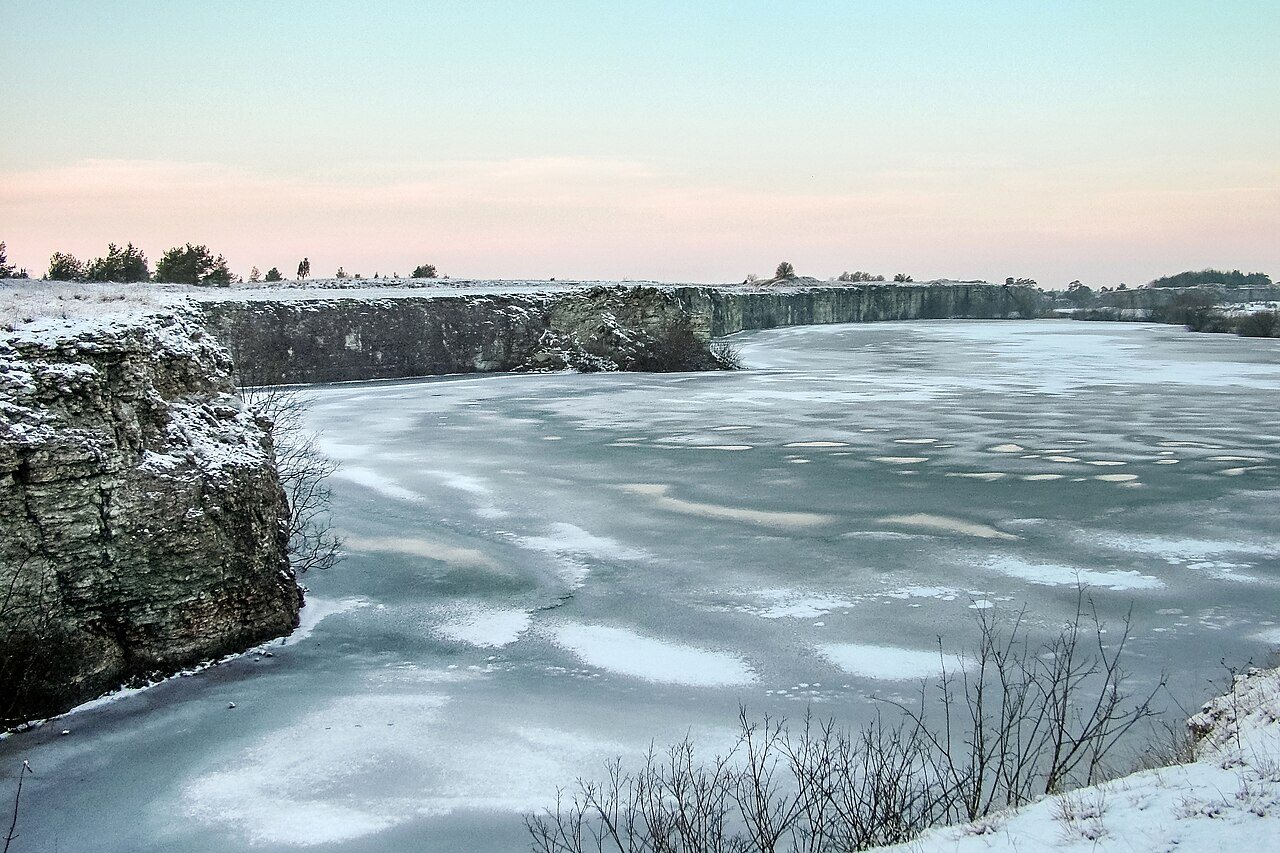
Abandoned limestone quarry on Furilden Gotland 1 · W.carter / Ann-Sophie Qvarnström · CC BY-SA 2.0 · Wikimedia Commons

What is it?

Rock blasted and broken to size — limestone, granite, trap rock — and, with sand, the largest tonnage humans move.

Why does it matter?

Every road base, railway ballast and concrete mix is mostly this. It is low-value per tonne, so it is quarried close to where it is used and its economics are entirely about haulage distance.

Deeper written sections for this material have not been published yet. Everything below is drawn straight from the source datasets and is complete.

Read the numbers correctly. US figures only in the MCS; a world total is not compiled. Graded aggregate by nominal size and rock type.

Who produces it

See it on a map →

Mine production

Mine productionmillion metric tons 2025 (estimated)

USGS Mineral Commodity Summaries 2026 · US figures only in the MCS; a world total is not compiled. · source ↗

Scroll the table sideways for the remaining columns.

CountryProduction Share of world
United States 1,500 —
Other countries Not applicable —
World total Not applicable100%

“Withheld” means the USGS suppressed the figure to avoid disclosing an individual company's data — it does not mean zero. Country rows do not always sum to the world total because the source rounds each figure independently and does not always break out an “other countries” line.

Price

average unit value, dollars per metric ton

Annual averagedollars per metric ton

2021 · 13.26 high 18.50 dollars per metric ton 2025 · 18.50

Basis: average unit value, dollars per metric ton. Annual averages as published in USGS Mineral Commodity Summaries 2026 · source ↗. These are reference annual averages, not a live market quote.

Materials

All materials Critical minerals Rare earths Battery materials Ore minerals Periodic table Screener

The ground

Mines & deposits Processing & refining Countries Maps

The economy

Custody journeys Supply chains End markets Technologies Companies Material calculator

Learn

LearnGlossary Ask the DataAI agents Research & dataOpen API News★ Saved

About us

About usContact MethodologyData sources Editorial policy Privacy policyTerms of use Disclaimer