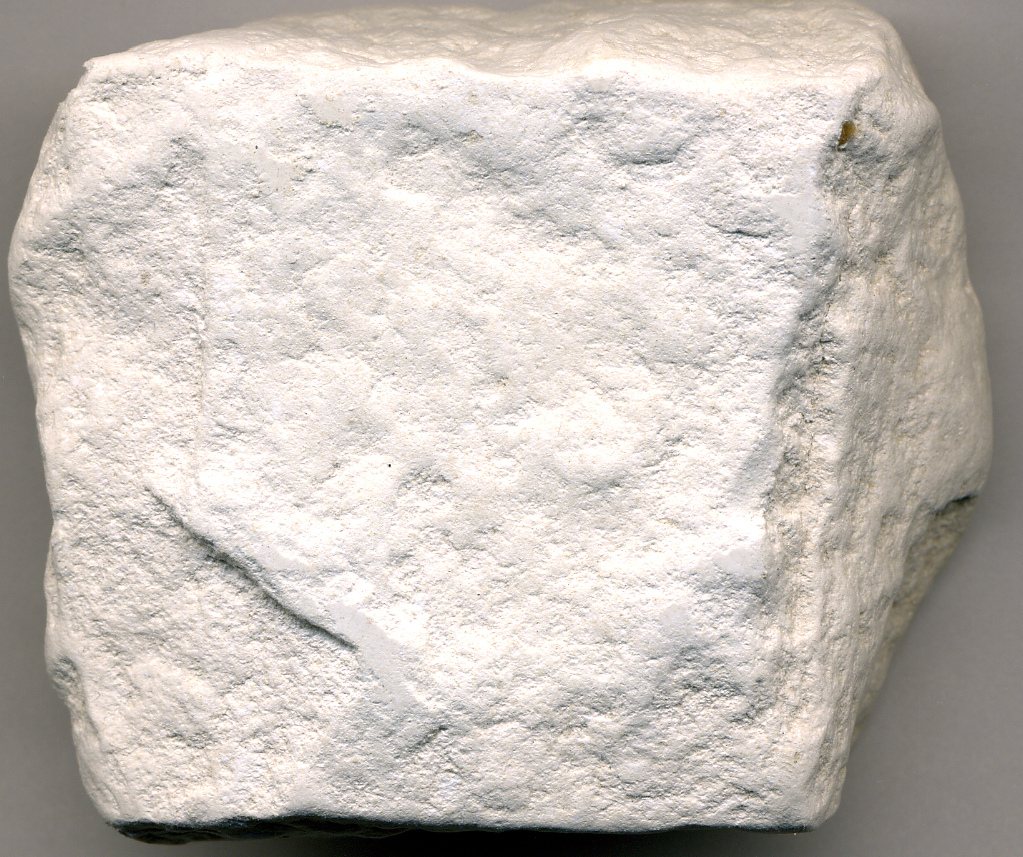
这是什么?
Rock made from the glass skeletons of microscopic algae, so porous that a lump of it floats on water.
为何重要?
It is the standard filter medium for beer, wine, sugar and swimming pools, and a mild abrasive and absorbent.
该材料的深度文字内容尚未发布。以下所有内容均直接提取自原始数据集,内容完整。
生产主体
在地图上查看 →Mine production
Mine productionthousand metric tons 2025 (估计值) 全球合计 2,500 thousand metric tons
USGS Mineral Commodity Summaries 2026 · Gross weight of processed diatomite. · 来源 ↗
横向滚动表格以查看其余列。
| 国家/地区 | 产量 | 占全球份额 |
|---|---|---|
| United States | 720.0 | 28.8% |
| France | 250.0 | 10.0% |
| Argentina | 190.0 | 7.6% |
| Other countries | 160.0 | 6.4% |
| Turkey | 150.0 | 6.0% |
| China | 140.0 | 5.6% |
| Korea, Republic of | 120.0 | 4.8% |
| Mexico | 100.0 | 4.0% |
| Peru | 99.00 | 4.0% |
| Germany | 50.00 | 2.0% |
| Spain | 50.00 | 2.0% |
| Russia | 50.00 | 2.0% |
| Japan | 40.00 | 1.6% |
| New Zealand | 40.00 | 1.6% |
| 全球合计 | 2,500 | 100% |
Mine production: processed
Mine production: processedthousand metric tons 2025 (估计值)
USGS Mineral Commodity Summaries 2026 · Gross weight of processed diatomite. · 来源 ↗
横向滚动表格以查看其余列。
| 国家/地区 | 产量 | 占全球份额 |
|---|---|---|
| Denmark | 380.0 | — |
"未披露"表示美国地质调查局(USGS)为避免泄露单个企业数据而对该数字进行了保密处理——并不意味着数值为零。各国行数之和不一定等于世界合计,原因在于来源对每个数字单独进行四舍五入处理,且并不总是单独列出"其他国家/地区"一行。
储量持有方
Reserves
Reservesthousand metric tons 2025
USGS Mineral Commodity Summaries 2026 · 来源 ↗
| 国家/地区 | 储量 | 占全球份额 |
|---|---|---|
| United States | 250,000 | — |
| China | 120,000 | — |
| Spain | 57,000 | — |
| Turkey | 44,000 | — |
| Korea, Republic of | 2,200 | — |
| New Zealand | Not applicable | — |
| Peru | Not applicable | — |
| Russia | Not applicable | — |
| Mexico | Not applicable | — |
| Argentina | Not applicable | — |
| France | Not applicable | — |
| Germany | Not applicable | — |
| Japan | Not applicable | — |
| Other countries | Not applicable | — |
| 全球合计 | Large | 100% |
Reserves: processed
Reserves: processedthousand metric tons 2025
USGS Mineral Commodity Summaries 2026 · 来源 ↗
| 国家/地区 | 储量 | 占全球份额 |
|---|---|---|
| Denmark | Not applicable | — |
价格
average value, f.o.b. plant, dollars per metric ton
年度平均值dollars per metric ton
基准: average value, f.o.b. plant, dollars per metric ton. 年度平均值,来源: USGS Mineral Commodity Summaries 2026 · 来源 ↗. 以下为参考年度均价,非实时市场报价。