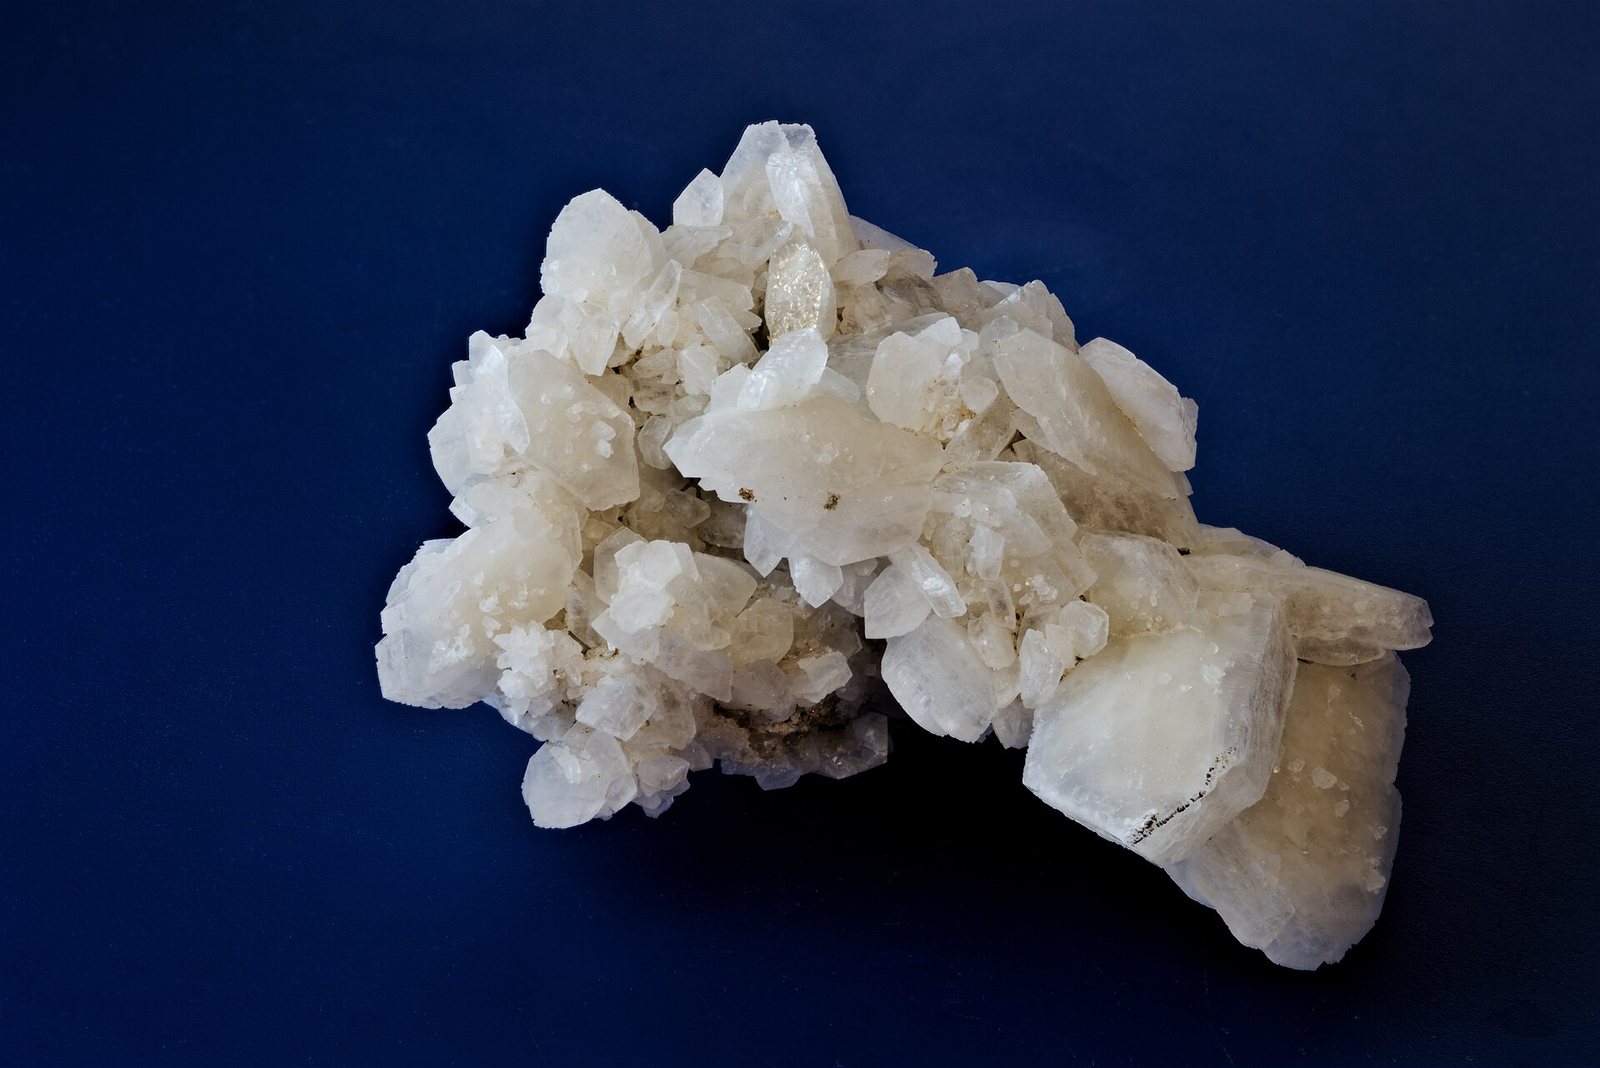
这是什么?
A soft white rock that becomes plasterboard — the interior surface of most buildings in the developed world.
为何重要?
A large share of gypsum supply is synthetic, captured from coal-plant flue gas. Closing coal plants removes that supply.
Where it is in the Earth
Gypsum is calcium sulfate dihydrate — a calcium sulfate molecule with two water molecules chemically bound into its crystal structure. It forms almost exclusively in evaporite sequences: ancient shallow seas or landlocked basins that dried out slowly, concentrating dissolved salts until minerals began to crystallise out of the brine. Gypsum is typically one of the first minerals to precipitate in this sequence, appearing before halite (common salt) because it becomes insoluble at lower concentrations. The result is thick, laterally extensive beds of white or grey rock interlayered with limestone, shale and anhydrite — anhydrite being the anhydrous form of calcium sulfate, which forms when gypsum loses its bound water under heat or pressure.
Because evaporite basins accumulated during many different geological periods, gypsum deposits are found on every continent. The large reserves in China, Thailand, Iran and North America reflect ancient seaways that covered those regions hundreds of millions of years ago. In some areas, such as parts of Spain and the American Southwest, the beds sit close to the surface and were exposed by later erosion, making them straightforward to mine. In others the rock lies beneath younger sediments, requiring deeper workings. Importantly, gypsum is also produced chemically at industrial scale as a by-product of scrubbing sulfur dioxide from coal-fired power station flue gas — a process called flue-gas desulfurisation, or FGD. This synthetic gypsum is chemically equivalent to the mined mineral and now accounts for a substantial share of total supply in countries with large coal fleets and environmental controls, particularly Germany, Japan and the United States.
Getting it out
The great majority of natural gypsum is extracted by open-pit quarrying. The rock is soft enough — it scores just 2 on the Mohs hardness scale, meaning a fingernail can scratch it — that drilling and blasting are often sufficient, and in some deposits mechanical rippers attached to bulldozers can break the rock without explosives at all. The soft, massive beds also mean that waste-to-ore ratios are generally modest compared with hard-rock metallic mining; overburden (the rock and soil that must be removed to reach the deposit) is stripped and stockpiled, but the gypsum beds themselves are thick and relatively pure, so a high proportion of what is dug becomes saleable product.
Underground mining is used where deposits sit beneath towns, sensitive land or other minerals that must be preserved, or where the depth makes surface working uneconomical. Room-and-pillar methods are common: miners extract rectangular panels of rock and leave regular pillars standing to support the roof, producing a grid-like void. Because gypsum is weak, pillar design is important, and mine layouts tend to be conservative. A small quantity of gypsum is also recovered as a by-product of phosphoric acid production, where sulfuric acid reacts with phosphate rock and generates a calcium sulfate residue called phosphogypsum. Most phosphogypsum contains low levels of naturally occurring radioactive materials and is stockpiled rather than used, though some countries do use it in agriculture and construction.
Grade, in the context of gypsum, is expressed as purity — the percentage of calcium sulfate dihydrate in the run-of-mine rock. High-purity deposits are preferred for plasterboard manufacture, where consistency matters. Rock that is intimately mixed with limestone or clay requires more processing to reach specification and may command a lower price or be relegated to agricultural uses where purity requirements are looser.
What pulls on it
Gypsum's dominant end use is the manufacture of plasterboard — the flat panels of set gypsum sandwiched between paper sheets that line the interior walls and ceilings of most buildings in the developed world. Demand therefore tracks construction activity very closely, with residential building particularly important because new homes are fitted out with plasterboard at a consistent rate per square metre of floor area. When housing construction slows, gypsum demand falls; when it recovers, demand recovers with it. This makes gypsum one of the more cyclically sensitive industrial minerals, even though the underlying geology suggests essentially unlimited long-run supply.
Beyond plasterboard, gypsum has a secondary role as a soil amendment in agriculture: it supplies calcium and sulfur to crops without significantly altering soil pH, and it is used to break up heavy clay soils. Cement production uses a small quantity of gypsum as a set retarder — added at the grinding stage, it controls how quickly concrete hardens. These applications are smaller but more stable than construction demand, and they absorb some gypsum that is too impure or too finely ground for wallboard specification.
The structural shift worth understanding is the relationship between FGD gypsum supply and coal-fired power generation. In countries where coal plants are being retired for reasons of climate policy or economics, the flow of synthetic gypsum diminishes. Wallboard manufacturers that built their supply chains around cheap, locally produced FGD material must then either source natural gypsum — often from greater distances — or import wallboard itself. This is not a demand change but a supply displacement that has real consequences for regional market balance. Equally, in countries that are still building coal capacity with sulfur controls, FGD gypsum supply is growing, and that growth can displace natural quarrying.
生产主体
在地图上查看 →Mine production
Mine productionthousand metric tons 2025 (估计值) 全球合计 160,000 thousand metric tons
USGS Mineral Commodity Summaries 2026 · Crude gypsum, gross weight. · 来源 ↗
横向滚动表格以查看其余列。
| 国家/地区 | 产量 | 占全球份额 |
|---|---|---|
| United States | 20,000 | 12.5% |
| Other countries | 20,000 | 12.5% |
| Iran | 16,000 | 10.0% |
| Oman | 14,000 | 8.8% |
| China | 12,000 | 7.5% |
| Spain | 11,000 | 6.9% |
| Turkey | 10,000 | 6.2% |
| Thailand | 8,700 | 5.4% |
| Brazil | 5,800 | 3.6% |
| Mexico | 5,400 | 3.4% |
| Germany | 4,700 | 2.9% |
| Japan | 4,300 | 2.7% |
| India | 4,300 | 2.7% |
| Russia | 4,300 | 2.7% |
| Australia | 4,200 | 2.6% |
| Saudi Arabia | 3,800 | 2.4% |
| Canada | 3,600 | 2.2% |
| Algeria | 2,500 | 1.6% |
| Uzbekistan | 2,500 | 1.6% |
| France | 2,400 | 1.5% |
| 全球合计 | 160,000 | 100% |
"未披露"表示美国地质调查局(USGS)为避免泄露单个企业数据而对该数字进行了保密处理——并不意味着数值为零。各国行数之和不一定等于世界合计,原因在于来源对每个数字单独进行四舍五入处理,且并不总是单独列出"其他国家/地区"一行。
储量持有方
Reserves
Reservesthousand metric tons 2025
USGS Mineral Commodity Summaries 2026 · 来源 ↗
| 国家/地区 | 储量 | 占全球份额 |
|---|---|---|
| China | 1,800,000 | — |
| Thailand | 910,000 | — |
| Iran | 750,000 | — |
| United States | 700,000 | — |
| Canada | 450,000 | — |
| Brazil | 450,000 | — |
| France | 300,000 | — |
| Turkey | 200,000 | — |
| India | 37,000 | — |
| Uzbekistan | Not applicable | — |
| Other countries | Not applicable | — |
| Japan | Not applicable | — |
| Algeria | Not applicable | — |
| Australia | Not applicable | — |
| Germany | Not applicable | — |
| Mexico | Not applicable | — |
| Oman | Not applicable | — |
| Russia | Not applicable | — |
| Saudi Arabia | Not applicable | — |
| Spain | Not applicable | — |
| 全球合计 | Large | 100% |
价格
annual average, dollars per metric ton: Crude, free on board (f.o.b.) mine
年度平均值dollars per metric ton
基准: annual average, dollars per metric ton: Crude, free on board (f.o.b.) mine. 年度平均值,来源: USGS Mineral Commodity Summaries 2026 · 来源 ↗. 以下为参考年度均价,非实时市场报价。
annual average, dollars per metric ton: Calcined, f.o.b. plant
年度平均值dollars per metric ton
基准: annual average, dollars per metric ton: Calcined, f.o.b. plant. 年度平均值,来源: USGS Mineral Commodity Summaries 2026 · 来源 ↗. 以下为参考年度均价,非实时市场报价。
其用途
所有终端市场 →| 终端市场 | 其在彼处的用途 | 重要性 |
|---|---|---|
| Construction & Steel | Plasterboard | 重要 |
出口管制
| 国家/地区 | 管控 | 适用于 |
|---|---|---|
| Angola | Export ban | Quartz and gypsum (2024). ↗ |
USGS Mineral Commodity Summaries 2026, table 4 — controls in effect as of January 2026, excluding controls since lifted.