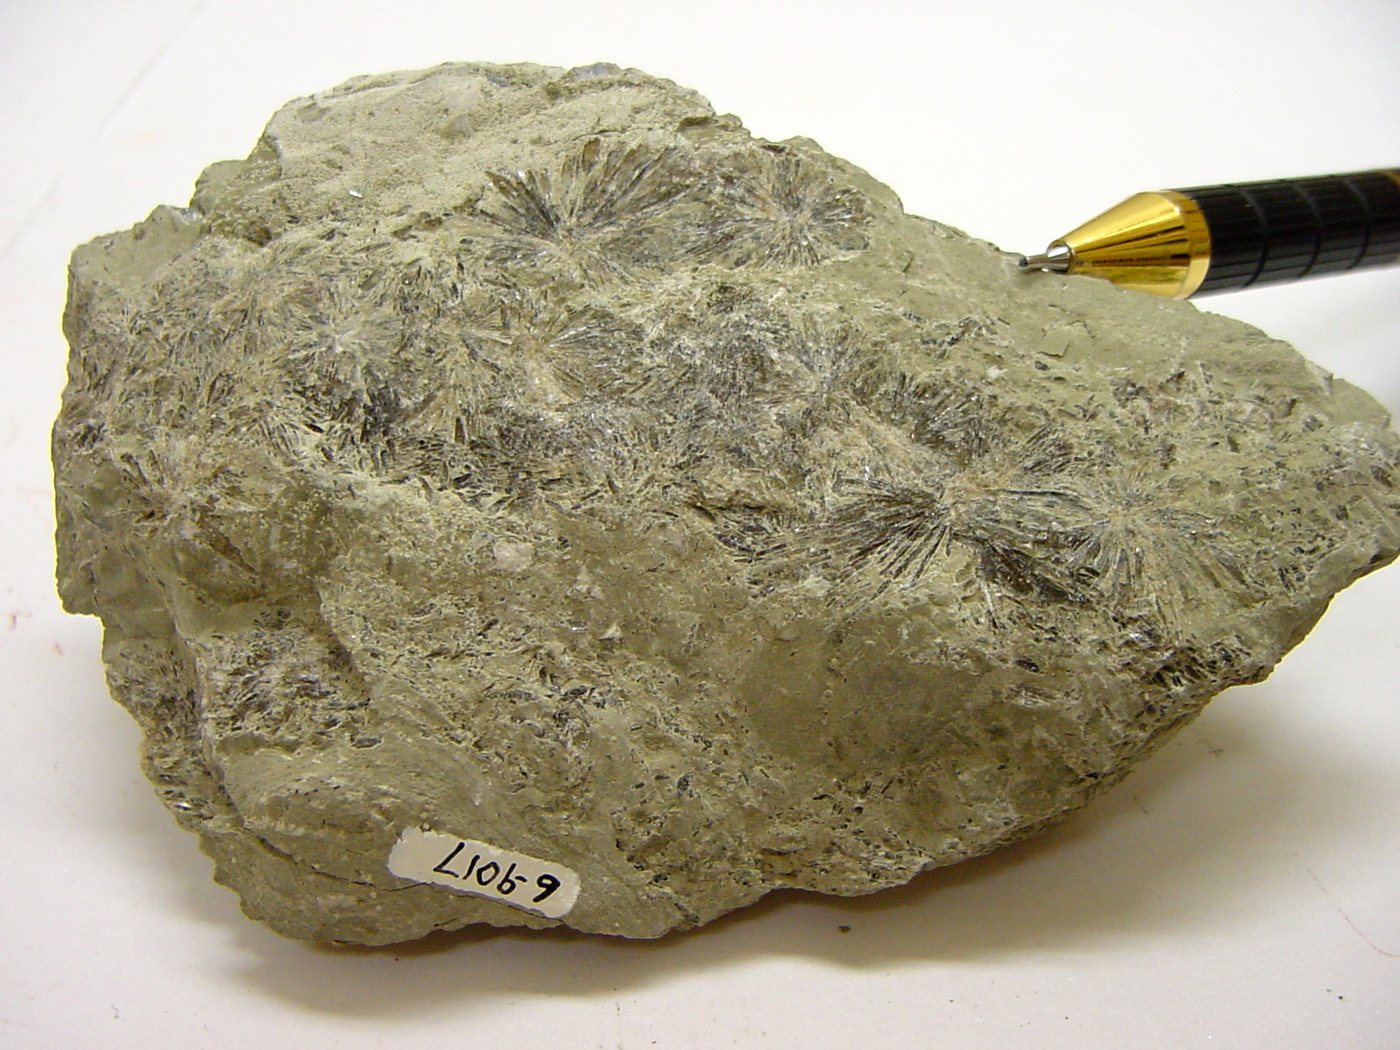
Was ist das?
Sodium carbonate, mined from trona rock or made from salt, and the second ingredient in almost every sheet of glass.
Warum ist das wichtig?
Solar-panel glass, container glass and flat glass all pull on the same soda-ash supply.
Where it is in the Earth
Soda ash is sodium carbonate, and its geological story begins with water — specifically, ancient lakes that had no outlet to the sea. In a closed basin, water flows in carrying dissolved minerals leached from surrounding rocks, but it cannot flow out. Over thousands to millions of years, evaporation concentrates whatever the water holds. Where the catchment rocks were rich in sodium and carbonate, the lake brine eventually reached the point at which solid minerals began to crystallise on the lake floor. The most important of these minerals is trona, a hydrated sodium carbonate bicarbonate, which forms thick, laterally extensive beds interbedded with other evaporite minerals and mudstones. The process is directly analogous to the formation of halite (rock salt) beds, but it requires a particular chemistry in both the source rocks and the brine.
The result is that commercially significant trona deposits are geographically rare. The United States holds by far the largest known reserves, concentrated in the Green River Basin of Wyoming, where a chain of Eocene-age lakes — perhaps 50 million years old — left behind a sequence of trona beds lying beneath the surface. Turkey holds the second-largest reserves, at the Beypazari deposit near Ankara, which formed under broadly similar lacustrine conditions. East African examples in Kenya, Ethiopia and Botswana represent younger, and in some cases still-active, soda lakes in the Rift Valley system, where the same process of closed-basin evaporation continues today at shallower depths. Outside these settings, sodium carbonate does not naturally concentrate to mineable grades; everywhere else, soda ash must be manufactured synthetically from salt and limestone.
The synthetic route — the Solvay process, developed in the nineteenth century — dominates production in China and much of Europe and Asia, where natural trona deposits do not exist. The world production figures in the table reflect this split: of total global output, a substantial portion comes from the synthetic route, with the remainder from natural trona mining. Understanding which category a country falls into matters for cost structure, energy intensity and carbon footprint, since the Solvay process is considerably more energy-intensive than simply mining and calcining trona.
Getting it out
Where trona beds lie close enough to the surface, open-pit mining is possible, as at some of the East African soda-lake operations where mineralised brines or shallow crusts are worked directly. In Wyoming, however, the principal trona seams sit several hundred metres underground, which makes conventional room-and-pillar underground mining the standard method. In this technique, miners drive a network of rectangular tunnels through the ore seam, leaving behind rectangular columns — the pillars — to hold up the roof. The pillars represent ore that cannot be recovered, so the extraction ratio (the proportion of ore actually removed) is determined by the trade-off between recovery and ground stability. The beds at Green River are thick enough and consistent enough in grade that this method is highly productive.
A third approach, solution mining, is also used in Wyoming. Hot water is pumped underground through injection wells, dissolves the trona in place, and the resulting brine is pumped back to surface for processing. This avoids the cost and hazard of underground mining entirely and can access seams too deep or too thin for conventional methods. The trade-off is that not all of the trona dissolves cleanly, and the brine brought to surface carries impurities that require additional processing steps. In the East African Rift lakes, a simpler version of this logic applies: at Lake Natron in Tanzania and Lake Magadi in Kenya, trona and related minerals are harvested directly from the lake surface or shallow waters, a form of extraction that has more in common with salt harvesting than with hard-rock mining.
Because trona is a relatively soft, water-soluble evaporite mineral rather than a hard silicate rock, the waste rock ratios typical of metal mines do not apply in the same way. The challenge is less about separating ore from barren rock and more about removing water, impurities and associated minerals such as halite or nahcolite from a relatively pure sodium carbonate source. Grade in this context means the sodium carbonate equivalent content of the raw trona, and the conversion from trona to soda ash involves driving off water and carbon dioxide by heating — a step called calcination — rather than any chemical separation of the carbonate from a surrounding silicate matrix.
What pulls on it
Glass is the dominant use of soda ash, and this covers a wide range of products: container glass for food and beverages, flat glass for buildings and vehicles, and the borosilicate and speciality glasses used in cookware, laboratory equipment and display screens. In each case, sodium carbonate acts as a flux — it lowers the temperature at which silica sand melts, reducing the energy required to produce molten glass. Without soda ash, the melting points involved would make glass production far more expensive and energy-intensive than it already is. This flux function is not easily replicated by other cheap materials, which is why glass has consumed soda ash in large quantities for centuries and continues to do so.
The energy-transition connection runs through solar glass. Photovoltaic modules — both the crystalline silicon type and cadmium telluride thin-film panels — require high-quality flat glass for their cover layers or substrates. The intensity figures in the table show that each megawatt of installed solar capacity requires a significant quantity of soda ash, which means that rapid growth in solar manufacturing translates directly into additional soda ash demand. Container glass demand tends to track consumer goods production and, over longer timescales, population and income growth. Flat glass for construction follows building activity. Detergents and cleaning products represent another significant end use, since sodium carbonate is an effective water softener and alkali in its own right.
For demand to change sharply downward, glass would need to be displaced at scale by alternative packaging or glazing materials — plastics in containers, organic films in solar panels — or the solar build-out would need to slow substantially. For a sharp increase, the scenario is simpler: continued acceleration of solar panel manufacturing would pull hard on soda ash supply, and there is no obvious short-term substitute for glass in that application. The growth in solar deployment in recent years has already made the energy-transition end use a more prominent part of the demand picture than it was a decade ago.
Turning ore into product Ebene 3
Raw trona, whether mined as solid rock or recovered as brine, must be converted into anhydrous sodium carbonate before it is useful to industry. For mined trona, the first step is crushing and screening to reduce lump ore to a workable particle size. The crushed ore then goes to a calciner — a rotary kiln or similar furnace — where heat drives off water and converts the bicarbonate component, releasing carbon dioxide in the process. The product emerging from the calciner is a crude sodium carbonate that still contains impurities picked up from the ore: halite (sodium chloride), insoluble silicates and organic material from the ancient lake sediments. These are removed by dissolving the calcined material in water, clarifying the resulting liquor to settle out insolubles, and then recrystallising the sodium carbonate under controlled conditions. The crystals are filtered, washed and dried to yield either light soda ash (a low-density, fine-grained product) or dense soda ash (a higher-density, granular product produced by a further compaction step). The choice between light and dense product is driven by the end user's handling preferences; chemically, they are equivalent.
For solution-mined brine, the front end of this flowsheet — crushing and calcination — is replaced by evaporation and crystallisation, since the sodium carbonate is already in solution. This simplifies the process but introduces greater sensitivity to the composition of the brine, particularly to the ratio of carbonate to bicarbonate and to chloride content. The energy cost in both routes is dominated by the heat required for calcination or evaporation. In the Solvay process used in synthetic production, the chemistry is entirely different: ammonia is used to precipitate sodium bicarbonate from brine, which is then calcined to sodium carbonate and the ammonia recovered in a closed loop. The Solvay route produces soda ash of very consistent purity but at higher energy cost and with a co-product stream of calcium chloride that has limited market value. This cost disadvantage relative to natural trona is one reason US producers have historically been competitive in export markets despite the distance to major customers.
Recovery losses occur at several points: in the underground or solution-mining extraction itself, in the clarification step where fine insolubles carry some sodium carbonate to the waste stream, and in the recrystallisation where mother liquor is recycled but never perfectly. Published production figures are stated on a gross-weight basis of the final anhydrous product, which means that the water and carbon dioxide lost during calcination are not counted — a tonne of raw trona yields rather less than a tonne of soda ash, a conversion factor that matters when estimating the resource life of a deposit against stated reserve figures.
Substitution and recycling Ebene 3
In glass-making, soda ash can in principle be partially replaced by recycled glass cullet (broken or waste glass returned to the furnace). Cullet melts at a lower temperature than the raw batch of sand, soda ash and limestone, so using more cullet reduces energy consumption and reduces the quantity of soda ash required per tonne of glass produced. Container glass in many markets already uses substantial quantities of cullet, limited primarily by collection infrastructure and colour-sorting logistics rather than by any technical barrier. Flat glass is harder to recycle at scale because it is more dispersed at end of life and is often laminated or coated in ways that complicate remelting. Solar panel glass recycling infrastructure is almost entirely absent at present, though the volume of panels approaching end of life is growing and the question of what to do with it is receiving increasing attention in policy and industry circles.
Direct chemical substitutes for soda ash in its various roles are limited. In detergents, caustic soda (sodium hydroxide) can perform some of the same functions but is more expensive and more hazardous to handle. In certain chemical processes, potassium carbonate can substitute but is a distinct and more costly material. For glass-making specifically, there is no cheap, abundant alternative flux that replicates what sodium carbonate does at the melting temperatures and production volumes involved. This means that substitution pressure on soda ash is real but gradual, operating mainly through cullet recycling rather than through replacement by a different substance. The ceiling on cullet use is set by collection rates, which in most markets leave a substantial fraction of glass unavailable for recycling — post-consumer glass lost to landfill, contamination or breakage represents soda ash demand that could theoretically be displaced but currently is not.
Where the chain is fragile Ebene 4
The reserve picture for soda ash is, on its face, reassuring: the United States alone holds reserves that dwarf current annual production by several orders of magnitude, and total world reserves are stated in the data at 25 billion tonnes against world production of 71 million tonnes. These figures suggest a resource base that is not physically scarce on any foreseeable timescale. The fragility in the chain does not lie in geological scarcity but in geographic and structural concentration. The United States accounts for the overwhelming majority of global natural trona reserves, and Turkey is a distant second. This means that the natural-trona segment of the industry is highly concentrated geographically, even if synthetic capacity — spread across China and other Solvay-process producers — provides a degree of global redundancy.
The more immediate source of tension is the relationship between the two production routes. Synthetic Solvay-process capacity, which is predominant in China, is considerably more energy-intensive and has a higher carbon footprint per tonne of soda ash produced. As energy prices move and as carbon pricing mechanisms expand in various jurisdictions, the cost relationship between natural and synthetic soda ash shifts. The data show that the average unit value of US natural soda ash moved substantially between 2021 and 2023 before declining in 2024 and 2025 — a pattern consistent with a tight market followed by easing, though the underlying drivers of that movement require knowing about energy markets, Chinese production policy and shipping costs that lie outside a simple price series. Analysts and buyers working from price series alone should be cautious about inferring structural shifts from what may be cyclical movement.
A subtler reporting issue is the unit basis. The world production figures in the data combine natural and synthetic output on a gross-weight basis of anhydrous sodium carbonate, which is the correct common denominator but obscures important differences in process economics, energy intensity and carbon accounting. Published figures from different national statistical agencies and industry associations do not always agree on the synthetic/natural split, partly because some countries report production at different points in the processing chain and partly because Chinese production data, which represents a large share of the synthetic total, are subject to revision and methodological differences from Western surveys. Where a data source shows values as withheld or not available — as is the case for several entries in the reserves table — it is not safe to treat the absence of a number as evidence that the quantity is small; it may simply reflect a government's decision not to publish disaggregated data.
Wo es im Gestein vorkommt
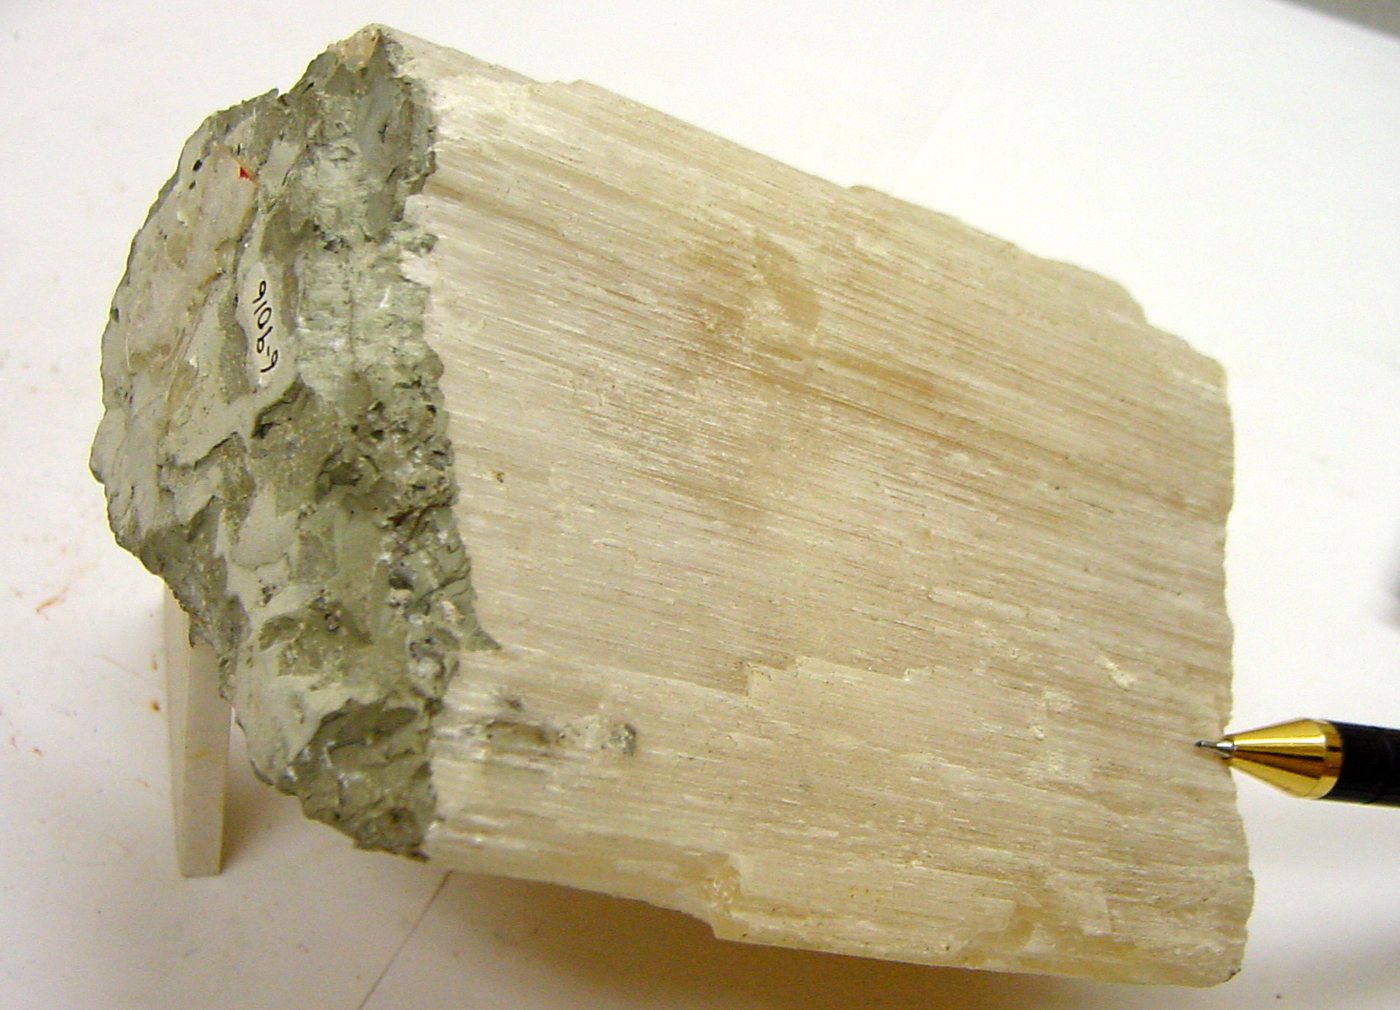
Alle Erzminerale →Dies sind die Mineralien, die tatsächlich soda ash. Eine Lagerstätte ist nur dann ein Erzkörper, wenn eines der Minerale ausreichend konzentriert ist, um den Abbau wirtschaftlich zu rechtfertigen.
Wer es produziert
Auf einer Karte anzeigen →Mine production: Natural
Mine production: Naturalthousand metric tons 2025 (geschätzt)
USGS Mineral Commodity Summaries 2026 · Natural and synthetic production combined, gross weight. · Quelle ↗
Tabelle seitwärts scrollen, um die restlichen Spalten zu sehen.
| Land | Produktion | Anteil an der Weltproduktion |
|---|---|---|
| United States | 12,000 | — |
| Turkey | 6,000 | — |
| Botswana | 290.0 | — |
| Kenya | 270.0 | — |
| Ethiopia | 18.00 | — |
| Other countries | Not applicable | — |
Mine production: natural and synthetic, rounded
Mine production: natural and synthetic, roundedthousand metric tons 2025 (geschätzt) Weltgesamt 71,000 thousand metric tons
USGS Mineral Commodity Summaries 2026 · Natural and synthetic production combined, gross weight. · Quelle ↗
Tabelle seitwärts scrollen, um die restlichen Spalten zu sehen.
| Land | Produktion | Anteil an der Weltproduktion |
|---|---|---|
| Weltgesamt | 71,000 | 100% |
Mine production: natural, rounded
Mine production: natural, roundedthousand metric tons 2025 (geschätzt) Weltgesamt 19,000 thousand metric tons
USGS Mineral Commodity Summaries 2026 · Natural and synthetic production combined, gross weight. · Quelle ↗
Tabelle seitwärts scrollen, um die restlichen Spalten zu sehen.
| Land | Produktion | Anteil an der Weltproduktion |
|---|---|---|
| Weltgesamt | 19,000 | 100% |
Mine production: synthetic
Mine production: syntheticthousand metric tons 2025 (geschätzt) Weltgesamt 52,000 thousand metric tons
USGS Mineral Commodity Summaries 2026 · Natural and synthetic production combined, gross weight. · Quelle ↗
Tabelle seitwärts scrollen, um die restlichen Spalten zu sehen.
| Land | Produktion | Anteil an der Weltproduktion |
|---|---|---|
| Weltgesamt | 52,000 | 100% |
„Withheld" bedeutet, dass der USGS den Wert zurückgehalten hat, um keine Rückschlüsse auf Daten einzelner Unternehmen zuzulassen – er bedeutet nicht null. Die Länderwerte addieren sich nicht immer zum Weltgesamt, weil die Quelle jeden Einzelwert unabhängig rundet und eine Zeile „sonstige Länder" nicht immer ausweist.
Wer die Reserven hält
Reserves: Natural
Reserves: Naturalthousand metric tons 2025
USGS Mineral Commodity Summaries 2026 · Quelle ↗
| Land | Reserven | Anteil an der Weltproduktion |
|---|---|---|
| United States | 23,000,000 | — |
| Turkey | 840,000 | — |
| Ethiopia | 400,000 | — |
| Other countries | 280,000 | — |
| Botswana | 16,000 | — |
| Kenya | 7,000 | — |
Reserves: natural and synthetic, rounded
Reserves: natural and synthetic, roundedthousand metric tons 2025
USGS Mineral Commodity Summaries 2026 · Quelle ↗
| Land | Reserven | Anteil an der Weltproduktion |
|---|---|---|
| Weltgesamt | Not available | 100% |
Reserves: natural, rounded
Reserves: natural, roundedthousand metric tons 2025
USGS Mineral Commodity Summaries 2026 · Quelle ↗
| Land | Reserven | Anteil an der Weltproduktion |
|---|---|---|
| Weltgesamt | 25,000,000 | 100% |
Reserves: synthetic
Reserves: syntheticthousand metric tons 2025
USGS Mineral Commodity Summaries 2026 · Quelle ↗
| Land | Reserven | Anteil an der Weltproduktion |
|---|---|---|
| Weltgesamt | Not available | 100% |
Preis
average unit value of sales (natural source), free on board (f.o.b.) mine or plant: Dollars per metric ton
Jahresdurchschnittdollars per metric ton
Grundlage: average unit value of sales (natural source), free on board (f.o.b.) mine or plant: Dollars per metric ton. Jahresdurchschnitte gemäß Veröffentlichung in USGS Mineral Commodity Summaries 2026 · Quelle ↗. Dies sind jährliche Referenzdurchschnittswerte, kein Live-Marktpreis.
average unit value of sales (natural source), free on board (f.o.b.) mine or plant: Dollars per short ton
Jahresdurchschnittdollars per short ton
Grundlage: average unit value of sales (natural source), free on board (f.o.b.) mine or plant: Dollars per short ton. Jahresdurchschnitte gemäß Veröffentlichung in USGS Mineral Commodity Summaries 2026 · Quelle ↗. Dies sind jährliche Referenzdurchschnittswerte, kein Live-Marktpreis.
Wofür es verwendet wird
Alle Endmärkte →| Endmarkt | Was es dort tut | Bedeutung |
|---|---|---|
| Solar Power | Cover glass | Wichtig |
Wie viel eine Technologie davon benötigt
| Technologie | Menge | Angegeben | Grundlage |
|---|---|---|---|
| Cadmium Telluride Thin-Film Module | 1,500–3,000 kg | per MW of capacity | Glass superstrate |
| Crystalline Silicon Solar Module | 1,000–2,500 kg | per MW of capacity | Cover glass |
Indicative range compiled from published technology studies and chemistry; verify against a manufacturer specification before use. Diese Zahlen mit beliebiger Skalierung im Materialrechner ausführen →