What is it?
Sodium carbonate, mined from trona rock or made from salt, and the second ingredient in almost every sheet of glass.
Why does it matter?
Solar-panel glass, container glass and flat glass all pull on the same soda-ash supply.
Where it is in the Earth
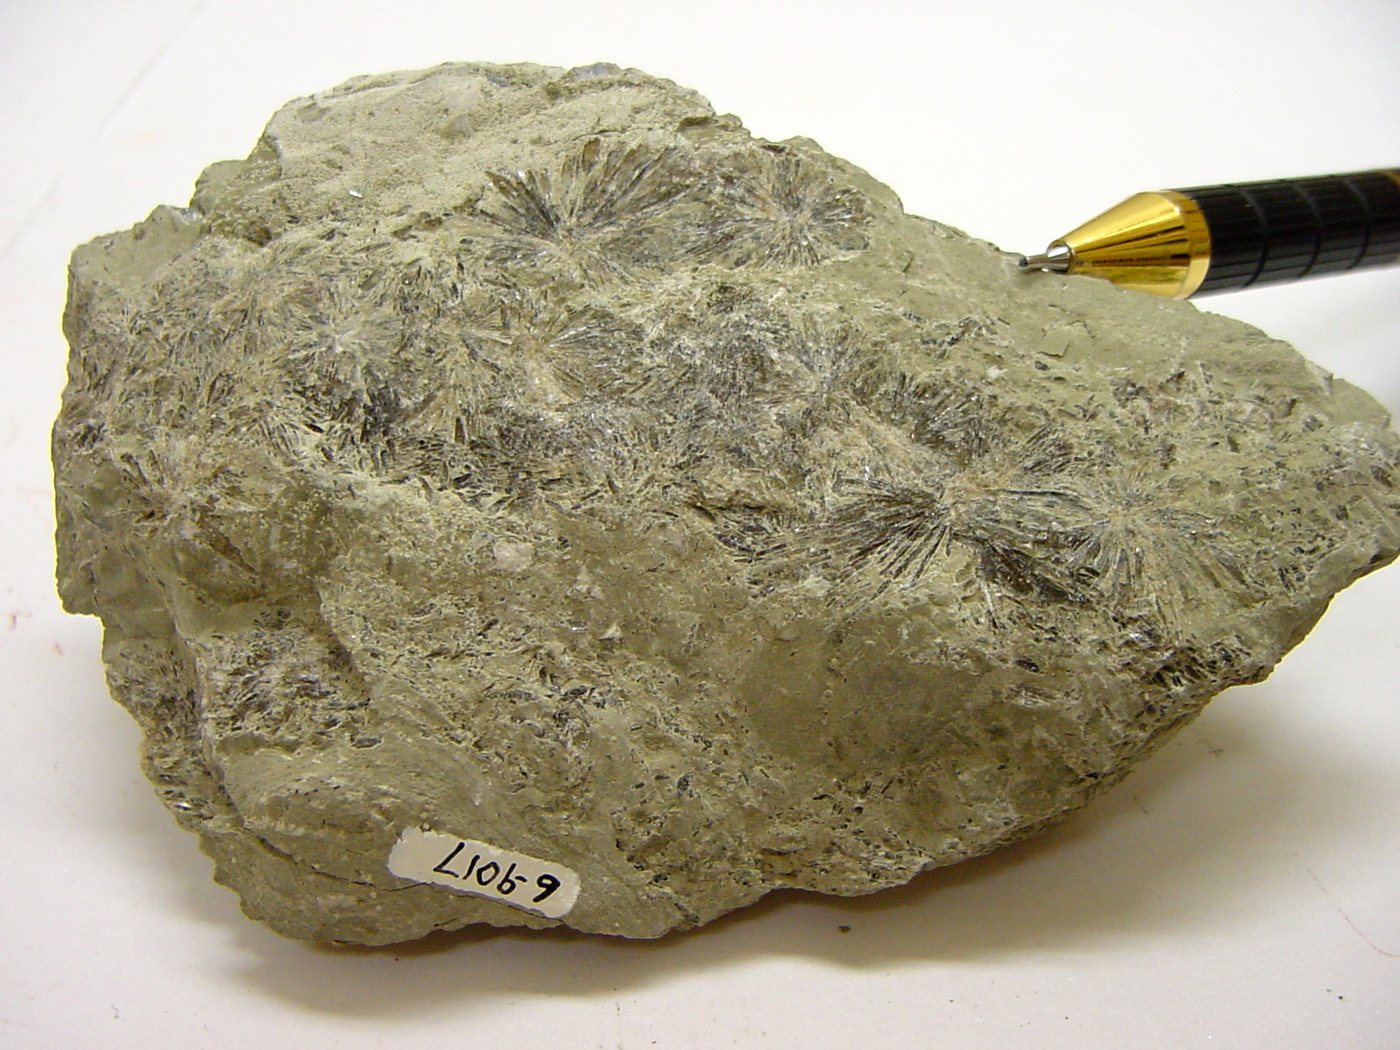
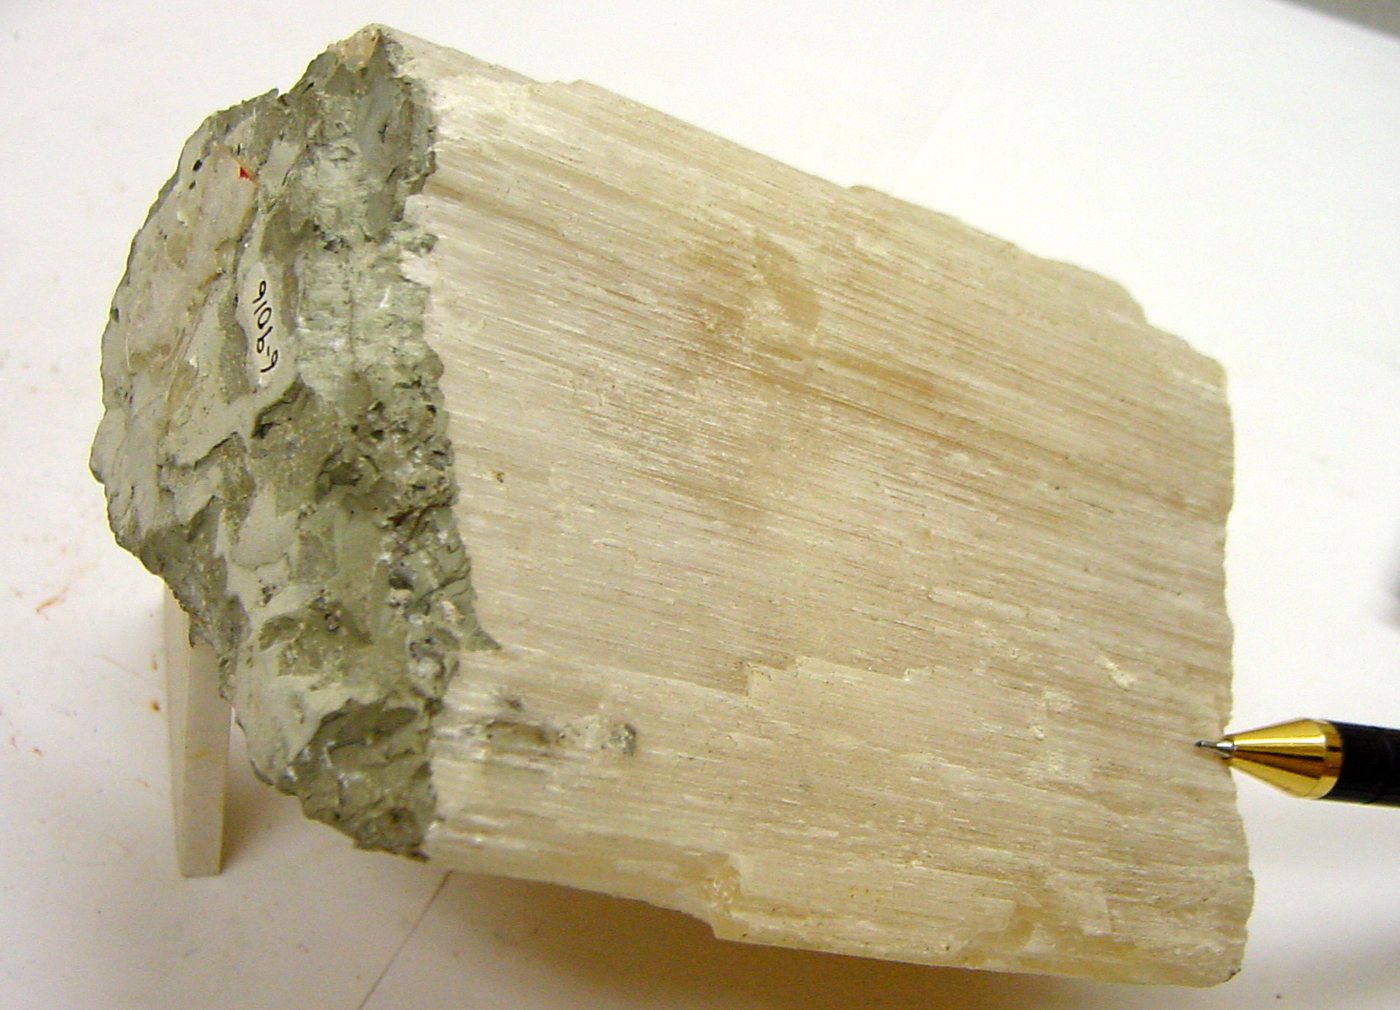
Soda ash is sodium carbonate, and its geological story begins with water — specifically, ancient lakes that had no outlet to the sea. In a closed basin, water flows in carrying dissolved minerals leached from surrounding rocks, but it cannot flow out. Over thousands to millions of years, evaporation concentrates whatever the water holds. Where the catchment rocks were rich in sodium and carbonate, the lake brine eventually reached the point at which solid minerals began to crystallise on the lake floor. The most important of these minerals is trona, a hydrated sodium carbonate bicarbonate, which forms thick, laterally extensive beds interbedded with other evaporite minerals and mudstones. The process is directly analogous to the formation of halite (rock salt) beds, but it requires a particular chemistry in both the source rocks and the brine.
The result is that commercially significant trona deposits are geographically rare. The United States holds by far the largest known reserves, concentrated in the Green River Basin of Wyoming, where a chain of Eocene-age lakes — perhaps 50 million years old — left behind a sequence of trona beds lying beneath the surface. Turkey holds the second-largest reserves, at the Beypazari deposit near Ankara, which formed under broadly similar lacustrine conditions. East African examples in Kenya, Ethiopia and Botswana represent younger, and in some cases still-active, soda lakes in the Rift Valley system, where the same process of closed-basin evaporation continues today at shallower depths. Outside these settings, sodium carbonate does not naturally concentrate to mineable grades; everywhere else, soda ash must be manufactured synthetically from salt and limestone.
The synthetic route — the Solvay process, developed in the nineteenth century — dominates production in China and much of Europe and Asia, where natural trona deposits do not exist. The world production figures in the table reflect this split: of total global output, a substantial portion comes from the synthetic route, with the remainder from natural trona mining. Understanding which category a country falls into matters for cost structure, energy intensity and carbon footprint, since the Solvay process is considerably more energy-intensive than simply mining and calcining trona.
Getting it out
Where trona beds lie close enough to the surface, open-pit mining is possible, as at some of the East African soda-lake operations where mineralised brines or shallow crusts are worked directly. In Wyoming, however, the principal trona seams sit several hundred metres underground, which makes conventional room-and-pillar underground mining the standard method. In this technique, miners drive a network of rectangular tunnels through the ore seam, leaving behind rectangular columns — the pillars — to hold up the roof. The pillars represent ore that cannot be recovered, so the extraction ratio (the proportion of ore actually removed) is determined by the trade-off between recovery and ground stability. The beds at Green River are thick enough and consistent enough in grade that this method is highly productive.
A third approach, solution mining, is also used in Wyoming. Hot water is pumped underground through injection wells, dissolves the trona in place, and the resulting brine is pumped back to surface for processing. This avoids the cost and hazard of underground mining entirely and can access seams too deep or too thin for conventional methods. The trade-off is that not all of the trona dissolves cleanly, and the brine brought to surface carries impurities that require additional processing steps. In the East African Rift lakes, a simpler version of this logic applies: at Lake Natron in Tanzania and Lake Magadi in Kenya, trona and related minerals are harvested directly from the lake surface or shallow waters, a form of extraction that has more in common with salt harvesting than with hard-rock mining.
Because trona is a relatively soft, water-soluble evaporite mineral rather than a hard silicate rock, the waste rock ratios typical of metal mines do not apply in the same way. The challenge is less about separating ore from barren rock and more about removing water, impurities and associated minerals such as halite or nahcolite from a relatively pure sodium carbonate source. Grade in this context means the sodium carbonate equivalent content of the raw trona, and the conversion from trona to soda ash involves driving off water and carbon dioxide by heating — a step called calcination — rather than any chemical separation of the carbonate from a surrounding silicate matrix.
What pulls on it
Glass is the dominant use of soda ash, and this covers a wide range of products: container glass for food and beverages, flat glass for buildings and vehicles, and the borosilicate and speciality glasses used in cookware, laboratory equipment and display screens. In each case, sodium carbonate acts as a flux — it lowers the temperature at which silica sand melts, reducing the energy required to produce molten glass. Without soda ash, the melting points involved would make glass production far more expensive and energy-intensive than it already is. This flux function is not easily replicated by other cheap materials, which is why glass has consumed soda ash in large quantities for centuries and continues to do so.
The energy-transition connection runs through solar glass. Photovoltaic modules — both the crystalline silicon type and cadmium telluride thin-film panels — require high-quality flat glass for their cover layers or substrates. The intensity figures in the table show that each megawatt of installed solar capacity requires a significant quantity of soda ash, which means that rapid growth in solar manufacturing translates directly into additional soda ash demand. Container glass demand tends to track consumer goods production and, over longer timescales, population and income growth. Flat glass for construction follows building activity. Detergents and cleaning products represent another significant end use, since sodium carbonate is an effective water softener and alkali in its own right.
For demand to change sharply downward, glass would need to be displaced at scale by alternative packaging or glazing materials — plastics in containers, organic films in solar panels — or the solar build-out would need to slow substantially. For a sharp increase, the scenario is simpler: continued acceleration of solar panel manufacturing would pull hard on soda ash supply, and there is no obvious short-term substitute for glass in that application. The growth in solar deployment in recent years has already made the energy-transition end use a more prominent part of the demand picture than it was a decade ago.
Where it comes from in the rock
All ore minerals →These are the minerals that actually carry soda ash. A deposit is only an orebody if one of them is concentrated enough to pay for digging it up.
Who produces it
See it on a map →Mine production: Natural
Mine production: Naturalthousand metric tons 2025 (estimated)
USGS Mineral Commodity Summaries 2026 · Natural and synthetic production combined, gross weight. · source ↗
Scroll the table sideways for the remaining columns.
| Country | Production | Share of world |
|---|---|---|
| United States | 12,000 | — |
| Turkey | 6,000 | — |
| Botswana | 290.0 | — |
| Kenya | 270.0 | — |
| Ethiopia | 18.00 | — |
| Other countries | Not applicable | — |
Mine production: natural and synthetic, rounded
Mine production: natural and synthetic, roundedthousand metric tons 2025 (estimated) World total 71,000 thousand metric tons
USGS Mineral Commodity Summaries 2026 · Natural and synthetic production combined, gross weight. · source ↗
Scroll the table sideways for the remaining columns.
| Country | Production | Share of world |
|---|---|---|
| World total | 71,000 | 100% |
Mine production: natural, rounded
Mine production: natural, roundedthousand metric tons 2025 (estimated) World total 19,000 thousand metric tons
USGS Mineral Commodity Summaries 2026 · Natural and synthetic production combined, gross weight. · source ↗
Scroll the table sideways for the remaining columns.
| Country | Production | Share of world |
|---|---|---|
| World total | 19,000 | 100% |
Mine production: synthetic
Mine production: syntheticthousand metric tons 2025 (estimated) World total 52,000 thousand metric tons
USGS Mineral Commodity Summaries 2026 · Natural and synthetic production combined, gross weight. · source ↗
Scroll the table sideways for the remaining columns.
| Country | Production | Share of world |
|---|---|---|
| World total | 52,000 | 100% |
“Withheld” means the USGS suppressed the figure to avoid disclosing an individual company's data — it does not mean zero. Country rows do not always sum to the world total because the source rounds each figure independently and does not always break out an “other countries” line.
Who holds the reserves
Reserves: Natural
Reserves: Naturalthousand metric tons 2025
USGS Mineral Commodity Summaries 2026 · source ↗
| Country | Reserves | Share of world |
|---|---|---|
| United States | 23,000,000 | — |
| Turkey | 840,000 | — |
| Ethiopia | 400,000 | — |
| Other countries | 280,000 | — |
| Botswana | 16,000 | — |
| Kenya | 7,000 | — |
Reserves: natural and synthetic, rounded
Reserves: natural and synthetic, roundedthousand metric tons 2025
USGS Mineral Commodity Summaries 2026 · source ↗
| Country | Reserves | Share of world |
|---|---|---|
| World total | Not available | 100% |
Reserves: natural, rounded
Reserves: natural, roundedthousand metric tons 2025
USGS Mineral Commodity Summaries 2026 · source ↗
| Country | Reserves | Share of world |
|---|---|---|
| World total | 25,000,000 | 100% |
Reserves: synthetic
Reserves: syntheticthousand metric tons 2025
USGS Mineral Commodity Summaries 2026 · source ↗
| Country | Reserves | Share of world |
|---|---|---|
| World total | Not available | 100% |
Price
average unit value of sales (natural source), free on board (f.o.b.) mine or plant: Dollars per metric ton
Annual averagedollars per metric ton
Basis: average unit value of sales (natural source), free on board (f.o.b.) mine or plant: Dollars per metric ton. Annual averages as published in USGS Mineral Commodity Summaries 2026 · source ↗. These are reference annual averages, not a live market quote.
average unit value of sales (natural source), free on board (f.o.b.) mine or plant: Dollars per short ton
Annual averagedollars per short ton
Basis: average unit value of sales (natural source), free on board (f.o.b.) mine or plant: Dollars per short ton. Annual averages as published in USGS Mineral Commodity Summaries 2026 · source ↗. These are reference annual averages, not a live market quote.
What it is used for
All end markets →| End market | What it does there | Importance |
|---|---|---|
| Solar Power | Cover glass | Important |
How much of it a technology needs
| Technology | Quantity | Quoted | Basis |
|---|---|---|---|
| Cadmium Telluride Thin-Film Module | 1,500–3,000 kg | per MW of capacity | Glass superstrate |
| Crystalline Silicon Solar Module | 1,000–2,500 kg | per MW of capacity | Cover glass |
Indicative range compiled from published technology studies and chemistry; verify against a manufacturer specification before use. Run these numbers at any scale in the material calculator →
