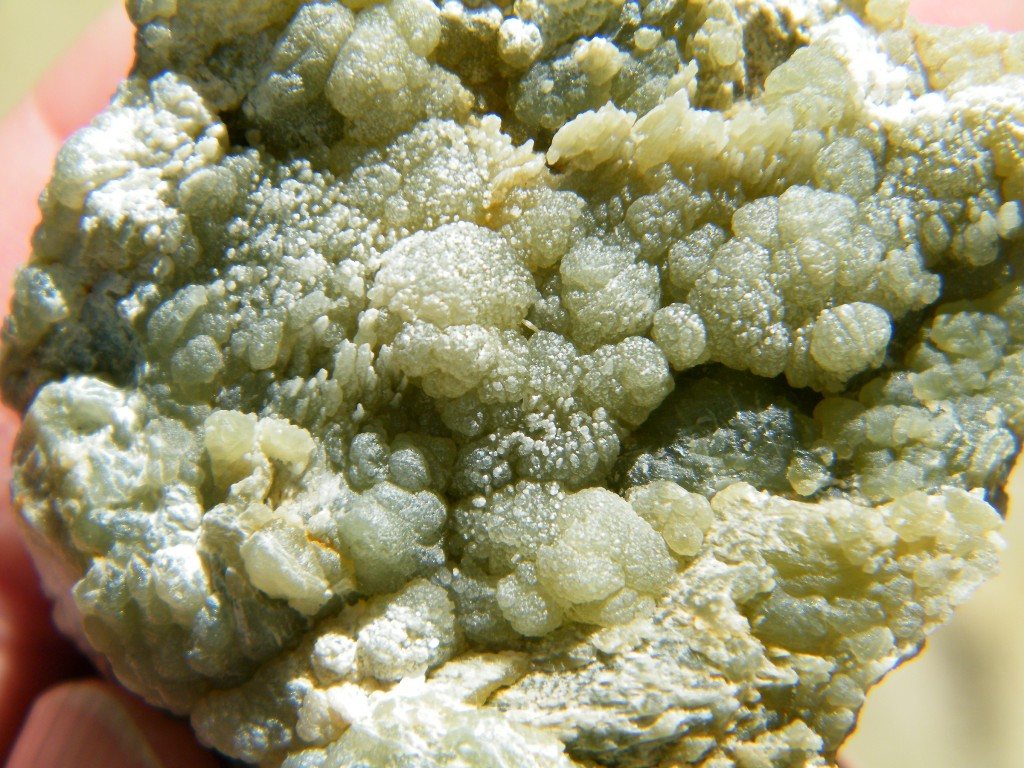
これは何か
The softest mineral there is — a fingernail scratches it — used as a filler that makes plastics stiffer and paper smoother.
なぜ重要なのか
Talc is a functional filler by the hundred thousand tonnes: it is in car bumpers, paint, ceramics and roofing far more than in cosmetics.
Where it is in the Earth
Talc and pyrophyllite are both phyllosilicate minerals — sheet silicates whose atoms are arranged in flat, repeating layers, which is what gives them their characteristic slipperiness. Talc is magnesium-rich; pyrophyllite replaces that magnesium with aluminium. Both form by a process called hydrothermal alteration or metamorphism, in which hot, water-rich fluids or heat and pressure from burial transform pre-existing rocks into something chemically and structurally different. Talc most commonly grows when magnesium-bearing rocks — particularly ultramafic rocks such as dunite or serpentinite, which formed originally from the Earth's mantle — are infiltrated by silica-carrying fluids. Those fluids react with the magnesium silicates already present and convert them, over geological time, into talc. Pyrophyllite, by contrast, tends to form where aluminium-rich rocks or hydrothermal systems interact with acidic fluids under moderate temperature and pressure, often in zones associated with ancient volcanic activity.
The deposits that end up large enough to mine tend to share a common feature: a substantial body of the right precursor rock, combined with a plumbing system — faults, fractures, or permeable contacts between rock types — through which reactive fluids could circulate for long enough to transform meaningful volumes. Many of the world's talc deposits follow the traces of ancient mountain belts, where once-deep ultramafic rocks were pushed to the surface by tectonic collision and then exposed to hydrothermal circulation. The Appalachian belt in the eastern United States, the Himalayan foothills of India and Pakistan, the Alpine terranes of France and Italy, and the cratons of southern Africa all fit this picture. Pyrophyllite deposits in East Asia, particularly in Korea and Japan, are more often associated with ancient volcanic arcs where acidic hydrothermal systems altered volcanic and sedimentary rocks over large areas.
The result is that both minerals tend to occur as irregular lenses, pods, or bands within a host rock rather than as uniform, predictable layers. The grade — meaning the proportion of actual talc or pyrophyllite in the material extracted — varies considerably within a single deposit, which has real consequences for how mining is planned and how much of what is dug up can actually be sold.
Getting it out
Most talc and pyrophyllite is mined in open pits, which are essentially large terraced excavations cut into the surface of the ground. Open-pit mining is preferred where the ore body is near enough to the surface that removing the overlying rock — the waste material that must be stripped away before ore can be reached, called overburden — is economically manageable. Because talc deposits are often irregular in shape, the boundary between ore-grade material and waste can shift across short distances, and miners must sample and test the rock as they go to decide what to send to the processing plant and what to leave in the waste pile. Some deeper or narrower deposits are worked underground, using tunnels driven into the ore body, but this is less common.
Talc is the softest mineral on the standard geological hardness scale — the Mohs scale, which runs from one to ten — so the rock containing it is usually not especially hard to break. Drilling and blasting are still used in most operations to fragment the rock mass, but the energy required is modest compared with hard-rock mining for metals. The mineral's softness is also a disadvantage in one respect: it means talc particles are easily generated by any mechanical contact during handling and transport, raising dust-management considerations throughout the operation.
The ratio of waste moved to ore produced varies enormously depending on deposit geometry and where in the pit the operation is working at any given time. In a well-defined, high-grade lens the stripping ratio — tonnes of overburden removed for each tonne of ore extracted — can be low. In irregular deposits it can be considerably higher. Because talc and pyrophyllite are relatively low-value commodities measured per tonne, keeping the stripping ratio under control is a significant part of what makes a deposit economical to work.
What pulls on it
Talc's primary commercial value is as a functional filler — a material added to a product not merely to bulk it out cheaply but because it changes the product's properties in useful ways. In plastics, particularly polypropylene used in car bumpers, dashboards, and appliance housings, talc platelet particles stiffen the material and reduce how much it shrinks or warps during moulding. In paper, a coating of fine talc improves how ink sits on the surface and makes the sheet feel smoother. In ceramics, talc contributes to the flux chemistry of the body, helping it mature at lower firing temperatures. Roofing products, particularly asphalt-based shingles, use talc to prevent sheets sticking together during manufacture and storage. Paints use it to control rheology — the way a paint flows and levels out — and to fill volume without the cost of more expensive white pigments. Cosmetics, despite their visibility in public perception of talc, account for a modest share of total consumption compared with these industrial uses.
Demand tends to track broadly with manufacturing activity in the economies that consume most of it. Growth in automotive production, construction, and paper manufacturing in Asia has supported demand there over recent decades. In Western markets, the long decline in newsprint and publication paper has reduced one traditional end-market, while growth in lightweight automotive components and in plastics-intensive consumer goods has partially offset that. Pyrophyllite, whose aluminium-rich chemistry makes it more suitable for high-temperature ceramics and refractories — materials used to line furnaces and other high-heat industrial equipment — follows a somewhat different demand pattern, tied more closely to steel and glass production.
A meaningful shift in demand in either direction would require a change in the industries that consume it rather than in any property of talc itself. A substantial reduction in internal combustion engine vehicle production, for instance, would remove one of the significant polypropylene-compounding applications. Conversely, growth in lightweight thermoplastic composites in construction or in electric vehicle body components could add demand. Neither shift depends on anything intrinsic to talc — the mineral is a passive participant in those larger industrial transitions.
生産者
地図で見る →Mine production
Mine productionthousand metric tons 2025 (推定値) 世界合計 6,900 thousand metric tons
USGS Mineral Commodity Summaries 2026 · Gross weight; crude and beneficiated grades combined. · 出典 ↗
テーブルを横にスクロールすると残りの列が表示されます。
| 国 | 生産 | 世界に占める割合 |
|---|---|---|
| Turkey | 300.0 | 4.3% |
| South Africa | 300.0 | 4.3% |
| Korea, Republic of | 300.0 | 4.3% |
| Finland | 200.0 | 2.9% |
| Afghanistan | 200.0 | 2.9% |
| Japan | 130.0 | 1.9% |
| 世界合計 | 6,900 | 100% |
Mine production: crude
Mine production: crudethousand metric tons 2025 (推定値)
USGS Mineral Commodity Summaries 2026 · Gross weight; crude and beneficiated grades combined. · 出典 ↗
テーブルを横にスクロールすると残りの列が表示されます。
| 国 | 生産 | 世界に占める割合 |
|---|---|---|
| United States | 490.0 | — |
| France | 300.0 | — |
Mine production: crude and beneficiated
Mine production: crude and beneficiatedthousand metric tons 2025 (推定値)
USGS Mineral Commodity Summaries 2026 · Gross weight; crude and beneficiated grades combined. · 出典 ↗
テーブルを横にスクロールすると残りの列が表示されます。
| 国 | 生産 | 世界に占める割合 |
|---|---|---|
| Brazil | 570.0 | — |
Mine production: includes crude
Mine production: includes crudethousand metric tons 2025 (推定値)
USGS Mineral Commodity Summaries 2026 · Gross weight; crude and beneficiated grades combined. · 出典 ↗
テーブルを横にスクロールすると残りの列が表示されます。
| 国 | 生産 | 世界に占める割合 |
|---|---|---|
| Other countries | 790.0 | — |
Mine production: includes steatite
Mine production: includes steatitethousand metric tons 2025 (推定値)
USGS Mineral Commodity Summaries 2026 · Gross weight; crude and beneficiated grades combined. · 出典 ↗
テーブルを横にスクロールすると残りの列が表示されます。
| 国 | 生産 | 世界に占める割合 |
|---|---|---|
| Italy | 170.0 | — |
Mine production: steatite
Mine production: steatitethousand metric tons 2025 (推定値)
USGS Mineral Commodity Summaries 2026 · Gross weight; crude and beneficiated grades combined. · 出典 ↗
テーブルを横にスクロールすると残りの列が表示されます。
Mine production: unspecified minerals
Mine production: unspecified mineralsthousand metric tons 2025 (推定値)
USGS Mineral Commodity Summaries 2026 · Gross weight; crude and beneficiated grades combined. · 出典 ↗
テーブルを横にスクロールすると残りの列が表示されます。
「非開示」とは、個別企業のデータが特定されないようUSGSが数値を公表しなかったことを意味し、ゼロを意味するものではありません。出典が各数値を独立して丸め処理しており、「その他の国」の内訳を常に示しているわけではないため、各国の数値の合計が世界合計と一致しないことがあります。
埋蔵量の保有者
Reserves
Reservesthousand metric tons 2025
USGS Mineral Commodity Summaries 2026 · 出典 ↗
| 国 | 埋蔵量 | 世界に占める割合 |
|---|---|---|
| Japan | 100,000 | — |
| Korea, Republic of | 81,000 | — |
| Turkey | 15,000 | — |
| South Africa | Not applicable | — |
| Afghanistan | Large | — |
| Finland | Large | — |
| 世界合計 | Large | 100% |
Reserves: crude
Reserves: crudethousand metric tons 2025
USGS Mineral Commodity Summaries 2026 · 出典 ↗
| 国 | 埋蔵量 | 世界に占める割合 |
|---|---|---|
| United States | 140,000 | — |
| France | Large | — |
Reserves: crude and beneficiated
Reserves: crude and beneficiatedthousand metric tons 2025
USGS Mineral Commodity Summaries 2026 · 出典 ↗
| 国 | 埋蔵量 | 世界に占める割合 |
|---|---|---|
| Brazil | 48,000 | — |
Reserves: includes crude
Reserves: includes crudethousand metric tons 2025
USGS Mineral Commodity Summaries 2026 · 出典 ↗
| 国 | 埋蔵量 | 世界に占める割合 |
|---|---|---|
| Other countries | Large | — |
Reserves: includes steatite
Reserves: includes steatitethousand metric tons 2025
USGS Mineral Commodity Summaries 2026 · 出典 ↗
| 国 | 埋蔵量 | 世界に占める割合 |
|---|---|---|
| Italy | Not applicable | — |
Reserves: steatite
Reserves: steatitethousand metric tons 2025
USGS Mineral Commodity Summaries 2026 · 出典 ↗
Reserves: unspecified minerals
Reserves: unspecified mineralsthousand metric tons 2025
USGS Mineral Commodity Summaries 2026 · 出典 ↗
価格
average, milled, dollars per metric ton
年間平均dollars per metric ton
基準: average, milled, dollars per metric ton. 以下に公表された年間平均値: USGS Mineral Commodity Summaries 2026 · 出典 ↗. これらは参照用の年間平均値であり、リアルタイムの市況相場ではない。