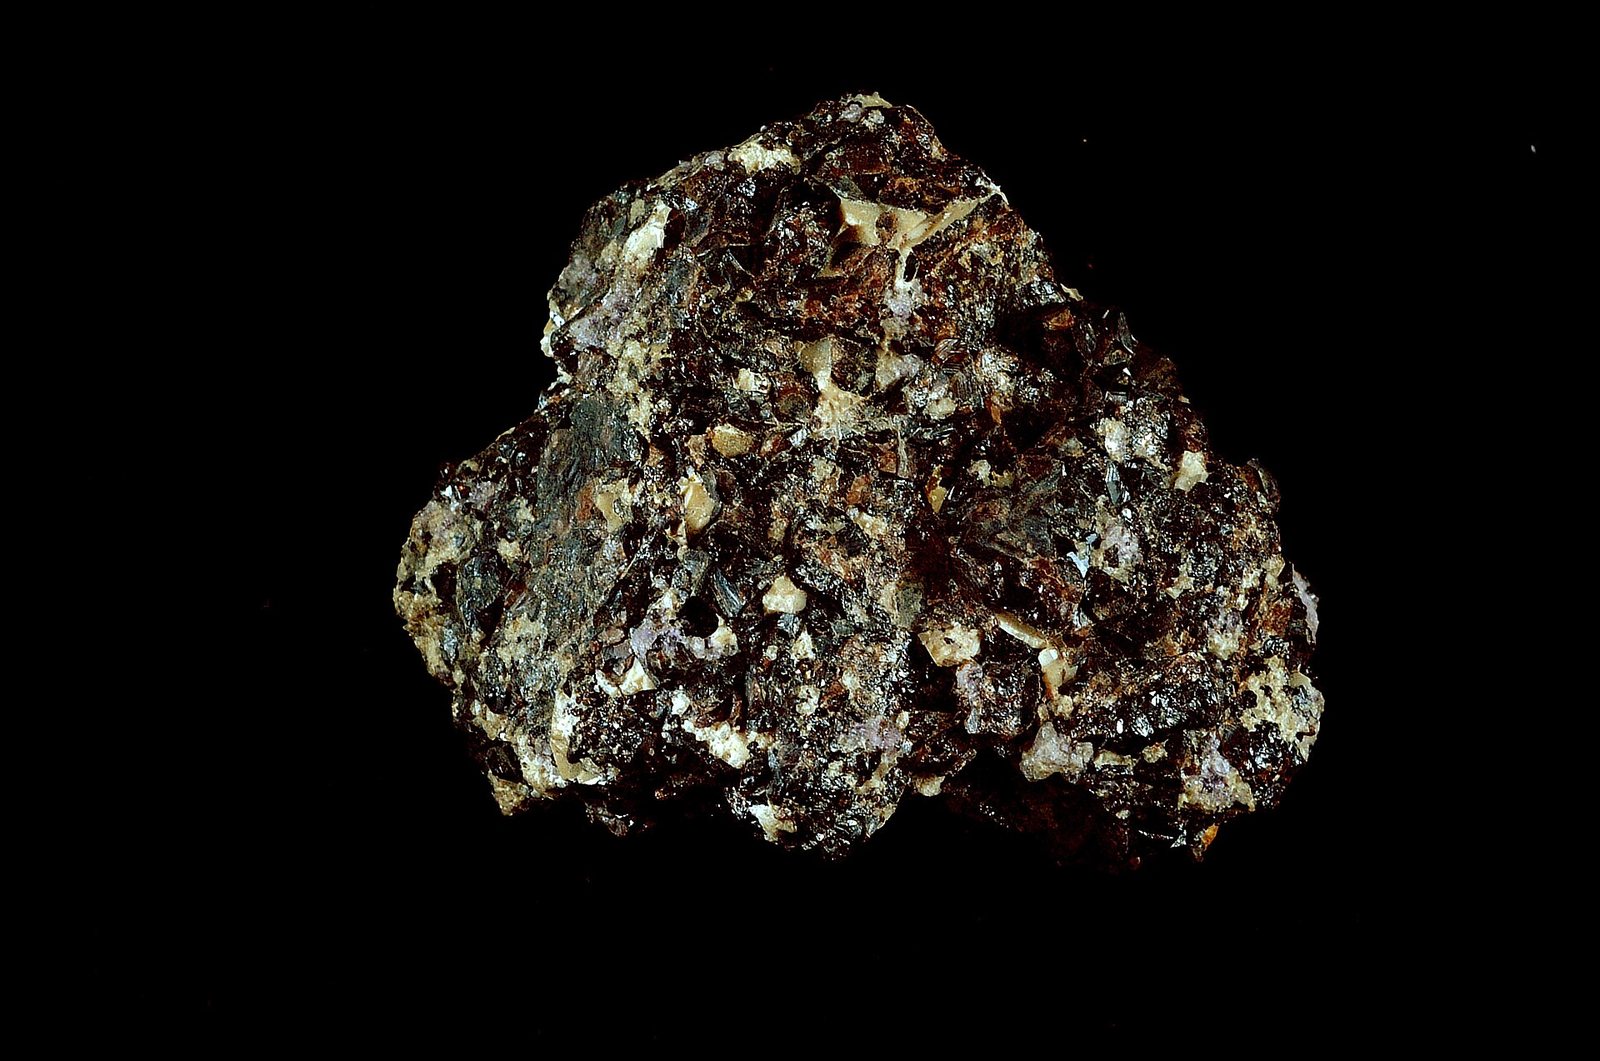
What is it?
A soft metal with a low melting point, which is why nearly every electrical joint in every device is held together with it.
Why does it matter?
Solder is about half of tin demand. It has been called the most electronics-exposed of all the base metals.
Where it is in the Earth
Where it is in the Earth
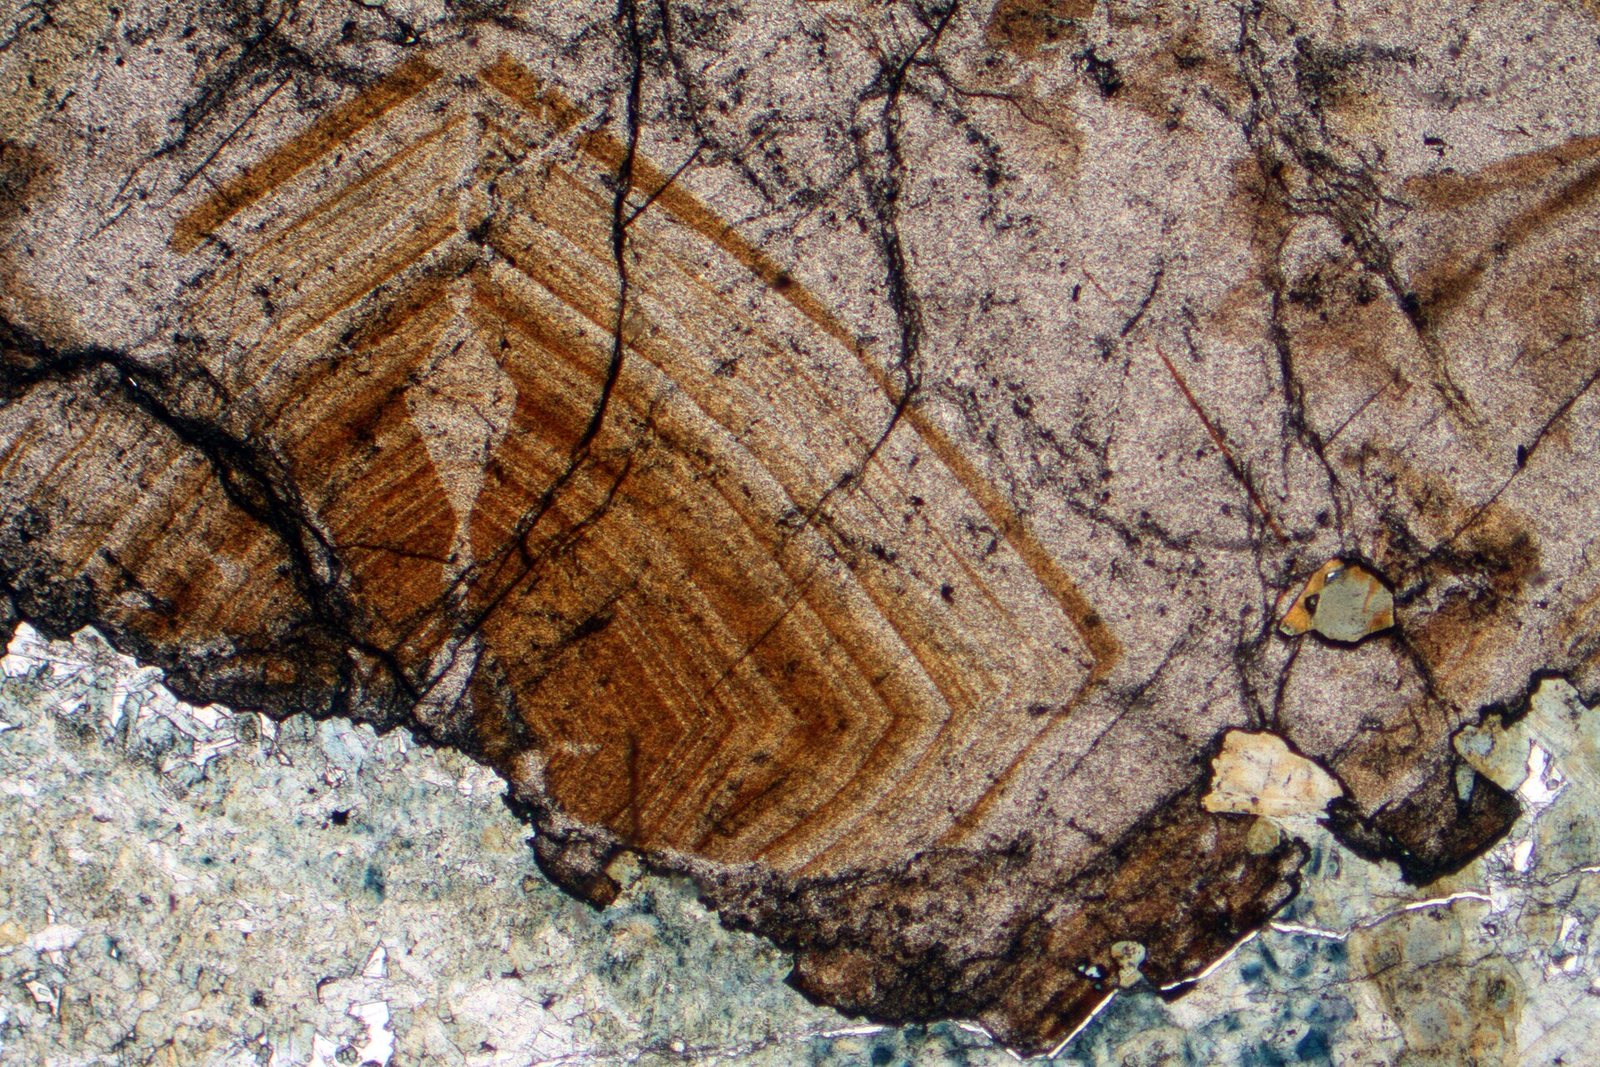
Tin is almost always found in a single ore mineral: cassiterite, which is tin dioxide. Cassiterite is chemically stable and physically hard, and it forms under specific conditions that do not occur widely. The mineral crystallises from hot, water-rich fluids that intrude into surrounding rock during the final stages of a granite body cooling deep in the crust. These fluids carry dissolved tin and deposit it in veins and fractured zones, a process geologists call hydrothermal mineralisation. The granite bodies associated with tin are of a particular chemical type — rich in silica, fluorine and boron — and the tin tends to concentrate at or near the boundary between the granite and the older rocks it has intruded.
Because cassiterite is so physically resilient, it survives erosion long after the original host rock has been broken down by weathering. The heavy mineral grains wash into rivers and accumulate on stream beds and in coastal sediments, forming deposits called placers or alluvials. Much of the world's historical tin production came from exactly this kind of deposit. The great tin belts of Southeast Asia — running through Myanmar, Thailand, Malaysia and Indonesia — are classic examples of alluvial tin districts, where erosion of older granite-hosted veins fed metal into river systems over millions of years. In contrast, the tin districts of Bolivia and parts of Brazil and the Democratic Republic of Congo are primary hard-rock deposits where the original veins have not been fully eroded away.
The concentration of tin in ordinary crustal rocks is very low, which means a deposit needs to be substantially enriched above background levels before mining makes any sense. The geological conditions required — the right granite chemistry, the right depth, the right fluid circulation — do not come together in many places on Earth, which explains why meaningful tin deposits are found in a relatively small number of countries and why the metal has historically commanded a price far above the commonest industrial metals.
Getting it out
Getting it out
How tin is extracted depends almost entirely on the type of deposit. Alluvial deposits, where cassiterite grains sit in loose sand and gravel, are worked by methods closer to large-scale hydraulic excavation than to conventional hard-rock mining. Dredges — floating machines that scoop up the sediment from riverbeds or shallow coastal areas — have long been the defining image of Southeast Asian tin production, particularly in Indonesia and Malaysia. The gravel is lifted aboard, the cassiterite is separated by its high density using gravity, and the tailings are discharged back into the water. The ore grades in alluvial deposits are typically measured in grams of tin per cubic metre of material processed rather than as a percentage by weight, because the tin is thinly dispersed through enormous volumes of sediment.
Hard-rock deposits are a different matter. Here, the cassiterite sits in veins or disseminated through rock, and the ore must be drilled, blasted and hauled before any separation can begin. Deposits near the surface are mined by open pit; deeper ones require underground development with shafts or declines. Bolivia's tin mines are famously high-altitude underground operations working narrow, high-grade veins under physically demanding conditions. In the Democratic Republic of Congo, much production comes from artisanal and small-scale miners using manual methods — picks, shovels and hand-operated sluices — in difficult terrain with minimal infrastructure.
The grade of a tin deposit — the concentration of metal in the ore — matters enormously to the economics. A higher-grade deposit can sustain expensive underground methods; a lower-grade deposit may only be viable as an alluvial or open-pit operation where the volume of material processed is very large and the mining cost per tonne of ore is low. Either way, for every tonne of refined tin produced, a much larger mass of waste rock or tailings must be moved and managed, and the ratio of waste to product is a central constraint on both cost and environmental impact.
What pulls on it
What pulls on it
The dominant use of refined tin is as solder — the metal alloy that physically connects components to printed circuit boards and joins wires in almost every electronic device made. When solder is applied in liquid form and allowed to solidify, it creates an electrical and mechanical joint. Tin's low melting point makes it practical for this purpose, because the temperatures needed to reflow solder are low enough not to damage delicate components. No other widely available metal combines the melting point, electrical conductivity, wettability and non-toxicity that solder requires, which is why the connection between tin demand and the electronics industry is so direct.
A second major use is tinplate — thin sheet steel coated with a layer of tin to prevent corrosion. Tinplate is the material of food cans and a wide range of packaging. This use is mature and in long-term modest decline in many high-income markets as competing packaging materials take share, though food-can production remains very large in absolute terms globally. Tin is also consumed as a chemical intermediate, particularly in organotin compounds used in PVC stabilisers and agricultural applications, and as a component of specialty alloys including bronze and bearing metals.
The direction of demand is largely set by electronics. The ongoing spread of semiconductor content into vehicles, the construction of data centres, the expansion of solar power installations — all of which require soldered connections — tends to support tin consumption. Each solar panel contains solder-coated copper ribbon connecting cells, and the quantity of solder involved across a large installation is not trivial. A sharp slowdown in electronics manufacturing would weaken tin demand significantly, while a prolonged acceleration in the deployment of solar, electric vehicles or server infrastructure would pull in the other direction. The intensity of tin use per device is not fixed: as electronics are miniaturised, less solder is used per joint, but the number of joints per device has also grown, and the two effects have broadly offset each other over time.
Turning ore into product Level 3
Turning ore into product
For alluvial tin, the concentration step is essentially done at the mine using gravity separation, because cassiterite is far denser than the silica and clay minerals surrounding it. The resulting concentrate is already relatively high-grade by the time it leaves the mine site. Hard-rock ores require more work: the run-of-mine rock is first crushed and ground in a process called comminution, which reduces the particle size until the cassiterite grains are liberated from the surrounding waste minerals. Gravity circuits — jigs, shaking tables and spirals — then exploit the density difference to produce a concentrate. Flotation, which uses surfactant chemistry to make target minerals adhere to air bubbles, plays a secondary role in tin processing, because cassiterite responds to flotation less cleanly than sulfide minerals do. Fine-grained cassiterite is particularly prone to loss in tailings, and recovery rates at hard-rock operations can vary significantly depending on ore texture.
The concentrate, typically carrying tin as a substantial fraction of its weight, is then smelted. Tin smelting is a pyrometallurgical process: the concentrate is fed into a furnace with carbon-bearing reducing agents, which strip the oxygen from the cassiterite and leave behind crude metal. This slag-and-metal separation step is followed by fire refining, in which the crude tin is kept molten and various impurities — iron, arsenic, lead, bismuth — are removed in sequence by controlled oxidation or by adding reagents that cause them to report to a separate dross layer floating on the melt. The product of refining is ingot tin at 99.85 per cent purity or better, which is the benchmark traded form. Some producers carry the process further, through electrolytic refining, to reach very high purities required by certain electronic applications.
By-product recovery adds complexity and value at some operations. Tin ores frequently carry other metals — tungsten, tantalum, niobium, copper — and the processing flowsheet may include steps to recover these as separate concentrates. In the DRC in particular, columbite-tantalite (colloquially coltan) and wolframite are recovered alongside cassiterite at artisanal and semi-industrial operations, and the economics of each commodity influence what gets mined and what gets left. The cost structure of tin smelting is dominated by energy consumption in the furnace and by the grade and volume of the concentrate feed; operations processing lower-grade or fine-grained concentrates face higher per-unit costs and lower recoveries.
Substitution and recycling Level 3
Substitution and recycling
In solder, the central question for the past two decades has been how to manage the removal of lead, which was the traditional alloying partner for tin. The shift to lead-free solders — driven by regulation in most major markets — actually increased tin content per joint, because lead-free alloys are predominantly tin with small additions of silver, copper or bismuth. Attempts to replace tin in solder entirely have not found a practical path: conductive adhesives can substitute in some low-temperature or flexible-electronics applications, but they cannot match the joint strength, thermal cycling resistance and throughput of solder in mainstream electronics assembly. The performance gap is real and the manufacturing infrastructure for soldering is enormous, which together make wholesale substitution unlikely in the near term.
In tinplate, the tin layer is thin and the coating is already as light as practical quality control allows. Aluminium cans and glass containers displace tinplate in some packaging segments, but this is market competition rather than a technical substitution of tin within the product. For tin chemicals, alternative stabiliser systems exist for PVC and are used in some markets where organotin use is restricted, but the alternatives are not always equal in performance or cost.
Recycling of tin is technically straightforward from some streams — solder dross generated during electronics assembly is collected and reprocessed at a reasonable rate, and tinplate scrap carries recoverable tin — but the quantities involved relative to total demand are modest. Most tin ends up diffusely distributed across millions of devices and food cans in consumer waste streams, and the economics of recovering it from that diffuse state are rarely favourable compared with primary production. Tin from end-of-life electronics is largely lost rather than captured, because the concentration in each device is small and disassembly is labour-intensive. The recycled fraction of tin supply is meaningful but well below the recycling rates seen for metals like aluminium or copper, and closing that gap would require substantial changes to collection infrastructure and processing economics.
Where the chain is fragile Level 4
Where the chain is fragile
The geographic concentration of tin supply is pronounced at every stage. Mine production is heavily concentrated in China and Indonesia together, which between them account for nearly half of the 290,000 metric tonnes of world output recorded for 2025. China also holds 1,200,000 metric tonnes of reserves and dominates the smelting and refining industry; it is simultaneously a major producer, the world's largest consumer, and a significant exporter of refined metal, which means that a policy shift or production disruption in China propagates rapidly through global markets. Indonesia's 1,400,000 metric tonnes of reserves represent the world's largest national reserve base, but Indonesian production has been subject to repeated regulatory changes affecting export licensing for concentrates, and the relationship between stated reserves and actual accessible production in any given year is not always straightforward.
A structural feature of the tin supply chain that receives less attention than the geographic concentration is the role of artisanal and small-scale mining, particularly in the DRC and to some extent in Myanmar and Bolivia. These sources collectively contribute a material share of world supply, but their output is difficult to measure accurately, responds erratically to price signals, and carries significant uncertainty around conflict-mineral traceability requirements imposed by importing jurisdictions. Published production figures for these countries should be understood as estimates with wider error margins than those for large-scale, formally reported operations. The USGS and other agencies draw on trade data, company reports and survey data that are patchy in some producing countries, which is one reason why figures from different institutional sources sometimes diverge.
The processing bottleneck is smelting capacity, which is geographically concentrated in China and a small number of Southeast Asian countries. There is no large smelting industry in the major consuming economies of Europe or North America, which means that the refined ingot supply chain involves long logistics chains across political boundaries. Lead times for new smelter construction are measured in years, and the capital and regulatory requirements limit the number of credible new entrants. Permitting timelines for new primary tin mines in established mining jurisdictions are also long — the gap between discovery and production for a hard-rock tin deposit is typically a decade or more — which limits the speed with which supply can respond to a sustained shortfall. The combination of a narrow producing country base, artisanal-sector opacity, smelter concentration and long project lead times is what puts tin on critical mineral lists in multiple jurisdictions.
Where it comes from in the rock
All ore minerals →These are the minerals that actually carry tin. A deposit is only an orebody if one of them is concentrated enough to pay for digging it up.
Who produces it
See it on a map →Mine production
Mine productionmetric tons 2025 (estimated) World total 290,000 metric tons
USGS Mineral Commodity Summaries 2026 · Mine production of contained tin. · source ↗
Scroll the table sideways for the remaining columns.
| Country | Production | Share of world |
|---|---|---|
| China | 71,000 | 24.5% |
| Indonesia | 61,000 | 21.0% |
| Peru | 33,000 | 11.4% |
| Brazil | 28,000 | 9.7% |
| Congo (Kinshasa) | 27,000 | 9.3% |
| Bolivia | 15,000 | 5.2% |
| Burma | 12,000 | 4.1% |
| Australia | 12,000 | 4.1% |
| Vietnam | 11,000 | 3.8% |
| Malaysia | 5,000 | 1.7% |
| Rwanda | 4,600 | 1.6% |
| Russia | 4,500 | 1.6% |
| Nigeria | 3,500 | 1.2% |
| Laos | 1,800 | 0.6% |
| Other countries | 1,700 | 0.6% |
| United States | Zero | — |
| World total | 290,000 | 100% |
“Withheld” means the USGS suppressed the figure to avoid disclosing an individual company's data — it does not mean zero. Country rows do not always sum to the world total because the source rounds each figure independently and does not always break out an “other countries” line.
Who holds the reserves
Reserves
Reservesmetric tons 2025
USGS Mineral Commodity Summaries 2026 · source ↗
| Country | Reserves | Share of world |
|---|---|---|
| Indonesia | 1,400,000 | 23.3% |
| China | 1,200,000 | 20.0% |
| Brazil | 700,000 | 11.7% |
| Burma | 700,000 | 11.7% |
| Australia | 570,000 | 9.5% |
| Russia | 460,000 | 7.7% |
| Bolivia | 400,000 | 6.7% |
| Other countries | 310,000 | 5.2% |
| Peru | 150,000 | 2.5% |
| Congo (Kinshasa) | 91,000 | 1.5% |
| Vietnam | 23,000 | 0.4% |
| United States | Zero | — |
| Laos | Not applicable | — |
| Malaysia | Not applicable | — |
| Nigeria | Not applicable | — |
| Rwanda | Not applicable | — |
| World total | >6,000,000 | 100% |
The source publishes this world total as a bound rather than a point figure, so the shares in the last column are themselves bounds.
Price
Tin, global price
Annual averageUS$ per tonne
Basis: IMF global price of tin — 99.85% pure, LME spot. Annual averages as published in FRED (IMF primary commodity prices) · source ↗. These are reference annual averages, not a live market quote.
average, cents per pound: New York dealer
Annual averagecents per pound
Basis: average, cents per pound: New York dealer. Annual averages as published in USGS Mineral Commodity Summaries 2026 · source ↗. These are reference annual averages, not a live market quote.
average, cents per pound: London Metal Exchange (LME), cash
Annual averagecents per pound
Basis: average, cents per pound: London Metal Exchange (LME), cash. Annual averages as published in USGS Mineral Commodity Summaries 2026 · source ↗. These are reference annual averages, not a live market quote.
What it is used for
All end markets →| End market | What it does there | Importance |
|---|---|---|
| Consumer Electronics | Solder | Defining |
| Data Centres & AI | Solder on every board | Important |
| Solar Power | Solder-coated interconnect ribbon | Important |
| Semiconductors | EUV light source and solder | Important |