All · 146
Rare Earth Elements · 18Aerospace & Defence Materials · 10Agricultural Minerals · 3Battery Materials · 5Copper & Electrical Materials · 4Energy Raw Materials · 7Industrial Minerals · 35Nuclear Materials · 5Precious Metals · 10Semiconductor Materials · 11Steel & Alloy Metals · 13Wood & Forest Products · 25
Critical Mineral · 63Strategic · 36Construction · 35Byproduct Only · 27Energy Transition · 26Defence · 24Chip Chain · 17Forest Product · 12Recyclable at Scale · 9Magnet Chain · 8Hardwood · 8Softwood · 7Renewable · 6Food Chain · 6Engineered Wood · 4Grid Chain · 2
2 materials shown. Figures are from USGS Mineral Commodity Summaries 2026 · as each source defines it for each commodity · source ↗
Scroll the table sideways for the remaining columns.
| Material | Shelf | World production 2025 | World reserves | Leading producer | U.S. imported |
|---|---|---|---|---|---|
|
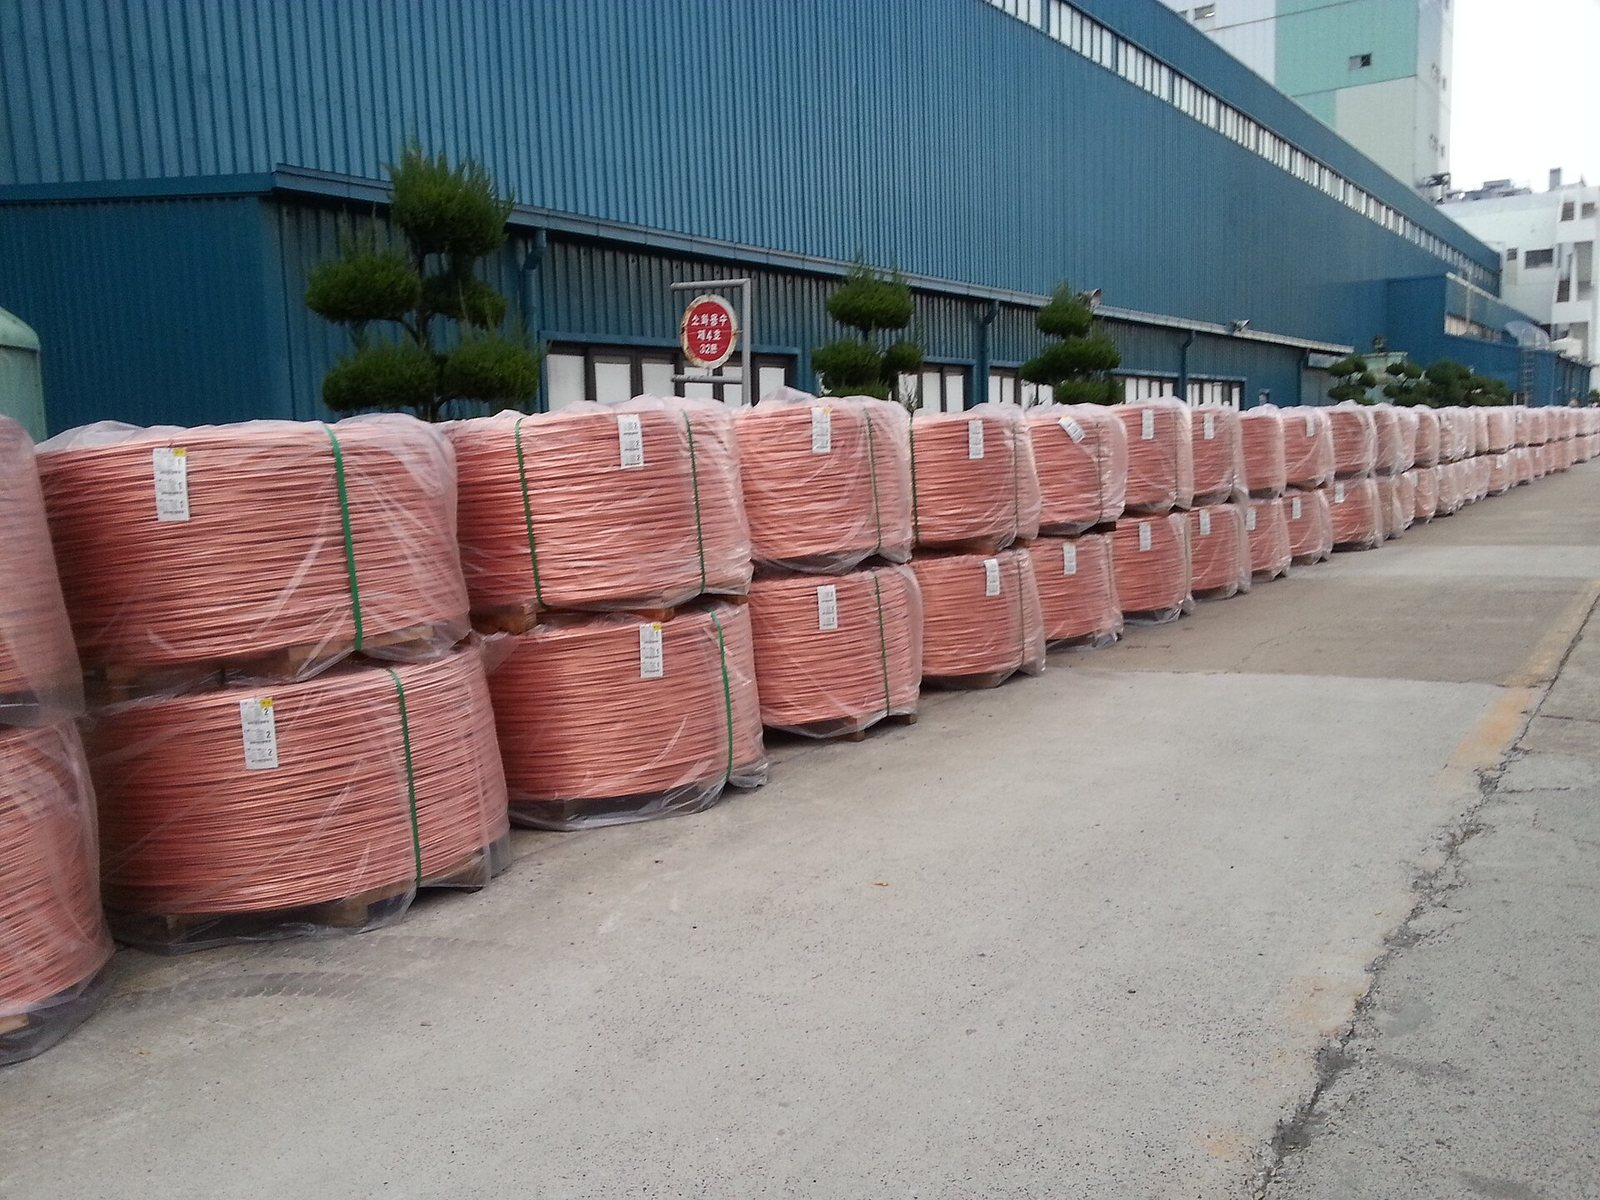
Copper criticalThe reddish metal that carries electricity better than anything except silver, and which humans…
|
Copper & Electrical Materials | 23,000thousand metric tons · Mine production | 980,000 | Chile23% of world production | — |
|
Aluminium criticalA light silvery metal made by passing an enormous electric current through dissolved bauxite —…
|
Copper & Electrical Materials | 74,000thousand metric tons · Smelter production | — | China61% of world production† | 60% |
† Worked out from the USGS production table: the leading country’s output divided by the world total. Where the USGS publishes the share itself, that figure is shown instead.
Photographs on this page · 3
- Copper wire rod produced by LS Cable & System.jpg · Lsgeeks · CC BY-SA 3.0
- Chalcopyrite botroïdale.jpg · Didier Descouens · CC BY-SA 3.0
- Aluminum ingots at Norwegian Aluminium Company.jpg · Anders Beer Wilse · CC BY 4.0
Every photograph is from Wikimedia Commons and is used under the licence shown.