Apa ini?
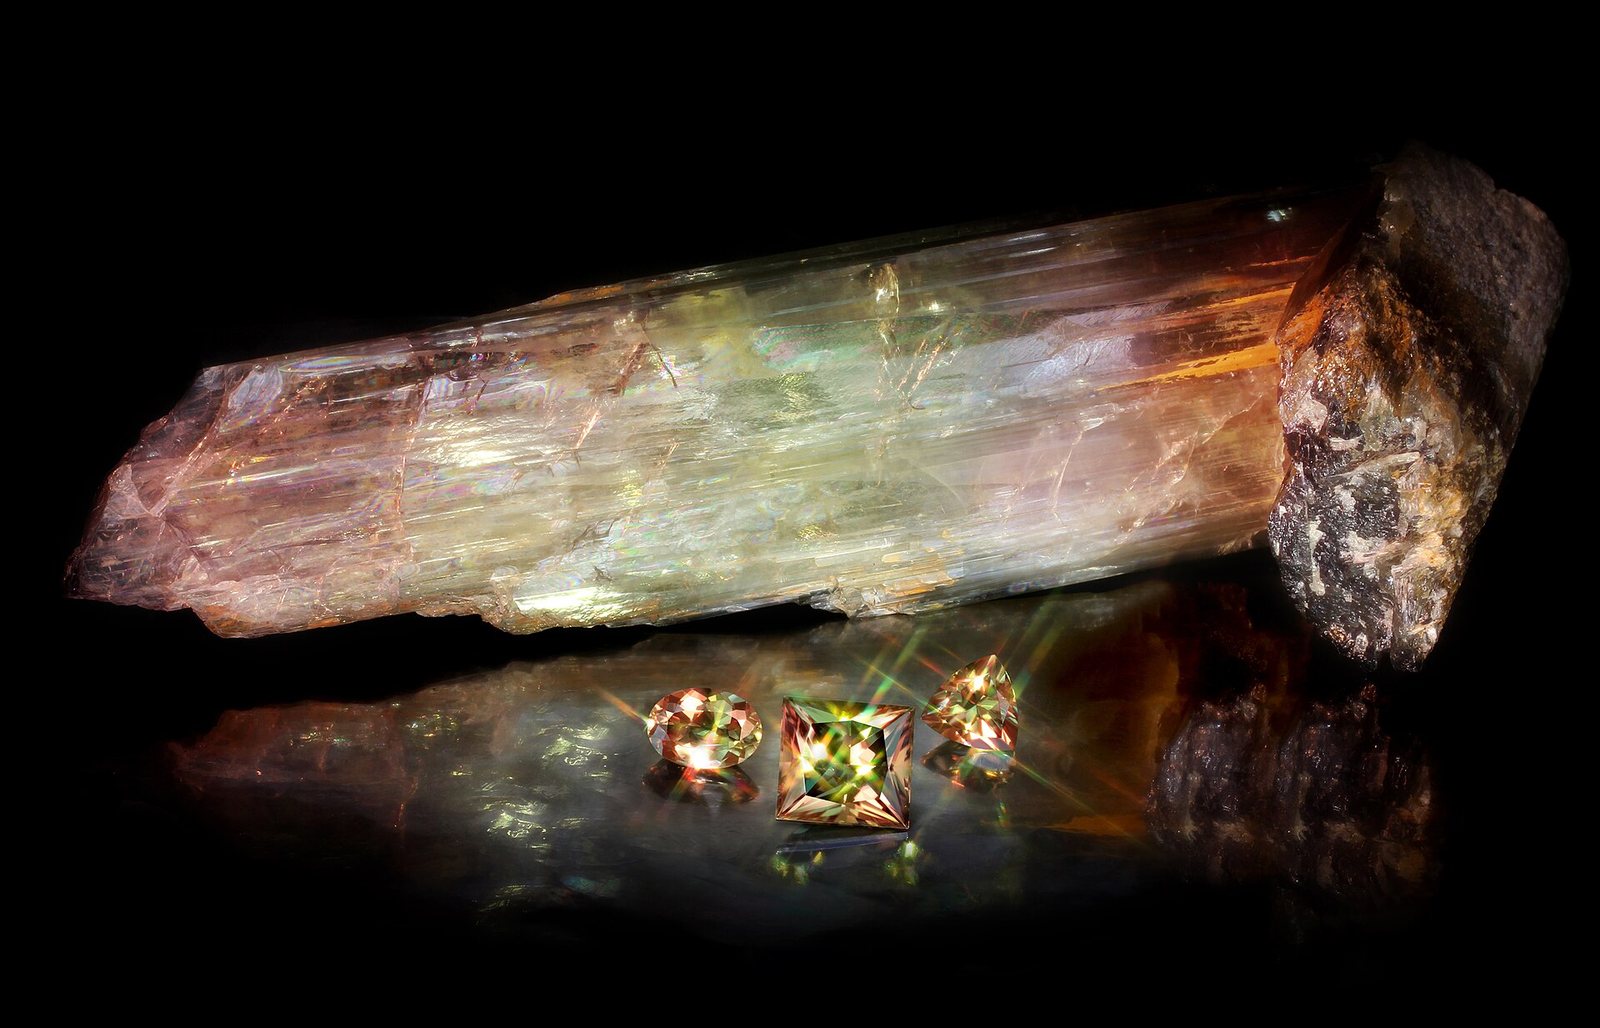
Minerals people want because of how they look — hardness, clarity and colour, priced on rarity rather than on tonnage.
Mengapa ini penting?
Gem mining is unusual in the sector: much of it is artisanal, values per tonne are extreme, and provenance rather than assay determines price.
Where it is in the Earth
A gemstone is a mineral — or occasionally an organic material such as amber or pearl — that combines optical appeal with sufficient hardness to survive cutting and wear. Hardness here has a precise meaning: mineralogists measure it on the Mohs scale, where diamond sits at the top and materials below a certain point scratch too easily to hold a polish in daily use. Colour, transparency and the way a stone bends and splits light (its refractive index and dispersion) determine whether a mineral is worth the lapidary's attention. Rarity then determines whether it is worth the buyer's money.
Most gem minerals form under conditions that are uncommon in the crust. Diamond, for example, crystallises at extreme pressure and temperature deep in ancient, stable continental cores called cratons. It reaches the surface only when a rare, fast-moving magma called kimberlite or lamproite punches upward from depth without giving the diamond time to convert to graphite. The pipe-shaped bodies of kimberlite that remain at the surface — found in Russia, Botswana, Angola, Canada and southern Africa — are therefore the primary targets for diamond exploration. Rubies and sapphires (both varieties of the mineral corundum) form in metamorphic rocks — rocks recrystallised by heat and pressure — or in alkaline igneous intrusions, and tend to concentrate in the alluvial gravels that accumulate as those rocks weather and erode over geological time. Emeralds form in a different setting again, typically where hydrothermal fluids rich in beryllium interact with chromium-bearing schists.
Secondary, or alluvial, deposits matter enormously in gem mining. Weathering liberates hard, chemically resistant stones from their host rock, and rivers and ocean currents sort and concentrate them by density. Namibia's marine diamond deposits, where wave action has winnowed stones along the Atlantic coastline, are a well-known example. These placer deposits are often worked by small operators or individual artisanal miners, because the capital requirement for shallow alluvial digging is far lower than for underground hard-rock mining. The geographic spread of production shown in the table — stretching from Siberia to West Africa to northern Canada — reflects the equally wide spread of the cratons, metamorphic belts and ancient drainage systems that concentrate gem minerals.
Getting it out
Diamond mining, which dominates production by carat volume as the tables show, uses two broad approaches depending on where the stones sit. Open-pit mining — removing rock in a widening, stepped excavation from the surface downward — works well in the early life of a kimberlite pipe, when the orebody is shallow. As the pit deepens, the economics shift, and mines transition to underground methods, driving tunnels to reach ore blocks below. In both cases the proportion of waste rock moved per carat recovered is very large, because even a rich diamond deposit contains only a small weight of diamond per tonne of host rock. The grade — the number of carats found in each tonne of ore — is the single most watched number in diamond mine economics, and grades vary considerably between deposits and even within a single pipe.
Alluvial and marine deposits use different methods. On land, alluvial miners may work river gravels with little more than hand tools and a sieve; this is the characteristic mode of artisanal and small-scale mining that accounts for a meaningful fraction of gem production worldwide, particularly in West and Central Africa. Marine mining off Namibia uses purpose-built vessels that either vacuum sediment from the seafloor or deploy divers with suction hoses in shallow water — an unusual and capital-intensive method justified by the exceptional quality of the stones recovered there. For coloured gemstones — rubies, sapphires, emeralds, tanzanite — underground and artisanal pit methods dominate, often at very small scale in countries such as Tanzania, Zimbabwe and Sierra Leone.
The concept of grade in gem mining carries a complication that does not arise in base-metal or even gold mining. Two deposits with identical carat grades can have vastly different economic values if one produces large, clear, well-coloured stones and the other produces small, included or off-colour material. This is why the tables on this page report production by value rather than by weight alone, and why any carat-weight figure must be read with caution. Moving waste to reach a kimberlite pipe is expensive; moving waste to reach an alluvial deposit that then yields low-quality material can make an operation unviable even if the carat count looks adequate.
What pulls on it
The demand for gemstones is driven by jewellery, which accounts for the overwhelming majority of consumption by value. Unlike most industrial materials, the purchase decision rests on perceived beauty, cultural meaning and social signalling rather than technical specification. Diamonds have historically been associated with engagement rings in Western markets, a pattern that was deliberately cultivated in the twentieth century and became genuinely embedded in consumer expectations. Coloured gemstones — rubies, emeralds, sapphires and a long tail of others — serve similar functions in jewellery but are also prized by collectors who treat fine stones as portable, concentrated stores of aesthetic and monetary value.
Consumer markets in China and India have grown in importance as a share of global demand, and the tastes of buyers in those markets — which have their own long traditions of gem use, often favouring jade, rubies and pearls — influence what qualities and types of stone command premiums. The United States remains a very large consuming market, and the import reliance figure in the data confirms that virtually all gem material consumed in the United States arrives from abroad. Demand is sensitive to general economic confidence, since jewellery is a discretionary purchase, and it is also sensitive to fashion: a stone that falls out of favour in bridal jewellery faces a structural reduction in demand regardless of its intrinsic qualities.
The growth of laboratory-grown diamonds represents a genuine structural shift in one segment of demand. Synthetic stones are chemically and physically identical to mined ones, and as their price has declined they have captured a growing share of the market for smaller, commercial-quality diamonds used in jewellery. Whether this displaces mined diamond demand depends partly on whether consumers come to regard origin — mined versus grown — as a meaningful distinction, and partly on how far prices diverge. For very large, rare, naturally coloured diamonds, the provenance and uniqueness of the stone is itself part of the value, and laboratory production is unlikely to substitute there.
Turning ore into product Tingkat 3
The first task after mining is liberation: separating the gem minerals from the host rock and associated waste. For kimberlite, this begins with crushing — but carefully, since excessive force breaks the very stones being sought. The crushed material is then scrubbed and screened to remove fines, and passed through concentration stages that exploit the high density of diamond relative to most gangue minerals. Dense-media separation (DMS), in which ore is fed into a liquid of controlled density so that heavy minerals sink and lighter waste floats, is the principal workhorse. The DMS concentrate then moves to recovery circuits that use X-ray luminescence — diamonds fluoresce under X-ray — or grease belts, to which diamonds preferentially adhere. Each of these steps has a recovery efficiency below 100 percent, and fine diamonds, those below a few millimetres, are the hardest to recover without loss.
Coloured gemstone processing is far less mechanised. Alluvial gravel is typically washed and hand-sorted, with trained sorters making judgements about which rough pieces warrant cutting. Rough stones are then traded to cutting centres — historically Antwerp, Tel Aviv, Mumbai and Bangkok, though the geography of cutting has shifted considerably toward lower-labour-cost locations — where lapidaries plan the cut to maximise the value of the finished stone. This planning step, deciding which angles to use and how much weight to sacrifice to remove inclusions, is itself a skilled economic decision rather than a purely technical one. The transition from rough to polished involves substantial weight loss: a significant fraction of the rough carat weight ends up as dust and offcuts.
Laboratory-grown diamonds and other synthetic gemstones are produced by two main routes: high-pressure high-temperature (HPHT) synthesis, which replicates the geological conditions of diamond formation, and chemical vapour deposition (CVD), which grows diamond from a carbon-rich gas onto a substrate. Both routes are now capable of producing gem-quality material at large scale. Synthetic stones pass through essentially the same cutting and polishing steps as mined stones. The data block notes laboratory-grown stones as a fast-growing separate market, and the processing economics differ substantially from those of mined diamonds — there is no mining waste, but the energy cost of the growth process is significant.
Substitution and recycling Tingkat 3
Direct substitution in gemstones is constrained by the fact that value is assigned subjectively. A ruby and a synthetic ruby corundum are the same mineral; a natural ruby and a piece of red glass are not. What matters to the buyer determines what substitutes. For industrial applications of diamond — abrasives, cutting tools, drill bits — synthetic diamond has almost entirely replaced mined gem-quality material, and this substitution is essentially complete. The industrial-diamond and gem-diamond markets now operate largely independently. For jewellery, simulants such as cubic zirconia or moissanite can approximate the appearance of diamond at a fraction of the price, but a buyer who cares about the distinction between simulant and diamond is not substituted by one who does not.
Recycling of gemstones does occur, primarily through the resale of jewellery and the re-cutting of stones from antique pieces. Unlike metal recycling, where material is melted and re-refined, gemstone recycling preserves the stone itself — a well-cut diamond removed from one piece of jewellery can be set in another without reprocessing. The volume of stones recirculating through estate sales, auction houses and secondhand jewellers is not trivial, but it is also not systematically captured in production statistics, which record only newly mined material. The practical barrier to higher recycling rates is not technical but economic and logistical: sorting, grading and re-certifying individual stones is labour-intensive, and the provenance and certification of a secondhand stone may not be as well-documented as the buyer requires.
For coloured gemstones, treatment is a form of internal substitution: heat treatment, irradiation, fracture-filling and surface coating can improve the apparent quality of stones that would otherwise sell at lower grades. Treated stones sell for less than untreated equivalents of the same apparent quality, and the disclosure of treatment status is a persistent issue in the trade. The availability of treatments effectively expands the supply of commercially acceptable material from any given deposit without increasing the carat output, and their prevalence means that grading reports from established gemmological laboratories carry significant weight in high-value transactions.
Where the chain is fragile Tingkat 4
The carat-weight figures in the production table are less informative than they appear, and this is the first source of uncertainty worth noting. Because gem value is assessed stone by stone on the basis of colour, clarity, cut and carat weight — the so-called four Cs — a country that produces many thousands of carats of small, included, low-colour diamonds is not comparable to one producing fewer carats of exceptional material. Published statistics aggregate these incomparable populations into a single carat total. Russia dominates the table by volume, with a very large share of world output, and Botswana, Angola and Canada follow; but the value distribution across those countries is not proportional to their carat shares. Reserves figures carry a similar problem: the stated reserve in thousands of carats says nothing about the grade distribution within that reserve or the proportion that would be gem-quality rather than near-gem or industrial material.
Concentration risk in diamonds is high at the mine level. A small number of large kimberlite operations account for a disproportionate share of production by value, and disruption at any of them — whether through geotechnical failure, labour action, flooding or political constraint — moves the market for certain size and quality categories. The by-product structure matters here too: some of the most economically important mines produce a spread of qualities in fixed proportions dictated by geology, not by market demand. An operator cannot choose to produce more large gem-quality stones and fewer industrials; the pipe yields what it yields. For coloured gemstones, the concentration risk is of a different character — artisanal production dominates in many countries, and formalising, taxing or disrupting that production is administratively difficult, making supply statistics unreliable.
Processing and trading bottlenecks sit downstream of mining. The major cutting centres exercise influence over price formation, and the shift of cutting capacity between countries over time reflects labour cost differentials as much as skill. Certification — the issuance of grading reports by independent gemmological laboratories — has become a de facto requirement for high-value transactions, and the capacity and credibility of those institutions is itself a constraint on how quickly a new supply can reach the market in a form that commands full value. The Kimberley Process Certification Scheme, designed to exclude diamonds financing armed conflict, adds a documentation layer that affects the ease with which production from certain jurisdictions enters formal trade channels; its coverage and effectiveness are matters of continuing debate among researchers studying supply-chain transparency.
Siapa yang memproduksinya
Lihat di peta →Mine production
Mine production thousands of carats 2025 (estimasi) Total dunia 69,000 thousands of carats
USGS Mineral Commodity Summaries 2026 · Reported by value, not weight, because carat totals say nothing about worth. · sumber ↗
Gulir tabel ke samping untuk melihat kolom-kolom yang tersisa.
| Negara | Produksi | Pangsa dunia |
|---|---|---|
| Russia | 21,000 | 30.4% |
| Angola | 13,000 | 18.8% |
| Canada | 13,000 | 18.8% |
| Botswana | 13,000 | 18.8% |
| Namibia | 2,300 | 3.3% |
| South Africa | 2,100 | 3.0% |
| Congo (Kinshasa) | 2,000 | 2.9% |
| Lesotho | 700.0 | 1.0% |
| Zimbabwe | 530.0 | 0.8% |
| Sierra Leone | 460.0 | 0.7% |
| Ghana | 330.0 | 0.5% |
| Tanzania | 320.0 | 0.5% |
| Other countries | 320.0 | 0.5% |
| United States | Zero | — |
| Total dunia | 69,000 | 100% |
"Ditahan" berarti USGS menyembunyikan angka tersebut untuk menghindari pengungkapan data perusahaan tertentu — bukan berarti nol. Baris per negara tidak selalu berjumlah sama dengan total dunia karena sumber membulatkan setiap angka secara independen dan tidak selalu merinci baris "negara lain".
Siapa yang memegang cadangan
Reserves
Reserves thousands of carats 2025
USGS Mineral Commodity Summaries 2026 · sumber ↗
| Negara | Cadangan | Pangsa dunia |
|---|---|---|
| Russia | 750,000 | 37.5% |
| Botswana | 250,000 | 12.5% |
| Congo (Kinshasa) | 150,000 | 7.5% |
| Angola | 150,000 | 7.5% |
| Other countries | 120,000 | 6.0% |
| Canada | 110,000 | 5.5% |
| South Africa | 87,000 | 4.3% |
| Zimbabwe | 56,000 | 2.8% |
| United States | Not applicable | — |
| Ghana | Not applicable | — |
| Lesotho | Not applicable | — |
| Namibia | Not applicable | — |
| Sierra Leone | Not applicable | — |
| Tanzania | Not applicable | — |
| Total dunia | >2,000,000 | 100% |
Sumber menerbitkan total dunia ini sebagai batas, bukan angka titik, sehingga pangsa pada kolom terakhir juga merupakan batas.