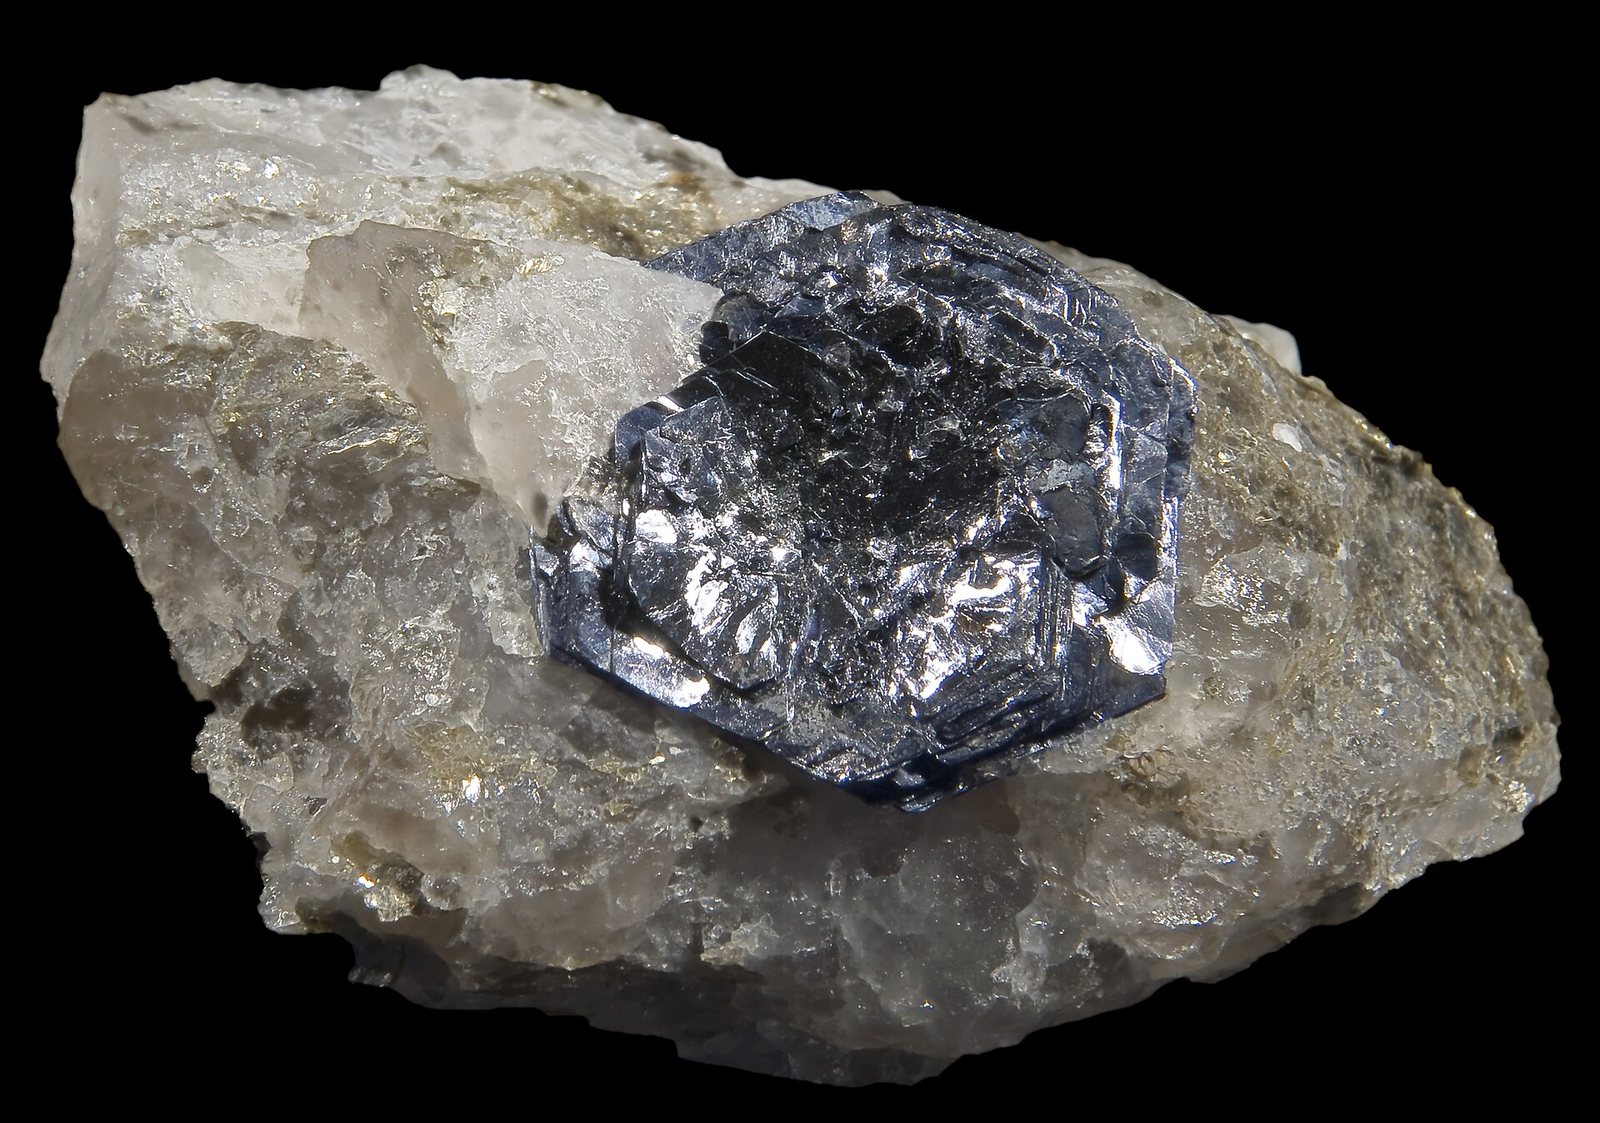
Đây là gì?
A silvery metal added to steel so it keeps its strength at high temperature and under pressure.
Tại sao điều này quan trọng?
Pipeline steel, pressure vessels and reactor internals need molybdenum. Most of it comes up as a by-product of copper porphyry mining.
Các mục viết chuyên sâu hơn cho vật liệu này chưa được công bố. Toàn bộ nội dung dưới đây được lấy trực tiếp từ các bộ dữ liệu nguồn và là đầy đủ.
Nguồn gốc của nó trong đá
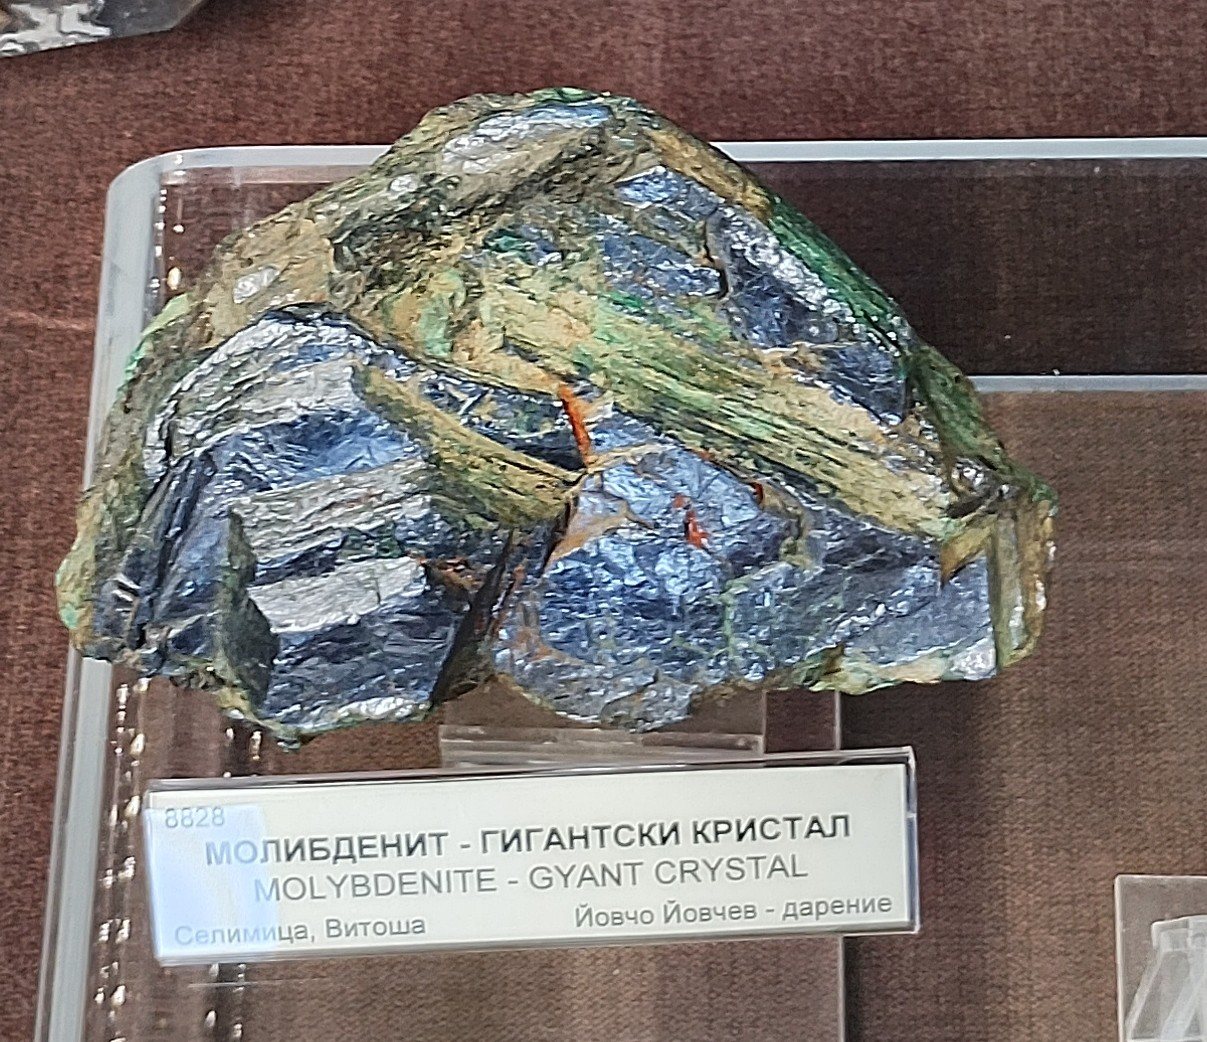
Tất cả khoáng vật quặng →Đây là các khoáng sản thực sự mang lại molybdenum. Một mỏ khoáng chỉ là thân quặng khi một trong số chúng có hàm lượng đủ cao để bù đắp chi phí khai thác.
Ai sản xuất nó
Xem trên bản đồ →Mine production
Mine productionmetric tons 2025 (ước tính) Tổng toàn cầu 260,000 metric tons
USGS Mineral Commodity Summaries 2026 · Mine production of contained molybdenum; a large share is by-product. · nguồn ↗
Cuộn bảng sang ngang để xem các cột còn lại.
| Quốc gia | Sản lượng | Tỷ phần thế giới |
|---|---|---|
| China | 97,000 | 37.3% |
| Chile | 42,000 | 16.2% |
| United States | 40,000 | 15.4% |
| Peru | 39,000 | 15.0% |
| Mexico | 17,000 | 6.5% |
| Armenia | 5,300 | 2.0% |
| Kazakhstan | 4,300 | 1.7% |
| Mongolia | 4,200 | 1.6% |
| Iran | 3,300 | 1.3% |
| Canada | 2,200 | 0.8% |
| Uzbekistan | 2,000 | 0.8% |
| Russia | 1,300 | 0.5% |
| Australia | 1,000 | 0.4% |
| Korea, North | 800.0 | 0.3% |
| Korea, Republic of | 500.0 | 0.2% |
| Other countries | Zero | — |
| Tổng toàn cầu | 260,000 | 100% |
"Withheld" có nghĩa là USGS đã ẩn số liệu để tránh tiết lộ dữ liệu của một công ty riêng lẻ — không có nghĩa là bằng không. Tổng các hàng theo quốc gia không phải lúc nào cũng bằng tổng toàn cầu vì nguồn làm tròn từng số liệu một cách độc lập và không phải lúc nào cũng tách riêng dòng "các quốc gia khác".
Ai nắm giữ trữ lượng
Reserves (thousand metric tons)
Reserves (thousand metric tons)thousand metric tons 2025
USGS Mineral Commodity Summaries 2026 · nguồn ↗
| Quốc gia | Trữ lượng | Tỷ phần thế giới |
|---|---|---|
| China | 7,800 | 45.9% |
| United States | 3,500 | 20.6% |
| Chile | 2,600 | 15.3% |
| Russia | 1,100 | 6.5% |
| Peru | 1,000 | 5.9% |
| Australia | 760.0 | 4.5% |
| Other countries | 150.0 | 0.9% |
| Armenia | 150.0 | 0.9% |
| Mexico | 130.0 | 0.8% |
| Korea, North | 78.00 | 0.5% |
| Canada | 64.00 | 0.4% |
| Iran | 43.00 | 0.3% |
| Uzbekistan | 21.00 | 0.1% |
| Mongolia | 10.00 | 0.1% |
| Korea, Republic of | 8.00 | 0.0% |
| Kazakhstan | 7.00 | 0.0% |
| Tổng toàn cầu | 17,000 | 100% |
Giá
average, dollars per kilogram
Trung bình nămdollars per kilogram
Cơ sở: average, dollars per kilogram. Trung bình năm theo công bố trong USGS Mineral Commodity Summaries 2026 · nguồn ↗. Đây là mức trung bình hàng năm tham khảo, không phải báo giá thị trường trực tiếp.
Các mỏ sản xuất khoáng sản này
Tất cả mỏ →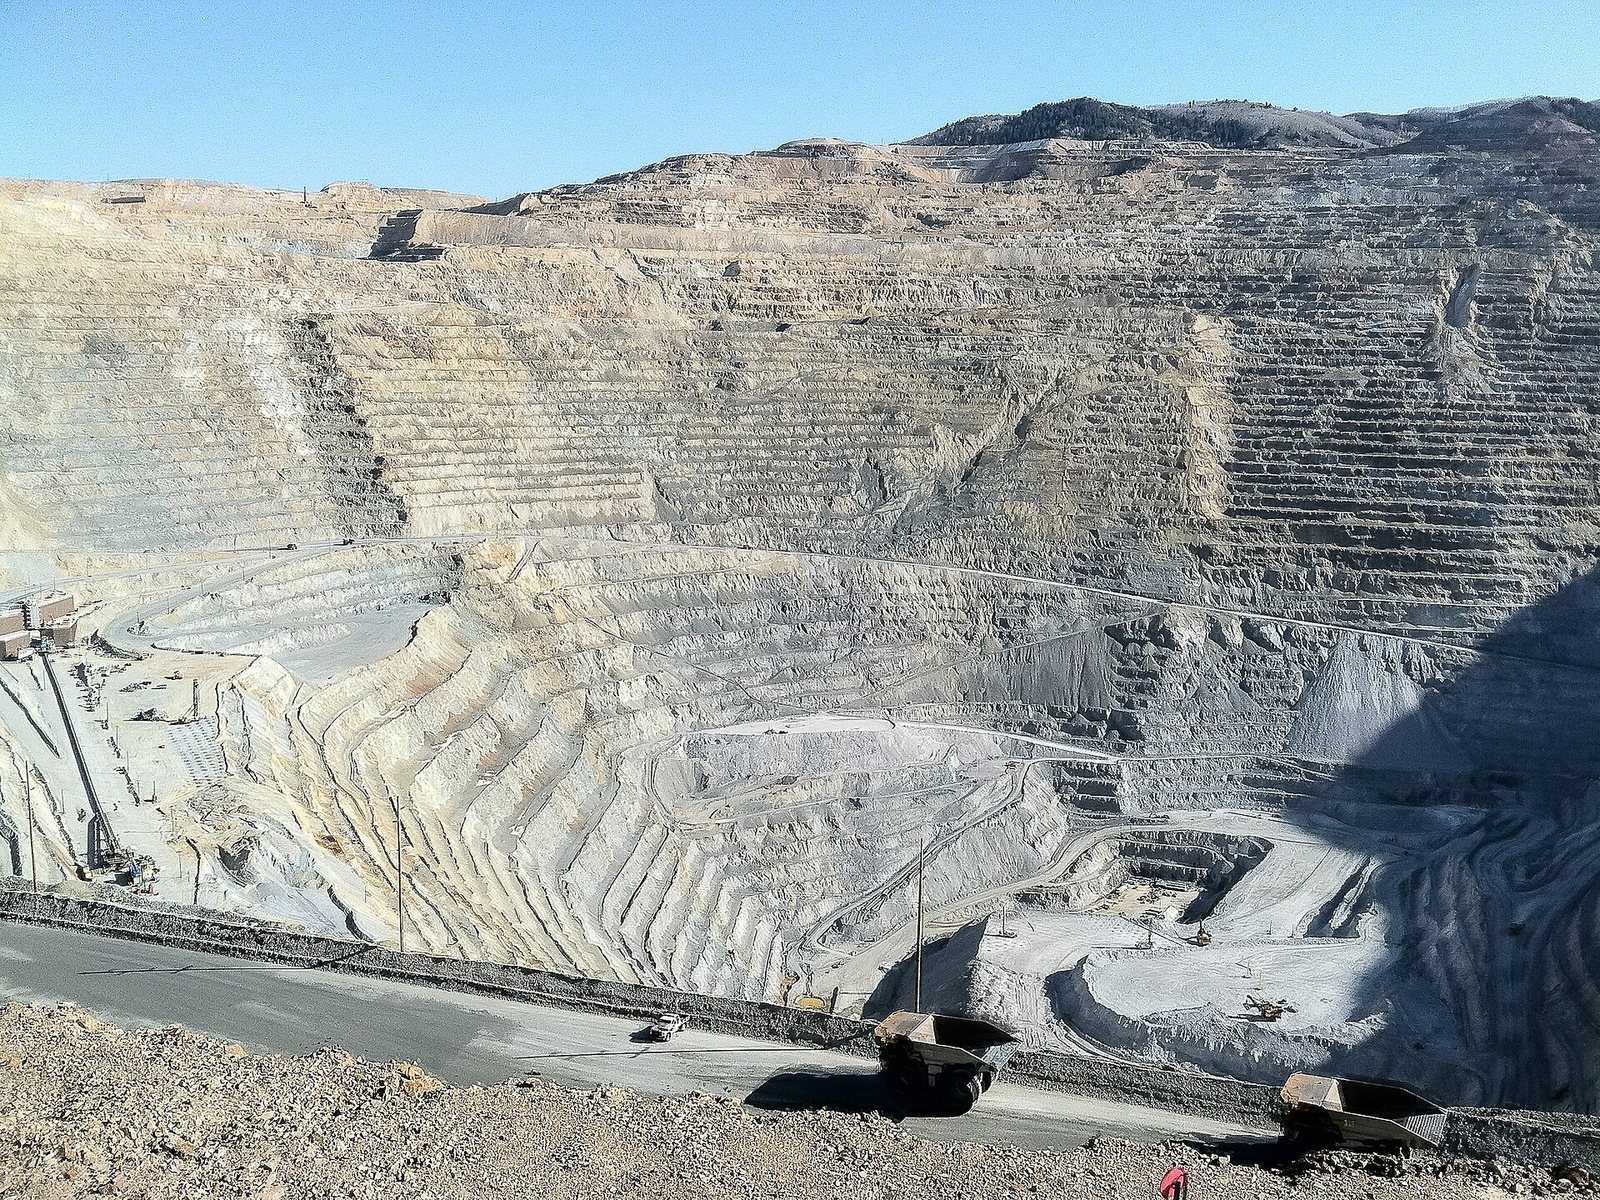
Cerro Verde
One of the largest concentrator complexes in the world by throughput.
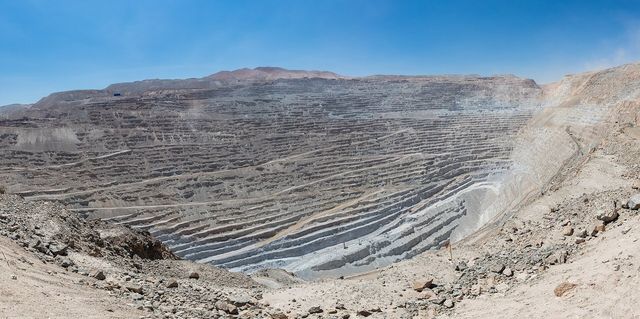
Chuquicamata
Historically the largest open-pit copper mine in the world by excavated volume.
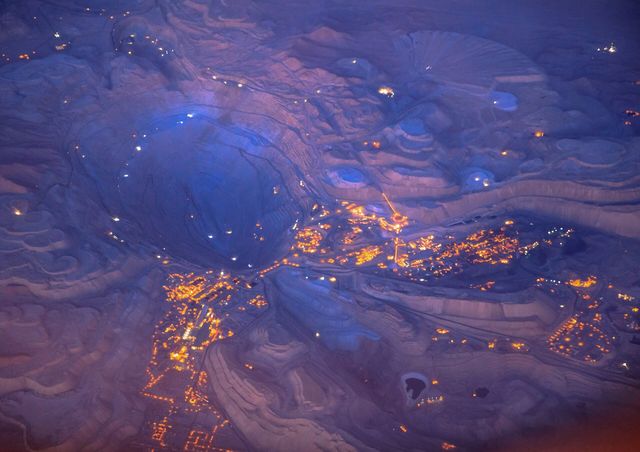
Collahuasi
Among the largest copper mines by output.
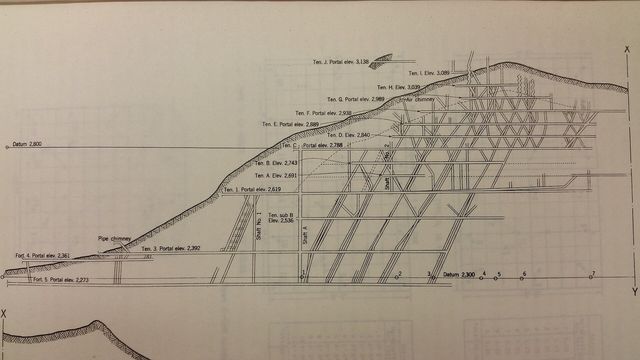
El Teniente
The largest underground copper mine in the world by excavated extent.
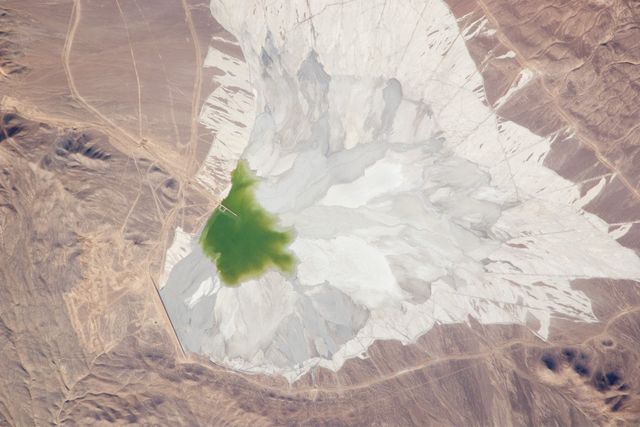
Escondida
Consistently the largest copper mine in the world by output.
Morenci
The largest copper operation in North America.
Kiểm soát xuất khẩu
| Quốc gia | Kiểm soát | Áp dụng cho |
|---|---|---|
| China | Export licensing requirement for materials and technologies | Antimony (2024), bismuth (2025), synthesized diamond (2025), gallium (2023), germanium (2023), graphite (2023), indium (2025), magnesium materials (2024), molybdenum (2025), rare earths (2025), silver (2026), tellurium (2025), tungsten (2025), and items related to lithium batteries and artificial graphite anode materials (2025). ↗ |
USGS Mineral Commodity Summaries 2026, table 4 — controls in effect as of January 2026, excluding controls since lifted.