What is it?
A silvery metal added to steel so it keeps its strength at high temperature and under pressure.
Why does it matter?
Pipeline steel, pressure vessels and reactor internals need molybdenum. Most of it comes up as a by-product of copper porphyry mining.
Where it is in the Earth
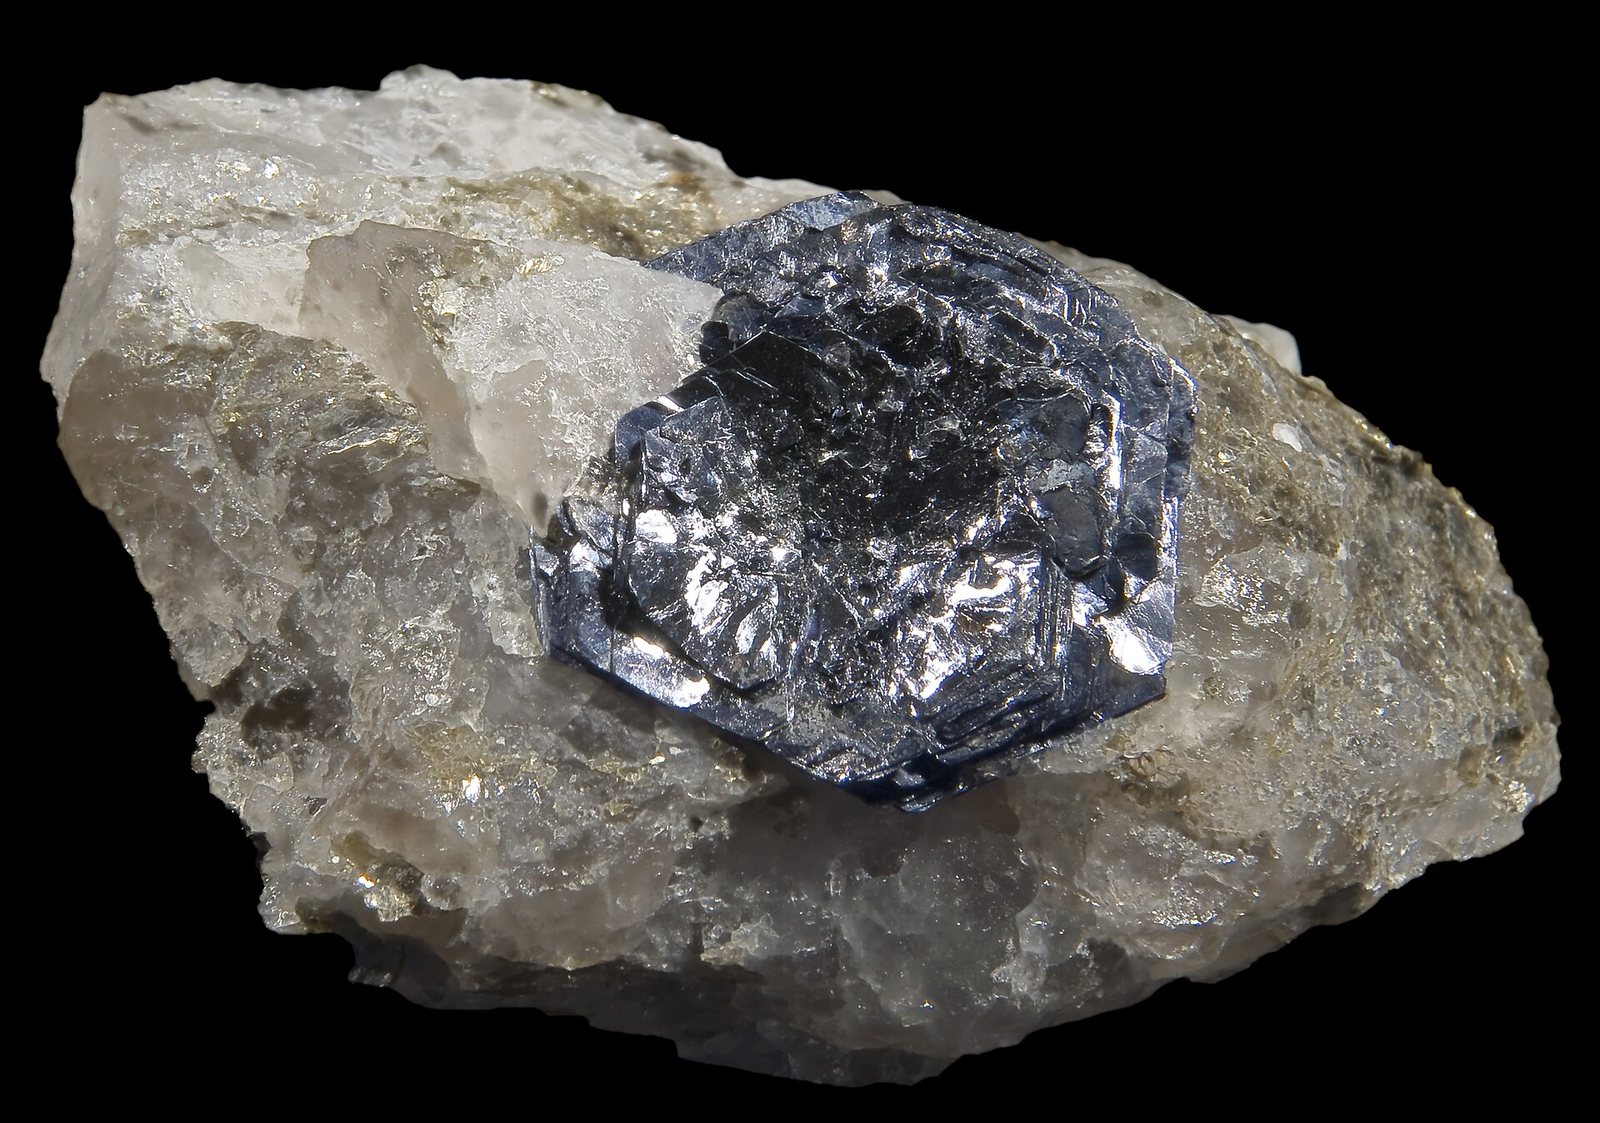
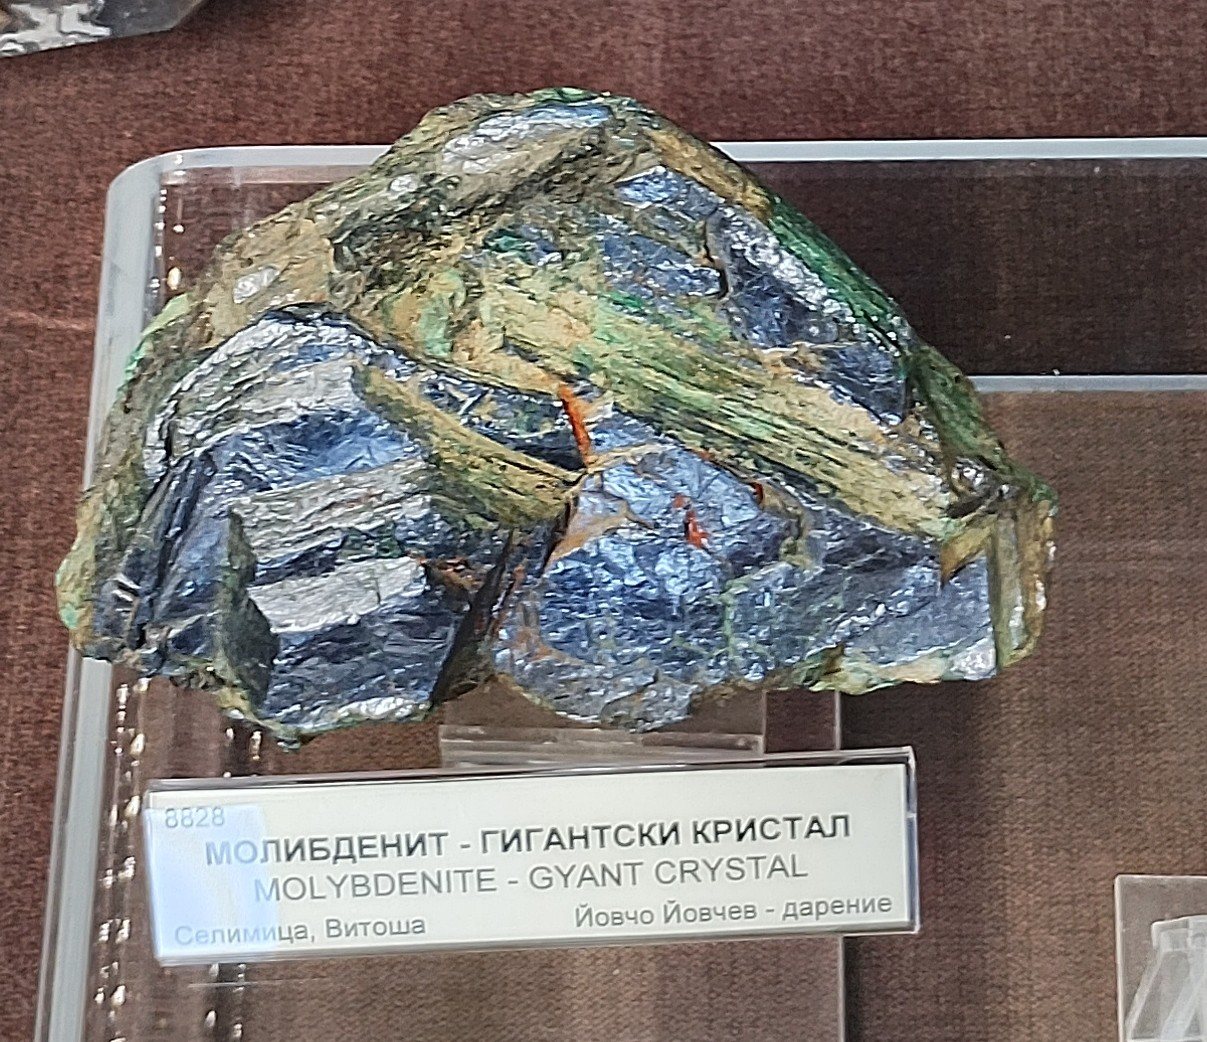
Molybdenum is not scattered evenly through the Earth's crust. It is found in workable concentrations almost exclusively in one family of deposits: porphyry systems, the same large, low-grade bodies that produce the world's copper. A porphyry deposit forms when a column of magma — molten rock — rises slowly through the continental crust and begins to cool. As it does, hot, mineral-laden fluids escape outward into the surrounding rock along fractures, depositing sulfide minerals as they cool and react with the host rock. Molybdenite, the sulfide mineral molybdenum disulfide (MoS₂), crystallises out during this process, typically alongside copper sulfides such as chalcopyrite. The result is a roughly cylindrical or bell-shaped body of rock in which the ore minerals are finely disseminated — spread through the rock in tiny grains rather than gathered in veins — over a volume that can be several kilometres across.
This connection to porphyry copper geology explains the geography of the reserve and production tables on this page. The great porphyry belts of the world run along the margins of tectonic plates where oceanic crust has been pushed beneath continental crust, a process called subduction. The Andes mountain chain is the most productive example, accounting for the large Chilean and Peruvian figures. The western United States sits on a similar geological boundary and hosts substantial resources in states such as Arizona and Utah. China's reserves, the largest in the world at 7,800 thousand metric tonnes, are distributed across several provinces, some in porphyry settings and some in a related deposit type called skarn, where magmatic fluids have reacted with carbonate rocks.
A small number of primary molybdenum deposits — where molybdenite is the main ore mineral rather than a by-product of copper extraction — also exist. These tend to be higher-grade porphyry systems in which copper is absent or uneconomic. Climax-type deposits, named after a historic mine in Colorado, are the best-known example. They form under slightly different magmatic conditions and can carry molybdenum grades meaningfully higher than a typical copper porphyry, though they remain rare. For the most part, the global supply of molybdenum depends on the health and operating decisions of the copper-mining industry, not on dedicated molybdenum projects.
Getting it out
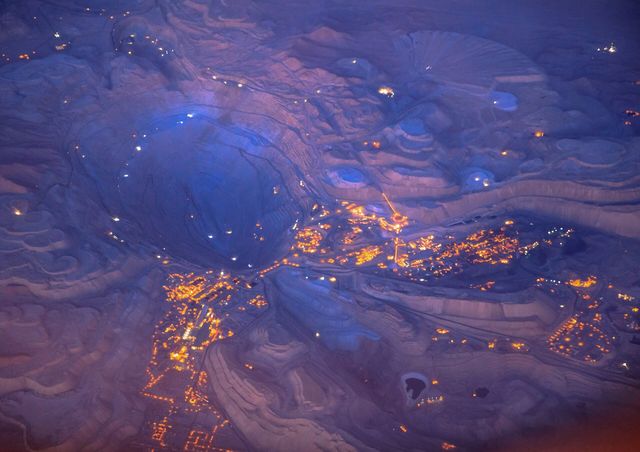
Because porphyry deposits are large and low-grade, the dominant mining method is the open-pit, in which the entire top of a hill or the surface above a buried body is stripped away and the ore blasted loose in a series of descending benches. The economics depend on moving very large volumes of rock: for every tonne of ore that contains useful metal, considerably more waste rock must be shifted simply to expose it. The ratio of waste moved to ore treated — called the strip ratio — varies by deposit but is often several times the ore tonnage. Open pits are therefore capital-intensive undertakings that require heavy equipment, and they make sense only when ore bodies are wide enough and shallow enough to reach economically from the surface.
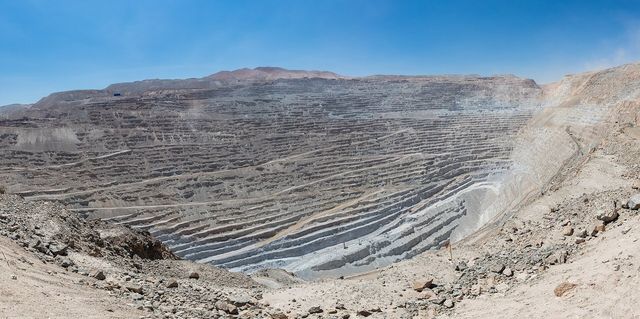
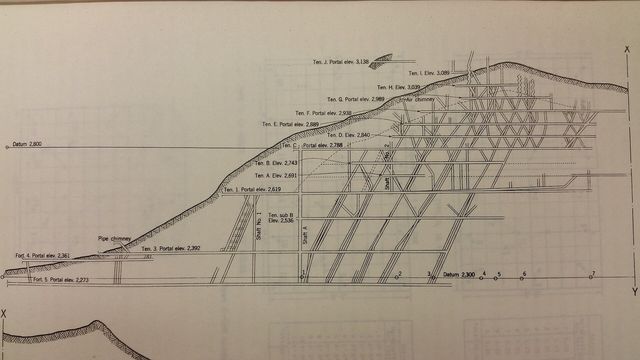
Several mines in the production table have gone underground over time, or were always underground, because their ore bodies extend too deep for an open pit to follow economically. El Teniente in Chile, operated by Codelco, is the world's largest underground copper mine and extracts molybdenum as a by-product using a method called block caving, in which undercut rock collapses under its own weight into collection tunnels below. Chuquicamata, also operated by Codelco, completed a conversion from open pit to underground block cave in recent years as its pit deepened beyond the practical limit. These conversions are technically complex and expensive but allow very large, deep ore bodies to continue producing.
Grade — the concentration of a useful mineral in ore — matters enormously to the economics of molybdenum recovery, but for by-product production it works differently than for a primary metal. A copper miner is chiefly concerned with copper grade; the molybdenum grade is secondary. If molybdenum grades are low, or if market conditions make its recovery uneconomic, an operator may choose not to process the molybdenite at all, simply allowing it to pass through as a waste constituent. This means reported molybdenum output from a copper mine can vary not only with ore grade but with deliberate operating decisions, which makes year-to-year supply somewhat more variable than the underlying geology would suggest.
What pulls on it
The single largest use of molybdenum is as an alloying addition to steel. When added even in small quantities, molybdenum raises the temperature at which steel begins to soften and lose strength, improves its resistance to corrosion, and helps it retain toughness at low temperatures. These properties are not incidental — they are the reason molybdenum-bearing steel grades are specified for applications where plain carbon steel would fail. High-pressure pipelines carrying oil, gas, or steam; pressure vessels in refineries and chemical plants; reactor vessels in power stations; and structural components in offshore platforms and subsea equipment all depend on steel formulated with molybdenum. The end-markets table on this page shows how the demand is distributed, but the underlying logic is that anywhere temperatures, pressures, or corrosive conditions exceed what plain steel can tolerate, molybdenum tends to appear in the specification.
Stainless steel is a second large category. The most widely used stainless grades — the 316 family — contain molybdenum to resist pitting corrosion, particularly in chloride environments such as seawater and food-processing equipment. Superalloys, which are high-performance nickel- or cobalt-base alloys used in jet-engine turbine components, also require molybdenum, though the volumes involved are smaller. Beyond metals, molybdenum compounds serve as catalysts in oil refining, particularly in the hydrotreating process that removes sulfur from fuels to meet emissions standards. Chemical uses also include molybdenum-based lubricants and pigments, though these are small fractions of overall demand.
Demand would shift sharply if the mix of infrastructure investment changed markedly. A sustained decline in oil-and-gas pipeline construction would reduce consumption of high-strength pipe steel. Conversely, growth in chemical processing capacity, nuclear power, or offshore energy development tends to support demand. The link to copper-porphyry mining means supply and demand can move in the same direction during broad economic cycles, which moderates price swings to some degree but does not eliminate them; the price history on this page shows meaningful variation from year to year across the period shown.
Where it comes from in the rock
All ore minerals →These are the minerals that actually carry molybdenum. A deposit is only an orebody if one of them is concentrated enough to pay for digging it up.
Who produces it
See it on a map →Mine production
Mine productionmetric tons 2025 (estimated) World total 260,000 metric tons
USGS Mineral Commodity Summaries 2026 · Mine production of contained molybdenum; a large share is by-product. · source ↗
Scroll the table sideways for the remaining columns.
| Country | Production | Share of world |
|---|---|---|
| China | 97,000 | 37.3% |
| Chile | 42,000 | 16.2% |
| United States | 40,000 | 15.4% |
| Peru | 39,000 | 15.0% |
| Mexico | 17,000 | 6.5% |
| Armenia | 5,300 | 2.0% |
| Kazakhstan | 4,300 | 1.7% |
| Mongolia | 4,200 | 1.6% |
| Iran | 3,300 | 1.3% |
| Canada | 2,200 | 0.8% |
| Uzbekistan | 2,000 | 0.8% |
| Russia | 1,300 | 0.5% |
| Australia | 1,000 | 0.4% |
| Korea, North | 800.0 | 0.3% |
| Korea, Republic of | 500.0 | 0.2% |
| Other countries | Zero | — |
| World total | 260,000 | 100% |
“Withheld” means the USGS suppressed the figure to avoid disclosing an individual company's data — it does not mean zero. Country rows do not always sum to the world total because the source rounds each figure independently and does not always break out an “other countries” line.
Who holds the reserves
Reserves (thousand metric tons)
Reserves (thousand metric tons)thousand metric tons 2025
USGS Mineral Commodity Summaries 2026 · source ↗
| Country | Reserves | Share of world |
|---|---|---|
| China | 7,800 | 45.9% |
| United States | 3,500 | 20.6% |
| Chile | 2,600 | 15.3% |
| Russia | 1,100 | 6.5% |
| Peru | 1,000 | 5.9% |
| Australia | 760.0 | 4.5% |
| Other countries | 150.0 | 0.9% |
| Armenia | 150.0 | 0.9% |
| Mexico | 130.0 | 0.8% |
| Korea, North | 78.00 | 0.5% |
| Canada | 64.00 | 0.4% |
| Iran | 43.00 | 0.3% |
| Uzbekistan | 21.00 | 0.1% |
| Mongolia | 10.00 | 0.1% |
| Korea, Republic of | 8.00 | 0.0% |
| Kazakhstan | 7.00 | 0.0% |
| World total | 17,000 | 100% |
Price
average, dollars per kilogram
Annual averagedollars per kilogram
Basis: average, dollars per kilogram. Annual averages as published in USGS Mineral Commodity Summaries 2026 · source ↗. These are reference annual averages, not a live market quote.
Mines that produce it
All mines →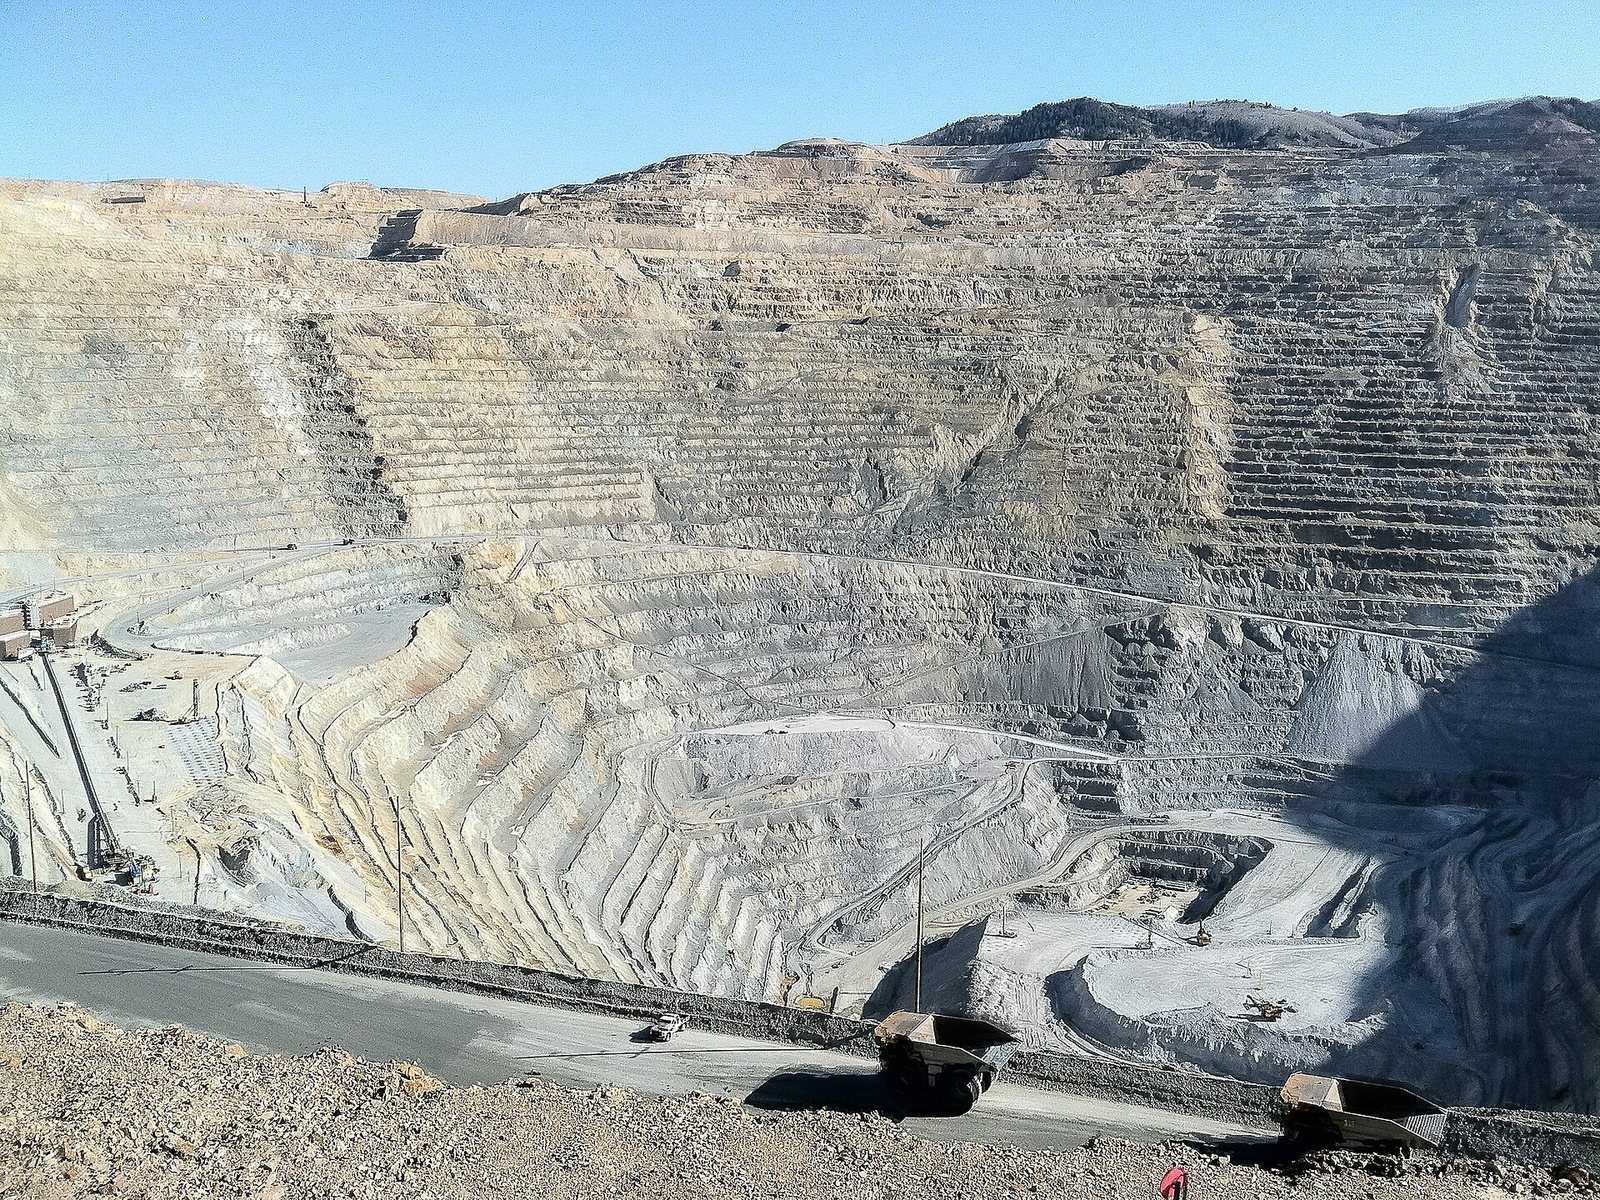

Cerro Verde
One of the largest concentrator complexes in the world by throughput.
Chuquicamata
Historically the largest open-pit copper mine in the world by excavated volume.
Collahuasi
Among the largest copper mines by output.
El Teniente
The largest underground copper mine in the world by excavated extent.
Escondida
Consistently the largest copper mine in the world by output.
Morenci
The largest copper operation in North America.
Export controls
| Country | Control | Applies to |
|---|---|---|
| China | Export licensing requirement for materials and technologies | Antimony (2024), bismuth (2025), synthesized diamond (2025), gallium (2023), germanium (2023), graphite (2023), indium (2025), magnesium materials (2024), molybdenum (2025), rare earths (2025), silver (2026), tellurium (2025), tungsten (2025), and items related to lithium batteries and artificial graphite anode materials (2025). ↗ |
USGS Mineral Commodity Summaries 2026, table 4 — controls in effect as of January 2026, excluding controls since lifted.