
What is it?
A metal that makes steel much stronger when added in tiny amounts — a few hundred grams per tonne changes the whole alloy.
Why does it matter?
High-strength low-alloy steel with niobium lets pipelines, bridges and car bodies use less metal for the same strength. It is also the superconductor in MRI magnets.
Where it is in the Earth
Niobium is not found in the ordinary run of crustal rocks in useful concentrations. It becomes mineable only where particular geological processes have sorted and enriched it over immense stretches of time. The most important of these processes involves carbonatites — unusual igneous rocks that are essentially solidified carbonate magma, related to the same deep mantle sources that produce kimberlites. As a carbonatite intrusion cools and reacts with groundwater over millions of years, niobium, which does not fit easily into the crystal structures of common silicate minerals, becomes progressively concentrated into the mineral pyrochlore. Pyrochlore is a complex oxide that forms the principal ore of niobium in all of the world's major deposits.
The geography of this process explains why the production and reserve tables look the way they do. The Brazilian state of Minas Gerais sits atop one of the largest and richest carbonatite complexes on Earth, and the reserves figure for Brazil dwarfs every other country in the table by a very wide margin. Canada's deposits, also carbonatite-hosted, represent a distant second. China's reserves are substantial on paper, though much of the Chinese resource is tied up in the Bayan Obo deposit in Inner Mongolia, which is primarily mined for iron ore and rare-earth elements, with niobium present as a secondary component rather than the target mineral. The geological setting at Bayan Obo — a carbonatite-influenced sedimentary sequence — is less straightforward than the Brazilian case, which affects how cleanly the niobium can be recovered.
A secondary source of niobium comes from columbite-tantalite, commonly called coltan, an oxide mineral found in granitic pegmatites — coarse-grained veins that form late in the crystallisation of granite intrusions. Pegmatites concentrate elements that were left behind as the main granite solidified, including niobium, tantalum, and tin. These deposits tend to be smaller and more scattered than carbonatites, and they account for the modest production figures from Congo (Kinshasa), Rwanda, and similar countries. In a columbite-tantalite ore, niobium and tantalum occur together in variable proportions, which matters enormously for processing and pricing, since the two elements behave chemically alike but serve quite different end markets.
Getting it out
The large Brazilian carbonatite deposits are mined by open-pit methods. The ore body is broad, relatively shallow, and geologically consistent, which suits open-pit extraction well. Material is drilled and blasted, then loaded by large shovels or excavators into haul trucks that carry it to a crusher. The ratio of waste rock to ore — the strip ratio — varies by deposit, but carbonatite-hosted niobium ores are unusual in that the carbonatite itself is effectively the ore zone, meaning the boundary between ore and waste is defined by grade rather than by a sharp geological contact. Because niobium is present in pyrochlore at concentrations that are low by the standards of most metals, very large volumes of rock must move to produce a relatively small mass of niobium.
The coltan deposits of central Africa are worked very differently. Artisanal and small-scale miners use hand tools, sluices, and simple gravity separation in stream sediments and eluvial soils — material that has weathered out of the original pegmatite and been carried a short distance downslope. This requires almost no capital equipment, which is why production continues from countries with limited formal mining infrastructure, but it also means recovery is incomplete and output is highly variable. The grade of these materials, expressed as the proportion of niobium and tantalum oxides in the concentrate, fluctuates considerably depending on the source.
Canada's Niobec mine, the country's principal niobium operation, is an underground mine, because the ore body there is a roughly vertical carbonatite pipe that does not lend itself to open-pit extraction at depth. Underground mining costs more per tonne of rock moved than open-pit work, but the higher grade of the ore and the geometry of the deposit make it economical. The Bayan Obo operation in China is open-pit but is run primarily as an iron-ore mine; niobium recovery there is a subordinate objective, which shapes both the method and the economics in ways that are quite different from a dedicated niobium operation.
What pulls on it
The steel industry accounts for the great majority of niobium consumption, and the mechanism is straightforward. Adding a small quantity of niobium to steel — the definition given on this page puts it at a few hundred grams per tonne — produces a high-strength low-alloy steel, usually abbreviated HSLA. The niobium refines the grain structure of the steel during hot rolling, producing a finer, more uniform microstructure that is significantly stronger and tougher than plain carbon steel of the same weight. Because the steelmaker can reach a given strength specification with less total steel, a car body panel or a pipeline wall can be made thinner, reducing the total mass of metal used. The economics are compelling: the cost of the niobium addition is small relative to the savings in steel tonnage and, in applications like vehicles, the fuel savings over the life of the product.
Demand for HSLA steel tends to track infrastructure investment, automotive production, and energy infrastructure. Pipelines for oil and gas transmission, structural sections for bridges and buildings, and the body-in-white of passenger cars are the main end uses. The automotive sector's gradual shift toward electric vehicles does not remove niobium from the demand picture, because the structural body of a battery-electric vehicle still requires high-strength steel, and the battery enclosure itself may also benefit from HSLA grades. Whether overall steel demand in any given country grows or contracts depends on economic conditions that are well outside niobium's own supply story.
The superconductor market, while much smaller in volume than steel, is the application where niobium commands the most attention in medical and scientific contexts. MRI scanners use coils of niobium-titanium wire cooled to near absolute zero, at which point the wire carries electrical current with no resistance, generating the intense magnetic fields the scanner requires. This market is relatively stable, tied to the pace of MRI equipment installation globally, and it is served by high-purity niobium processed to a specification that ferroniobium cannot meet. A sharp change in overall niobium demand would most plausibly come from a sustained shift in steel production methods, a major change in automotive lightweighting strategy, or a step change in how superconducting magnets are built — none of which is determined by niobium supply alone.
Where it comes from in the rock
All ore minerals →These are the minerals that actually carry niobium. A deposit is only an orebody if one of them is concentrated enough to pay for digging it up.
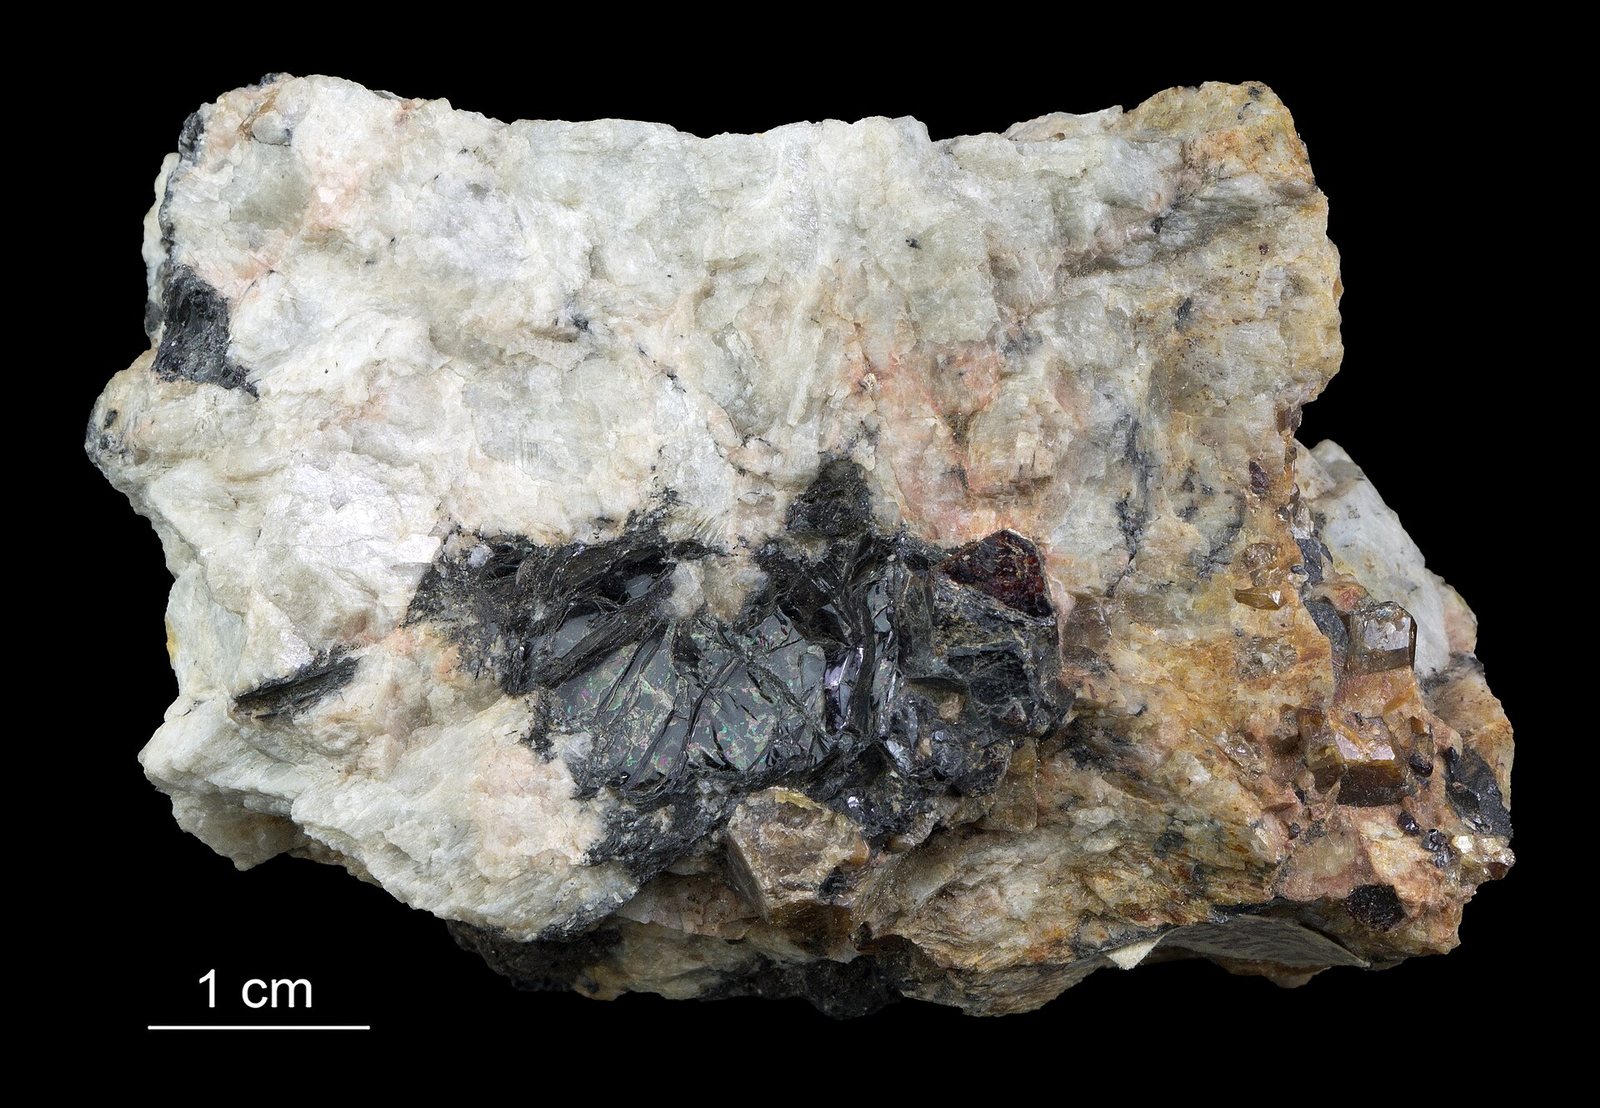
Pyrochlore
The niobium mineral of carbonatite deposits, and the reason niobium supply is so geographically concentrated.
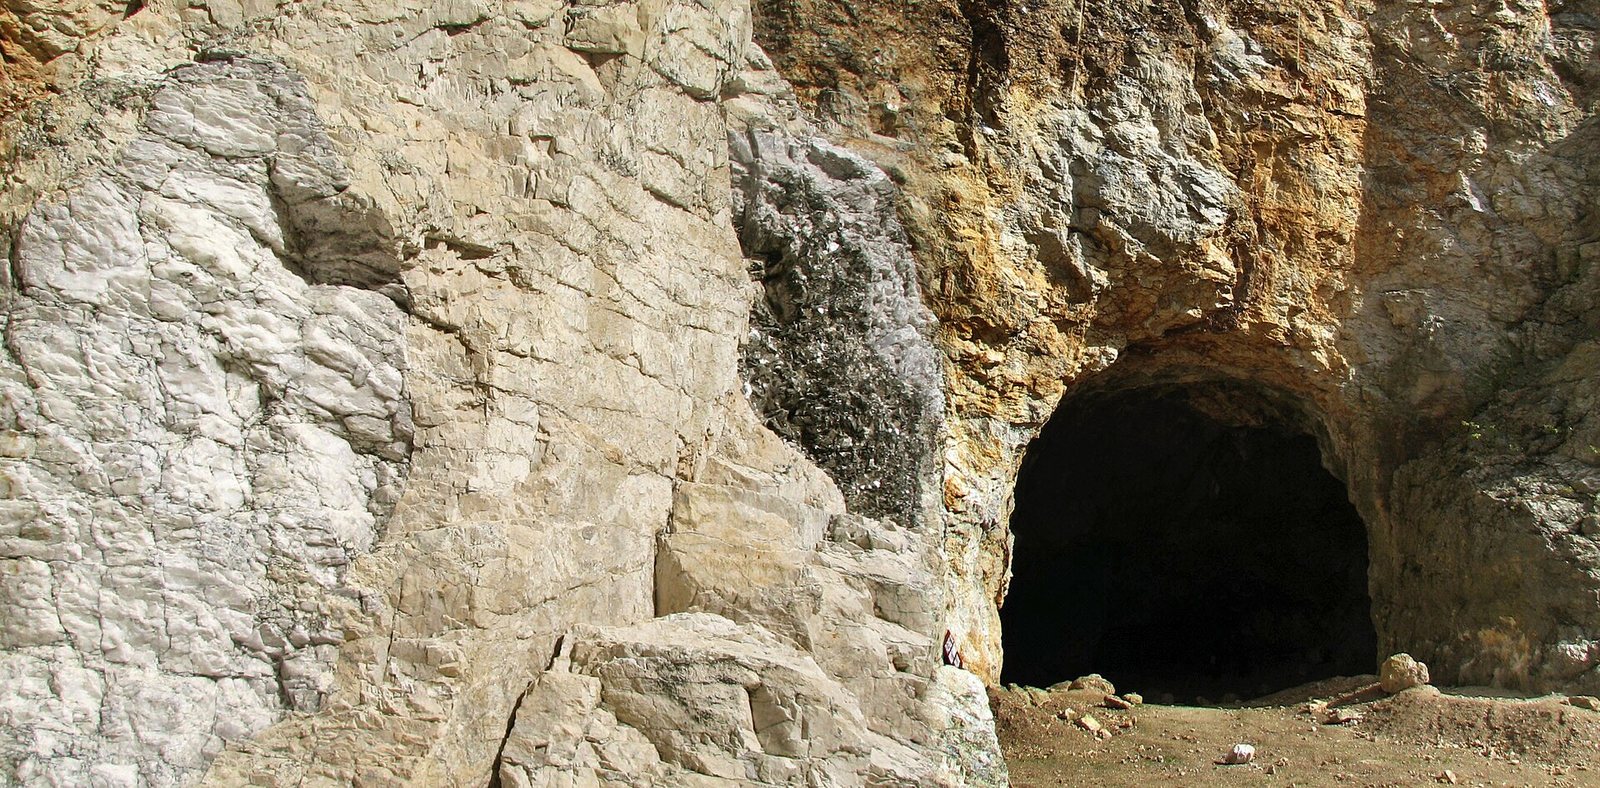
Columbite-Tantalite (coltan)
A solid-solution series: niobium-rich at one end, tantalum-rich at the other. Source of both metals, and a designated…
Who produces it
See it on a map →Mine production
Mine productionmetric tons 2025 (estimated) World total 112,000 metric tons
USGS Mineral Commodity Summaries 2026 · Mine production of contained niobium; supply is unusually concentrated in a single country. · source ↗
Scroll the table sideways for the remaining columns.
| Country | Production | Share of world |
|---|---|---|
| Brazil | 104,000 | 92.9% |
| Canada | 6,000 | 5.4% |
| Congo (Kinshasa) | 970.0 | 0.9% |
| Russia | 300.0 | 0.3% |
| Rwanda | 200.0 | 0.2% |
| Other countries | 120.0 | 0.1% |
| China | 40.00 | 0.0% |
| United States | Zero | — |
| World total | 112,000 | 100% |
“Withheld” means the USGS suppressed the figure to avoid disclosing an individual company's data — it does not mean zero. Country rows do not always sum to the world total because the source rounds each figure independently and does not always break out an “other countries” line.
Who holds the reserves
Reserves
Reservesmetric tons 2025
USGS Mineral Commodity Summaries 2026 · source ↗
| Country | Reserves | Share of world |
|---|---|---|
| Brazil | 14,000,000 | 66.7% |
| China | 6,500,000 | 31.0% |
| Canada | 640,000 | 3.0% |
| United States | 210,000 | 1.0% |
| Russia | 3,000 | 0.0% |
| Congo (Kinshasa) | Not applicable | — |
| Rwanda | Not applicable | — |
| Other countries | Not applicable | — |
| World total | >21,000,000 | 100% |
The source publishes this world total as a bound rather than a point figure, so the shares in the last column are themselves bounds.
Price
average unit value, ferroniobium, dollars per kilogram
Annual averagedollars per kilogram
Basis: average unit value, ferroniobium, dollars per kilogram. Annual averages as published in USGS Mineral Commodity Summaries 2026 · source ↗. These are reference annual averages, not a live market quote.
Mines that produce it
All mines →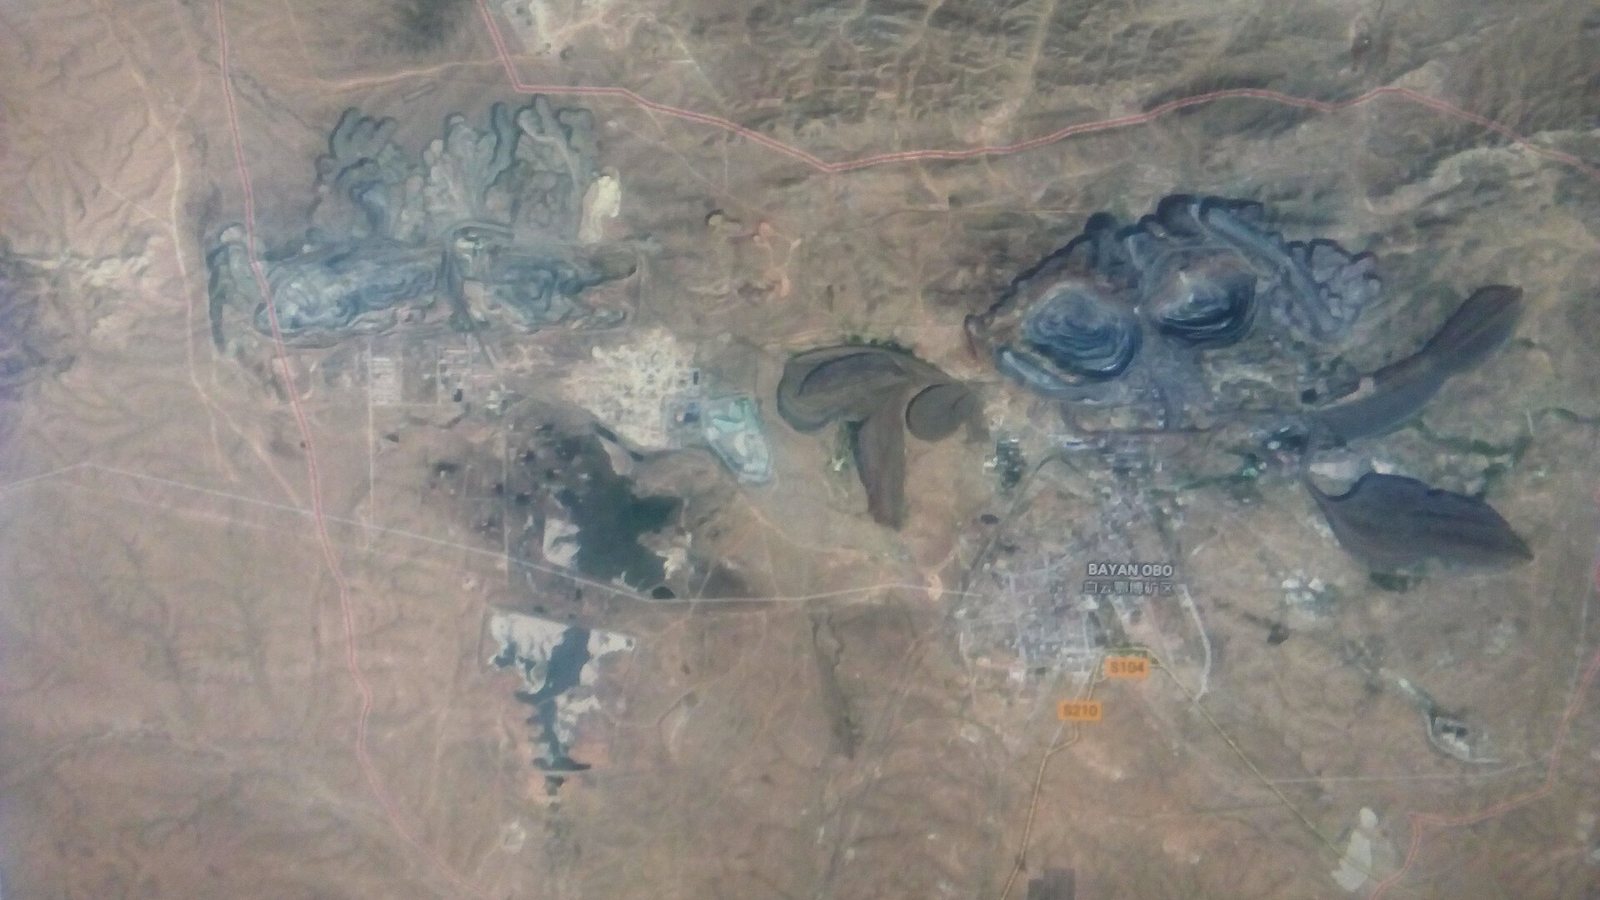
What it is used for
All end markets →| End market | What it does there | Importance |
|---|---|---|
| Medicine & Health | Superconducting MRI wire | Defining |
| Construction & Steel | High-strength low-alloy steel | Important |