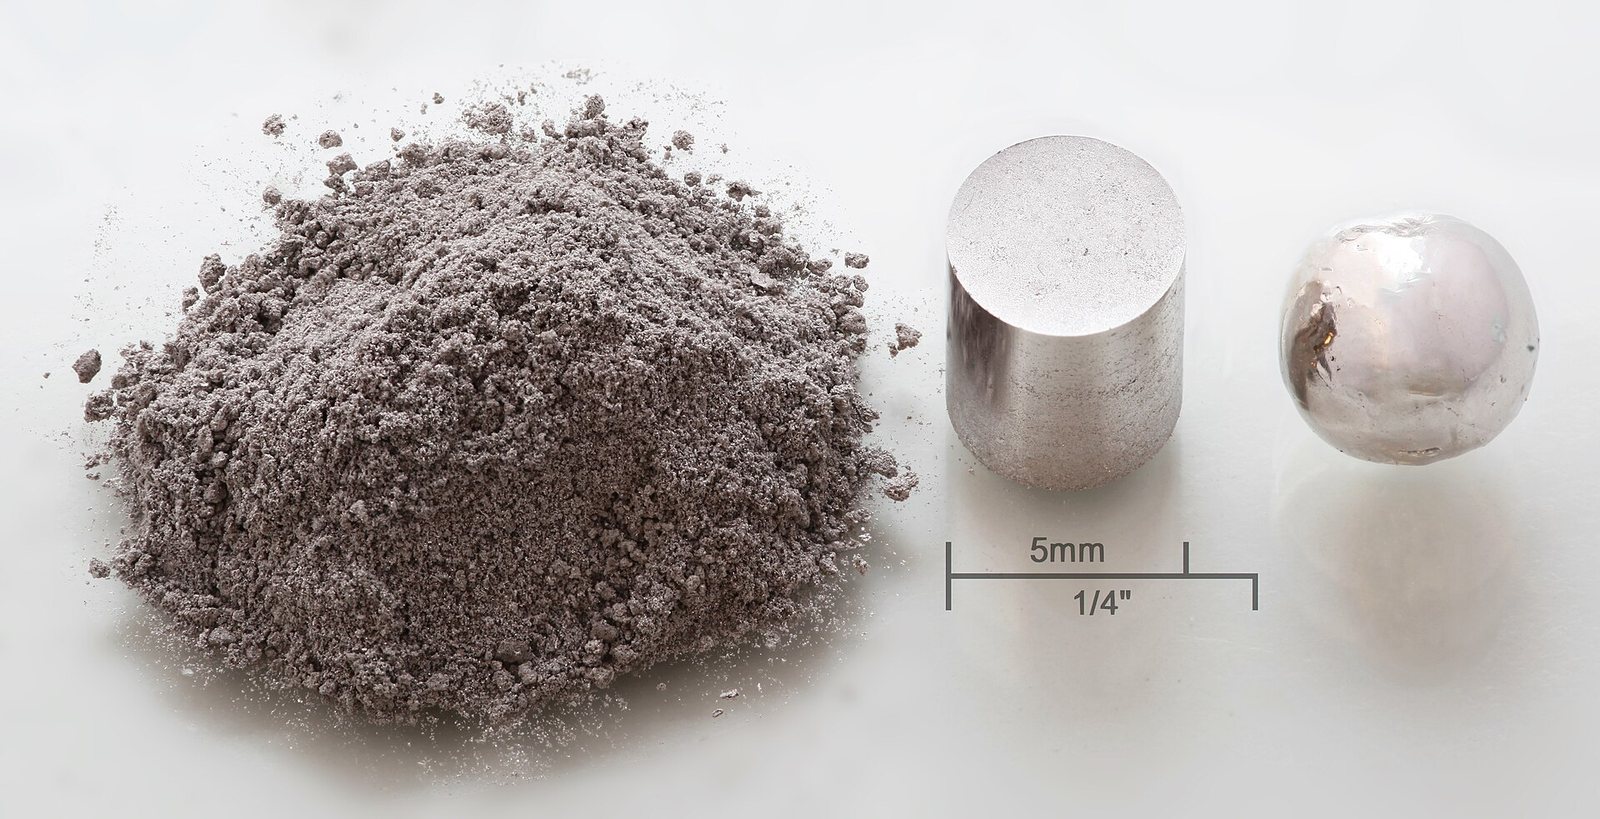
What is it?
The rarest of the metals traded in any volume, produced in tens of tonnes a year, and the only practical way to strip nitrogen oxides from petrol exhaust.
Why does it matter?
Rhodium's price history is the clearest illustration in any commodity of what happens when demand is inelastic and supply is a by-product.
Deeper written sections for this material have not been published yet. Everything below is drawn straight from the source datasets and is complete.
Price
dollars per troy ounce: Rhodium
Annual averagedollars per troy ounce
Basis: dollars per troy ounce: Rhodium. Annual averages as published in USGS Mineral Commodity Summaries 2026 · source ↗. These are reference annual averages, not a live market quote.
Mines that produce it
All mines →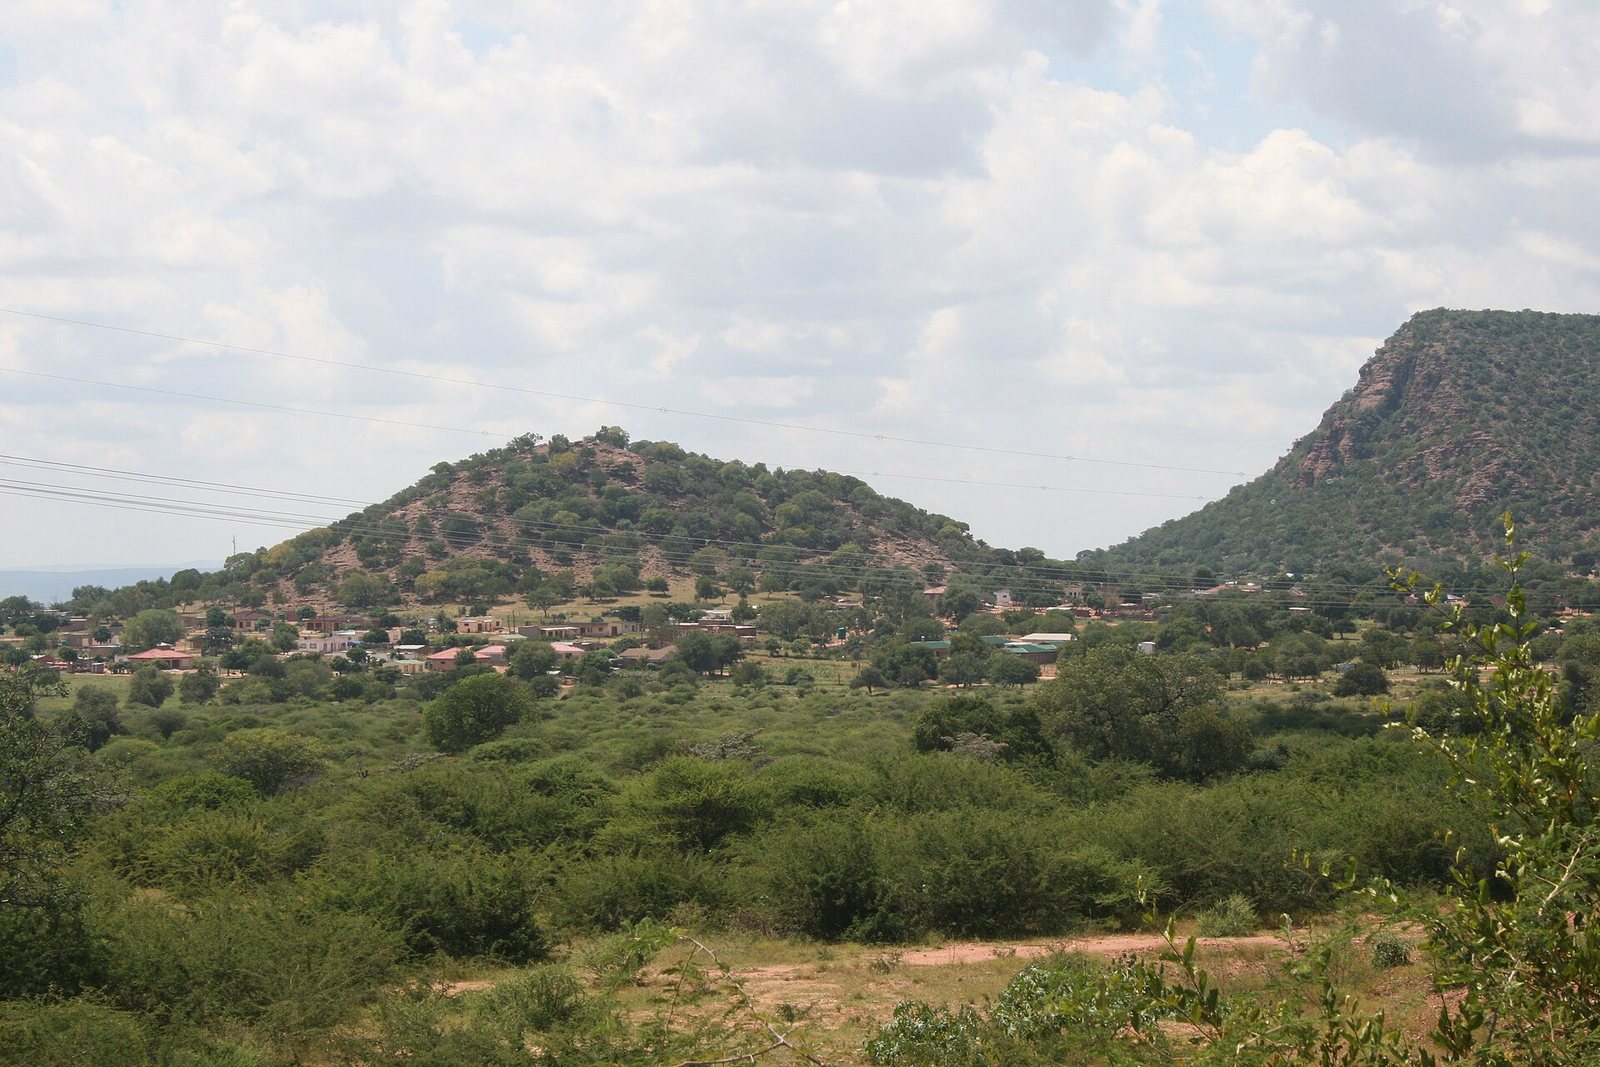
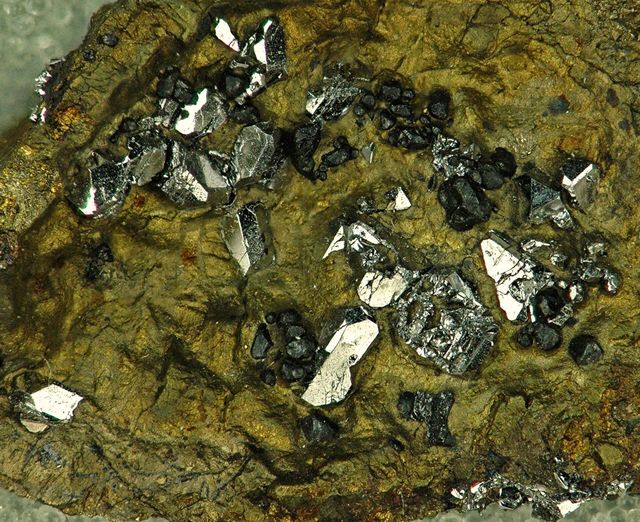
Where it is processed and refined
| Plant | Kind | Stage | Country | Role |
|---|---|---|---|---|
| Rustenburg Base & Precious Metals Refineries | Refinery | Refining | South Africa | Output |
How much of it a technology needs
| Technology | Quantity | Quoted | Basis |
|---|---|---|---|
| Three-Way Catalytic Converter No practical substitute. | 0.0002–0.001 kg | per vehicle | Nitrogen-oxide reduction |
Indicative range compiled from published technology studies and chemistry; verify against a manufacturer specification before use. Run these numbers at any scale in the material calculator →
Export controls
| Country | Control | Applies to |
|---|---|---|
| Venezuela | Export ban | Bauxite, cassiterite, columbite-tantalite, copper, gold, rhodium, silver, and thorium (2024). ↗ |
USGS Mineral Commodity Summaries 2026, table 4 — controls in effect as of January 2026, excluding controls since lifted.