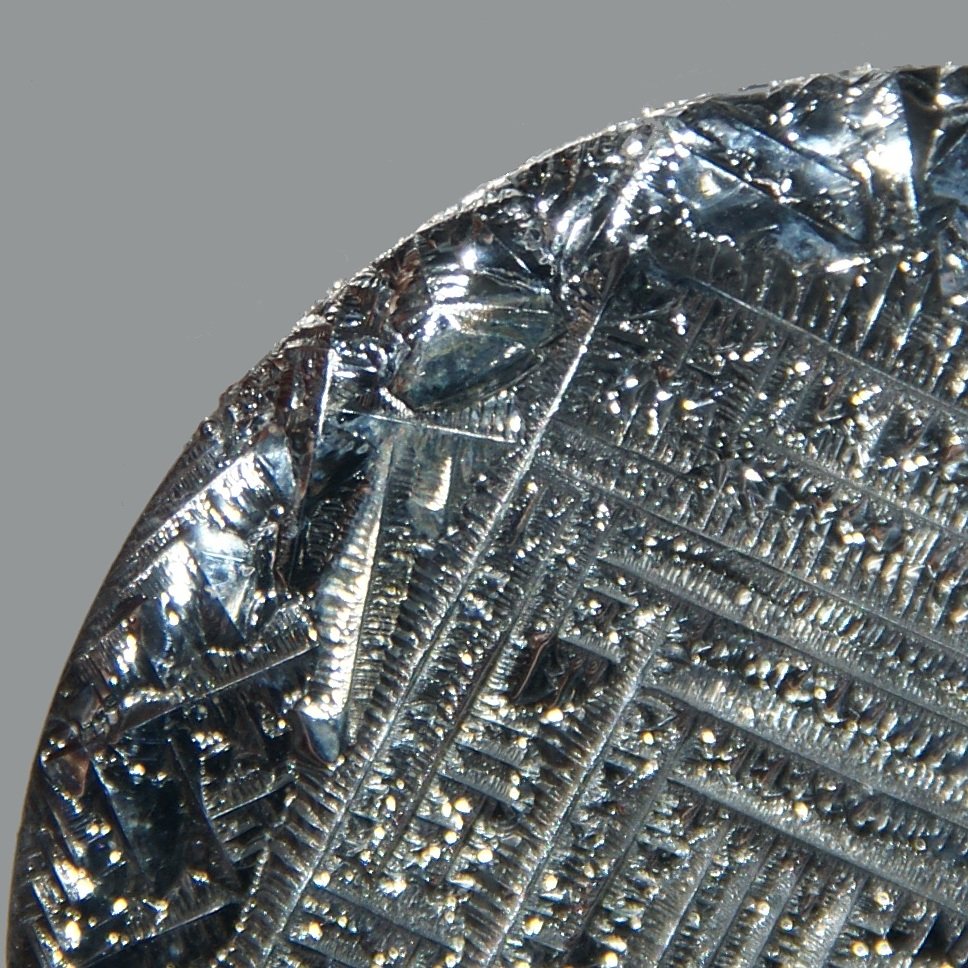
Was ist das?
A brittle, silvery element recovered from the slime at the bottom of a copper refinery tank, and the basis of one of the two commercial thin-film solar technologies.
Warum ist das wichtig?
Cadmium telluride panels are the main non-silicon solar technology in production, and their scale is capped by how much tellurium copper refining yields.
Where it is in the Earth
Tellurium is one of the rarest stable elements in the Earth's crust, and it does not form ore deposits of its own in any economically meaningful sense. Instead, it concentrates through the same hydrothermal processes that form copper and gold deposits. When hot, metal-rich fluids move through fractures in the crust, they carry trace quantities of tellurium alongside copper, lead, gold, and silver. As those fluids cool, tellurium precipitates — that is, it drops out of solution and bonds with other metals to form telluride minerals such as calaverite (a gold telluride) and tetradymite (a bismuth telluride). These minerals are found in porphyry copper deposits, which are large, low-grade bodies of mineralised rock formed by cooling magma, and in epithermal gold deposits, which form closer to the surface from lower-temperature fluids.
The connection to copper is the key fact for understanding where tellurium comes from. Porphyry copper deposits are the world's dominant source of mined copper, and they are distributed along the great volcanic arcs of the Pacific Rim and the Andes, as well as across parts of Central Asia. Wherever those deposits are being processed, tellurium travels with the copper through smelting and refining, eventually concentrating in the residues of the refining tankhouse. It is worth noting that the tellurium content of any given copper deposit is highly variable and often very low; it follows the copper rather than accumulating in one place on its own terms. There are no commercially operating primary tellurium mines — mines where the sole target is tellurium — anywhere in the world.
Some gold-telluride deposits, such as those that made Kalgoorlie in Australia historically notable, contain enough tellurium to be geologically interesting, but the volumes recovered are small relative to what copper refining yields. The geography of tellurium supply is therefore not really the geography of tellurium geology; it is the geography of copper smelting and refining capacity, which has shifted heavily toward China over the past few decades.
Getting it out
Because tellurium has no mines of its own, it is not mined in the conventional sense. It arrives at a refinery as an invisible passenger inside copper anodes — large slabs of impure copper cast at a smelter and then dissolved electrochemically in a refining tankhouse. In electrorefining, the anode is slowly eaten away by an electric current, and pure copper deposits on a cathode plate opposite it. The impurities that were locked in the anode — selenium, tellurium, silver, gold, platinum-group metals, and others — do not dissolve cleanly. They fall to the bottom of the tank as a sludge called anode slime. Recovering tellurium means collecting and processing that slime.
The grade of tellurium in copper, meaning how many grams of tellurium are present per tonne of copper, varies considerably depending on the deposit the ore came from. Some ores carry relatively more, others carry almost none. Because the grade is low and the tellurium is bound up with many other elements in a complex sludge, a great deal of copper must be refined before a meaningful quantity of tellurium accumulates. The ratio of waste to product is therefore enormous, though from tellurium's perspective the copper is not really waste — it is the primary product of a process that tellurium merely accompanies. This by-product status is what makes tellurium supply so structurally unusual: it cannot be increased simply by drilling more holes or opening a new mine. Production is gated by copper refining throughput and by whether a given refinery has the downstream equipment to extract tellurium from its slimes at all.
What pulls on it
The single largest use of tellurium is in cadmium telluride thin-film solar panels. In this technology, a very thin layer of cadmium telluride semiconductor — the layer that actually absorbs sunlight and converts it to electricity — is deposited onto glass. The material intensity of this process, meaning how much tellurium is needed per unit of generating capacity, sits between 25 and 60 kilograms per megawatt of capacity, depending on layer thickness and manufacturing efficiency. As solar manufacturing has scaled up, the absolute quantity of tellurium consumed by this sector has grown accordingly. Whether demand grows further depends heavily on how much cadmium telluride capacity is built relative to other solar technologies, particularly conventional crystalline silicon, which uses no tellurium at all.
Outside solar, tellurium is used in metallurgy — chiefly as a small additive to free-machining steels and copper alloys, where it improves how the metal cuts and finishes. Thermoelectric devices, which convert a temperature difference directly into electricity or use electricity to pump heat, rely on bismuth telluride compounds and represent a smaller but technically distinct demand stream. These non-solar uses have been relatively stable over time and are not strongly tied to the energy transition.
A sharp increase in demand would require either a major expansion of cadmium telluride solar manufacturing, a new application that consumes tellurium in comparable quantities, or both. A sharp decrease would most likely follow a technological shift away from cadmium telluride in the solar industry, or a significant reduction in the tellurium intensity of the cells themselves through thinner absorber layers. Both directions of change are physically plausible, which is part of what makes tellurium an unusual material to analyse.
Turning ore into product Ebene 3
Anode slime from a copper tankhouse is a dense, heterogeneous mixture containing copper sulfate, selenium, tellurium, silver, gold, and various other metals in oxide, sulfide, and elemental forms. The first step at most refineries is to remove residual copper by leaching the slime with sulfuric acid or by a pressure oxidation step, which brings the copper back into solution and leaves the other metals behind in a more concentrated solid. This decopperised slime then goes through a smelting or roasting step — heating in a furnace — which drives off selenium as selenium dioxide gas (which is captured separately) and produces a slag enriched in tellurium and the precious metals.
Tellurium is then separated from the remaining material through a soda ash fusion or an alkaline leach, producing sodium tellurite in solution. The tellurite solution is then acidified, which causes crude tellurium to precipitate as a powder or sponge. Further refining, typically by electrolysis or by repeated dissolution and precipitation, brings the metal to commercial purity grades. The losses at each stage accumulate: tellurium that is not captured in the slime collection step, that leaves with off-gas or slag, or that reports to waste streams represents a permanent reduction in overall recovery. Improving recovery rates at existing refineries is therefore a meaningful route to increasing supply without any change in copper output. The Guixi Smelter in China, one of the world's largest copper operations, is the most significant single processing site for tellurium globally, which reflects China's dominant share of world refinery capacity.
Cadmium telluride, the compound used directly in thin-film solar cells, is not produced at the copper refinery. Refined tellurium metal or tellurium dioxide is sold to specialist chemical producers who react it with cadmium compounds under controlled conditions to produce the semiconductor-grade CdTe powder or vapour feedstock that module manufacturers require. Each conversion step adds cost and introduces its own yield losses, so the chain from anode slime to finished solar module involves many hands and significant material attrition.
Substitution and recycling Ebene 3
Within the solar sector, the direct substitute for cadmium telluride thin-film technology is crystalline silicon, which dominates global solar manufacturing and requires no tellurium. Copper indium gallium selenide, known as CIGS, is another thin-film technology that avoids tellurium but depends instead on indium and gallium, which carry their own supply constraints. Switching from cadmium telluride to crystalline silicon at the module manufacturing level is not a material swap but a complete change of production line, involving different equipment, different chemistries, and different capital costs. The performance characteristics also differ: cadmium telluride panels have historically performed somewhat better than silicon in high-temperature and diffuse-light conditions, which has preserved a market position for the technology in certain geographies. There is no drop-in replacement for tellurium in a cadmium telluride cell.
In the metallurgical uses, selenium can substitute for tellurium as a machinability additive in steel, and the two are often selected based on relative price and availability rather than strong performance differentiation. In thermoelectric applications, the substitution options are more limited because bismuth telluride has a combination of electrical and thermal properties that is difficult to match at reasonable cost with other compounds. Recycling of tellurium at end of life is technically possible but commercially underdeveloped. The cadmium telluride layer in a solar panel is present in very thin, dispersed form, making its recovery from decommissioned panels chemically demanding. Some recycling infrastructure exists, operated in part by module manufacturers who have obligations to manage end-of-life panels, but the fraction of tellurium re-entering the supply chain through recycling is small relative to primary production. As the first large cohort of thin-film panels approaches end of life, this position may shift, but the economics of recycling at scale remain dependent on price levels and collection logistics that vary by region.
Where the chain is fragile Ebene 4
The structural fragility of tellurium supply begins with its by-product status. Production cannot respond to price signals in the way that primary metal production can. A refinery operator decides how much copper to process based on copper economics; tellurium recovery is a secondary consideration, and adding or expanding slime-processing capacity requires capital investment and technical capability that not all refineries have. The result is a supply curve that is inelastic — one that does not respond quickly or proportionately to changes in tellurium demand or price. The price data in the table above, which shows a marked increase between 2024 and 2025 in both European and U.S. markets, illustrates that the market can tighten faster than supply can adjust.
Geographic concentration compounds this. China accounts for 80 percent of world production, according to the USGS data for 2025, and a single facility — the Guixi Smelter — represents a disproportionate share of that. The remaining production is spread across Russia, Japan, Sweden, Canada, Uzbekistan, South Africa, and Bulgaria in quantities that, taken together, fall well short of China's output. U.S. production is withheld by the source, indicating it exists but is commercially sensitive; the United States is listed as a net importer, drawing supply from Canada, the Philippines, Japan, and Germany. This geographic structure means that any disruption to Chinese refining output — whether from policy, infrastructure, or trade friction — has no ready short-term offset elsewhere.
Reporting conventions introduce their own uncertainty. Tellurium production figures are derived from refinery reporting rather than direct measurement, and the definition of what counts as tellurium production (crude tellurite, refined metal, or compound) varies between national statistical systems. World reserve figures are not reported in the available data, which reflects a genuine difficulty: because tellurium is a by-product, its recoverable quantity depends not just on how much tellurium is present in copper ores globally but on which refineries have slime-processing capability and at what recovery efficiency. Estimates of the tellurium content of known copper reserves exist in the literature, but they carry wide uncertainty bands because tellurium grade is measured inconsistently in ore characterisation programmes that are designed primarily for copper. Any published reserve figure for tellurium should be read with that methodological caveat in mind.
Wer es produziert
Auf einer Karte anzeigen →Refinery production
Refinery productionmetric tons 2025 (geschätzt) Weltgesamt 1,000 metric tons
USGS Mineral Commodity Summaries 2026 · Refinery production; almost entirely a by-product of copper electrorefining anode slimes. · Quelle ↗
Tabelle seitwärts scrollen, um die restlichen Spalten zu sehen.
| Land | Produktion | Anteil an der Weltproduktion |
|---|---|---|
| China | 800.0 | 80.0% |
| Russia | 67.00 | 6.7% |
| Japan | 61.00 | 6.1% |
| Canada | 28.00 | 2.8% |
| Uzbekistan | 18.00 | 1.8% |
| South Africa | 5.00 | 0.5% |
| Bulgaria | 1.00 | 0.1% |
| Other countries | Not applicable | — |
| Weltgesamt | 1,000 | 100% |
Refinery production: concentrate
Refinery production: concentratemetric tons 2025 (geschätzt)
USGS Mineral Commodity Summaries 2026 · Refinery production; almost entirely a by-product of copper electrorefining anode slimes. · Quelle ↗
Tabelle seitwärts scrollen, um die restlichen Spalten zu sehen.
| Land | Produktion | Anteil an der Weltproduktion |
|---|---|---|
| Sweden | 48.00 | — |
Refinery production: copper telluride
Refinery production: copper telluridemetric tons 2025 (geschätzt)
USGS Mineral Commodity Summaries 2026 · Refinery production; almost entirely a by-product of copper electrorefining anode slimes. · Quelle ↗
Tabelle seitwärts scrollen, um die restlichen Spalten zu sehen.
| Land | Produktion | Anteil an der Weltproduktion |
|---|---|---|
| United States | Withheld | — |
„Withheld" bedeutet, dass der USGS den Wert zurückgehalten hat, um keine Rückschlüsse auf Daten einzelner Unternehmen zuzulassen – er bedeutet nicht null. Die Länderwerte addieren sich nicht immer zum Weltgesamt, weil die Quelle jeden Einzelwert unabhängig rundet und eine Zeile „sonstige Länder" nicht immer ausweist.
Preis
annual average, dollars per kilogram: Europe
Jahresdurchschnittdollars per kilogram
Grundlage: annual average, dollars per kilogram: Europe. Jahresdurchschnitte gemäß Veröffentlichung in USGS Mineral Commodity Summaries 2026 · Quelle ↗. Dies sind jährliche Referenzdurchschnittswerte, kein Live-Marktpreis.
annual average, dollars per kilogram: United States
Jahresdurchschnittdollars per kilogram
Grundlage: annual average, dollars per kilogram: United States. Jahresdurchschnitte gemäß Veröffentlichung in USGS Mineral Commodity Summaries 2026 · Quelle ↗. Dies sind jährliche Referenzdurchschnittswerte, kein Live-Marktpreis.
Wo es aufbereitet und raffiniert wird
| Anlage | Art | Stufe | Land | Rolle |
|---|---|---|---|---|
| Guixi Smelter | Hütte | Aufbereitung | China | Ausgabe |
Wofür es verwendet wird
Alle Endmärkte →| Endmarkt | Was es dort tut | Bedeutung |
|---|---|---|
| Solar Power | Cadmium-telluride thin-film cells | Wichtig |
Wie viel eine Technologie davon benötigt
| Technologie | Menge | Angegeben | Grundlage |
|---|---|---|---|
| Cadmium Telluride Thin-Film Module Scale is limited by copper-refining by-product supply. | 25.00–60.00 kg | per MW of capacity | Semiconductor layer |
Indicative range compiled from published technology studies and chemistry; verify against a manufacturer specification before use. Diese Zahlen mit beliebiger Skalierung im Materialrechner ausführen →
Exportkontrollen
| Land | Kontrolle | Gilt für |
|---|---|---|
| China | Export licensing requirement for materials and technologies | Antimony (2024), bismuth (2025), synthesized diamond (2025), gallium (2023), germanium (2023), graphite (2023), indium (2025), magnesium materials (2024), molybdenum (2025), rare earths (2025), silver (2026), tellurium (2025), tungsten (2025), and items related to lithium batteries and artificial graphite anode materials (2025). ↗ |
USGS Mineral Commodity Summaries 2026, table 4 — controls in effect as of January 2026, excluding controls since lifted.
Grenzenübergreifend verfolgen
Alle Routen →Wo eine Sendung dieses Materials tatsächlich hingeht — jedes Land, jeder Verwahrer und was bei jedem Schritt zurückbleibt.
Chilean sulfide concentrate to Chinese cathode to a wire Chile mines the most copper in the world. China refines the most. Those are not the same sentence.