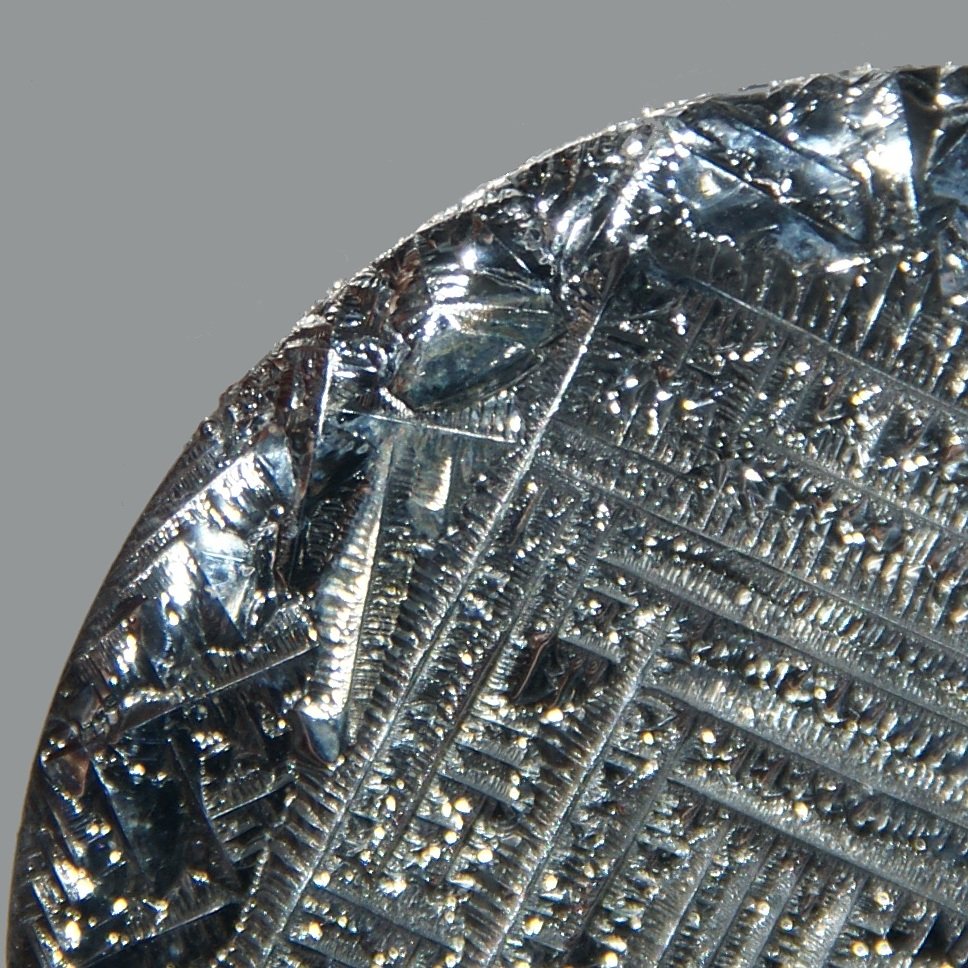
What is it?
A brittle, silvery element recovered from the slime at the bottom of a copper refinery tank, and the basis of one of the two commercial thin-film solar technologies.
Why does it matter?
Cadmium telluride panels are the main non-silicon solar technology in production, and their scale is capped by how much tellurium copper refining yields.
Deeper written sections for this material have not been published yet. Everything below is drawn straight from the source datasets and is complete.
Who produces it
See it on a map →Refinery production
Refinery productionmetric tons 2025 (estimated) World total 1,000 metric tons
USGS Mineral Commodity Summaries 2026 · Refinery production; almost entirely a by-product of copper electrorefining anode slimes. · source ↗
Scroll the table sideways for the remaining columns.
| Country | Production | Share of world |
|---|---|---|
| China | 800.0 | 80.0% |
| Russia | 67.00 | 6.7% |
| Japan | 61.00 | 6.1% |
| Canada | 28.00 | 2.8% |
| Uzbekistan | 18.00 | 1.8% |
| South Africa | 5.00 | 0.5% |
| Bulgaria | 1.00 | 0.1% |
| Other countries | Not applicable | — |
| World total | 1,000 | 100% |
Refinery production: concentrate
Refinery production: concentratemetric tons 2025 (estimated)
USGS Mineral Commodity Summaries 2026 · Refinery production; almost entirely a by-product of copper electrorefining anode slimes. · source ↗
Scroll the table sideways for the remaining columns.
| Country | Production | Share of world |
|---|---|---|
| Sweden | 48.00 | — |
Refinery production: copper telluride
Refinery production: copper telluridemetric tons 2025 (estimated)
USGS Mineral Commodity Summaries 2026 · Refinery production; almost entirely a by-product of copper electrorefining anode slimes. · source ↗
Scroll the table sideways for the remaining columns.
| Country | Production | Share of world |
|---|---|---|
| United States | Withheld | — |
“Withheld” means the USGS suppressed the figure to avoid disclosing an individual company's data — it does not mean zero. Country rows do not always sum to the world total because the source rounds each figure independently and does not always break out an “other countries” line.
Price
annual average, dollars per kilogram: Europe
Annual averagedollars per kilogram
Basis: annual average, dollars per kilogram: Europe. Annual averages as published in USGS Mineral Commodity Summaries 2026 · source ↗. These are reference annual averages, not a live market quote.
annual average, dollars per kilogram: United States
Annual averagedollars per kilogram
Basis: annual average, dollars per kilogram: United States. Annual averages as published in USGS Mineral Commodity Summaries 2026 · source ↗. These are reference annual averages, not a live market quote.
Where it is processed and refined
| Plant | Kind | Stage | Country | Role |
|---|---|---|---|---|
| Guixi Smelter | Smelter | Processing | China | Output |
What it is used for
All end markets →| End market | What it does there | Importance |
|---|---|---|
| Solar Power | Cadmium-telluride thin-film cells | Important |
How much of it a technology needs
| Technology | Quantity | Quoted | Basis |
|---|---|---|---|
| Cadmium Telluride Thin-Film Module Scale is limited by copper-refining by-product supply. | 25.00–60.00 kg | per MW of capacity | Semiconductor layer |
Indicative range compiled from published technology studies and chemistry; verify against a manufacturer specification before use. Run these numbers at any scale in the material calculator →
Export controls
| Country | Control | Applies to |
|---|---|---|
| China | Export licensing requirement for materials and technologies | Antimony (2024), bismuth (2025), synthesized diamond (2025), gallium (2023), germanium (2023), graphite (2023), indium (2025), magnesium materials (2024), molybdenum (2025), rare earths (2025), silver (2026), tellurium (2025), tungsten (2025), and items related to lithium batteries and artificial graphite anode materials (2025). ↗ |
USGS Mineral Commodity Summaries 2026, table 4 — controls in effect as of January 2026, excluding controls since lifted.
Follow it across the borders
All journeys →Where a consignment of this material actually goes — every country, every custodian, and what is left behind at each step.
Chilean sulfide concentrate to Chinese cathode to a wire Chile mines the most copper in the world. China refines the most. Those are not the same sentence.