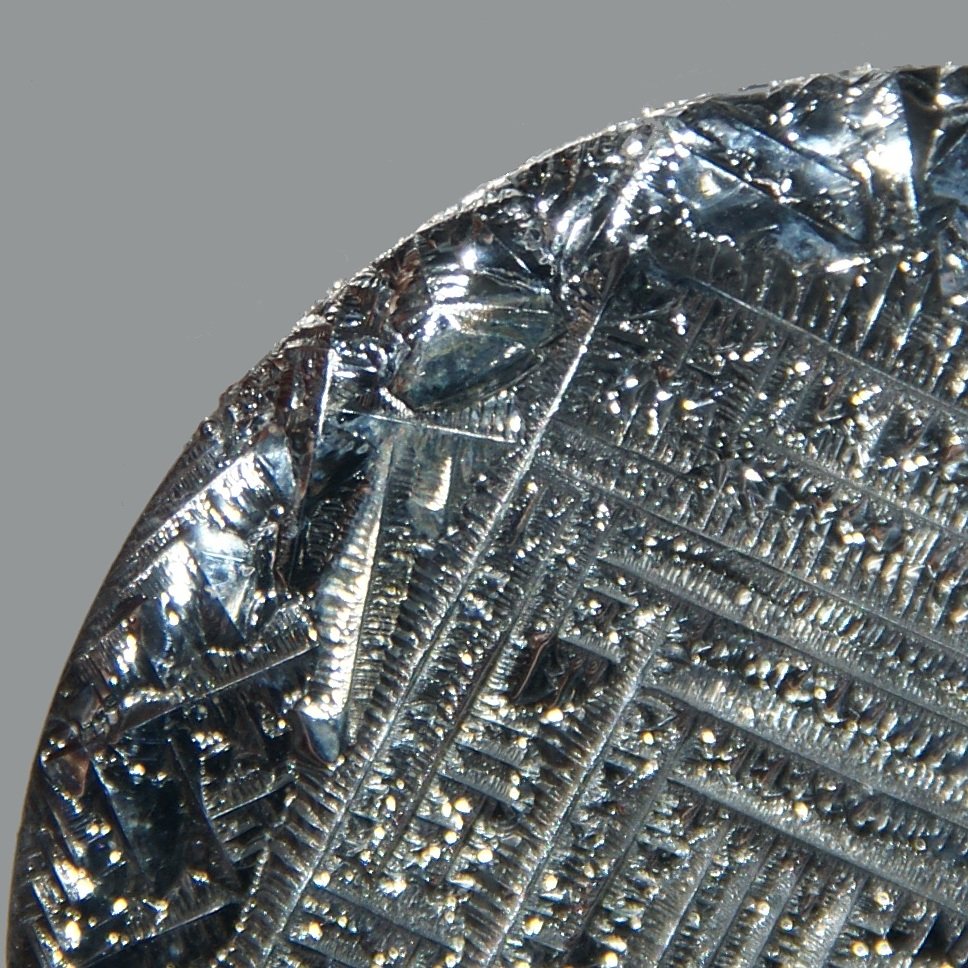
これは何か
A brittle, silvery element recovered from the slime at the bottom of a copper refinery tank, and the basis of one of the two commercial thin-film solar technologies.
なぜ重要なのか
Cadmium telluride panels are the main non-silicon solar technology in production, and their scale is capped by how much tellurium copper refining yields.
Where it is in the Earth
Tellurium is one of the rarest stable elements in the Earth's crust, and it does not form ore deposits of its own in any economically meaningful sense. Instead, it concentrates through the same hydrothermal processes that form copper and gold deposits. When hot, metal-rich fluids move through fractures in the crust, they carry trace quantities of tellurium alongside copper, lead, gold, and silver. As those fluids cool, tellurium precipitates — that is, it drops out of solution and bonds with other metals to form telluride minerals such as calaverite (a gold telluride) and tetradymite (a bismuth telluride). These minerals are found in porphyry copper deposits, which are large, low-grade bodies of mineralised rock formed by cooling magma, and in epithermal gold deposits, which form closer to the surface from lower-temperature fluids.
The connection to copper is the key fact for understanding where tellurium comes from. Porphyry copper deposits are the world's dominant source of mined copper, and they are distributed along the great volcanic arcs of the Pacific Rim and the Andes, as well as across parts of Central Asia. Wherever those deposits are being processed, tellurium travels with the copper through smelting and refining, eventually concentrating in the residues of the refining tankhouse. It is worth noting that the tellurium content of any given copper deposit is highly variable and often very low; it follows the copper rather than accumulating in one place on its own terms. There are no commercially operating primary tellurium mines — mines where the sole target is tellurium — anywhere in the world.
Some gold-telluride deposits, such as those that made Kalgoorlie in Australia historically notable, contain enough tellurium to be geologically interesting, but the volumes recovered are small relative to what copper refining yields. The geography of tellurium supply is therefore not really the geography of tellurium geology; it is the geography of copper smelting and refining capacity, which has shifted heavily toward China over the past few decades.
Getting it out
Because tellurium has no mines of its own, it is not mined in the conventional sense. It arrives at a refinery as an invisible passenger inside copper anodes — large slabs of impure copper cast at a smelter and then dissolved electrochemically in a refining tankhouse. In electrorefining, the anode is slowly eaten away by an electric current, and pure copper deposits on a cathode plate opposite it. The impurities that were locked in the anode — selenium, tellurium, silver, gold, platinum-group metals, and others — do not dissolve cleanly. They fall to the bottom of the tank as a sludge called anode slime. Recovering tellurium means collecting and processing that slime.
The grade of tellurium in copper, meaning how many grams of tellurium are present per tonne of copper, varies considerably depending on the deposit the ore came from. Some ores carry relatively more, others carry almost none. Because the grade is low and the tellurium is bound up with many other elements in a complex sludge, a great deal of copper must be refined before a meaningful quantity of tellurium accumulates. The ratio of waste to product is therefore enormous, though from tellurium's perspective the copper is not really waste — it is the primary product of a process that tellurium merely accompanies. This by-product status is what makes tellurium supply so structurally unusual: it cannot be increased simply by drilling more holes or opening a new mine. Production is gated by copper refining throughput and by whether a given refinery has the downstream equipment to extract tellurium from its slimes at all.
What pulls on it
The single largest use of tellurium is in cadmium telluride thin-film solar panels. In this technology, a very thin layer of cadmium telluride semiconductor — the layer that actually absorbs sunlight and converts it to electricity — is deposited onto glass. The material intensity of this process, meaning how much tellurium is needed per unit of generating capacity, sits between 25 and 60 kilograms per megawatt of capacity, depending on layer thickness and manufacturing efficiency. As solar manufacturing has scaled up, the absolute quantity of tellurium consumed by this sector has grown accordingly. Whether demand grows further depends heavily on how much cadmium telluride capacity is built relative to other solar technologies, particularly conventional crystalline silicon, which uses no tellurium at all.
Outside solar, tellurium is used in metallurgy — chiefly as a small additive to free-machining steels and copper alloys, where it improves how the metal cuts and finishes. Thermoelectric devices, which convert a temperature difference directly into electricity or use electricity to pump heat, rely on bismuth telluride compounds and represent a smaller but technically distinct demand stream. These non-solar uses have been relatively stable over time and are not strongly tied to the energy transition.
A sharp increase in demand would require either a major expansion of cadmium telluride solar manufacturing, a new application that consumes tellurium in comparable quantities, or both. A sharp decrease would most likely follow a technological shift away from cadmium telluride in the solar industry, or a significant reduction in the tellurium intensity of the cells themselves through thinner absorber layers. Both directions of change are physically plausible, which is part of what makes tellurium an unusual material to analyse.
生産者
地図で見る →Refinery production
Refinery productionmetric tons 2025 (推定値) 世界合計 1,000 metric tons
USGS Mineral Commodity Summaries 2026 · Refinery production; almost entirely a by-product of copper electrorefining anode slimes. · 出典 ↗
テーブルを横にスクロールすると残りの列が表示されます。
| 国 | 生産 | 世界に占める割合 |
|---|---|---|
| China | 800.0 | 80.0% |
| Russia | 67.00 | 6.7% |
| Japan | 61.00 | 6.1% |
| Canada | 28.00 | 2.8% |
| Uzbekistan | 18.00 | 1.8% |
| South Africa | 5.00 | 0.5% |
| Bulgaria | 1.00 | 0.1% |
| Other countries | Not applicable | — |
| 世界合計 | 1,000 | 100% |
Refinery production: concentrate
Refinery production: concentratemetric tons 2025 (推定値)
USGS Mineral Commodity Summaries 2026 · Refinery production; almost entirely a by-product of copper electrorefining anode slimes. · 出典 ↗
テーブルを横にスクロールすると残りの列が表示されます。
| 国 | 生産 | 世界に占める割合 |
|---|---|---|
| Sweden | 48.00 | — |
Refinery production: copper telluride
Refinery production: copper telluridemetric tons 2025 (推定値)
USGS Mineral Commodity Summaries 2026 · Refinery production; almost entirely a by-product of copper electrorefining anode slimes. · 出典 ↗
テーブルを横にスクロールすると残りの列が表示されます。
| 国 | 生産 | 世界に占める割合 |
|---|---|---|
| United States | Withheld | — |
「非開示」とは、個別企業のデータが特定されないようUSGSが数値を公表しなかったことを意味し、ゼロを意味するものではありません。出典が各数値を独立して丸め処理しており、「その他の国」の内訳を常に示しているわけではないため、各国の数値の合計が世界合計と一致しないことがあります。
価格
annual average, dollars per kilogram: Europe
年間平均dollars per kilogram
基準: annual average, dollars per kilogram: Europe. 以下に公表された年間平均値: USGS Mineral Commodity Summaries 2026 · 出典 ↗. これらは参照用の年間平均値であり、リアルタイムの市況相場ではない。
annual average, dollars per kilogram: United States
年間平均dollars per kilogram
基準: annual average, dollars per kilogram: United States. 以下に公表された年間平均値: USGS Mineral Commodity Summaries 2026 · 出典 ↗. これらは参照用の年間平均値であり、リアルタイムの市況相場ではない。
処理・精製が行われる場所
| プラント | 種別 | ステージ | 国 | 役割 |
|---|---|---|---|---|
| Guixi Smelter | 製錬所 | 処理 | China | 産出物 |
用途
全エンドマーケット →| 最終市場 | そこでの機能 | 重要度 |
|---|---|---|
| Solar Power | Cadmium-telluride thin-film cells | 重要 |
技術が必要とする量
| 技術 | 数量 | 建値 | 基準 |
|---|---|---|---|
| Cadmium Telluride Thin-Film Module Scale is limited by copper-refining by-product supply. | 25.00–60.00 kg | per MW of capacity | Semiconductor layer |
Indicative range compiled from published technology studies and chemistry; verify against a manufacturer specification before use. 素材計算機で任意の規模に換算して実行 →
輸出規制
| 国 | 支配 | 適用対象 |
|---|---|---|
| China | Export licensing requirement for materials and technologies | Antimony (2024), bismuth (2025), synthesized diamond (2025), gallium (2023), germanium (2023), graphite (2023), indium (2025), magnesium materials (2024), molybdenum (2025), rare earths (2025), silver (2026), tellurium (2025), tungsten (2025), and items related to lithium batteries and artificial graphite anode materials (2025). ↗ |
USGS Mineral Commodity Summaries 2026, table 4 — controls in effect as of January 2026, excluding controls since lifted.
越境地点をたどる
すべての輸送経路 →この素材の特定の貨物が実際にたどる経路——すべての国、すべての管理者、各工程で残されるもの。
Chilean sulfide concentrate to Chinese cathode to a wire Chile mines the most copper in the world. China refines the most. Those are not the same sentence.