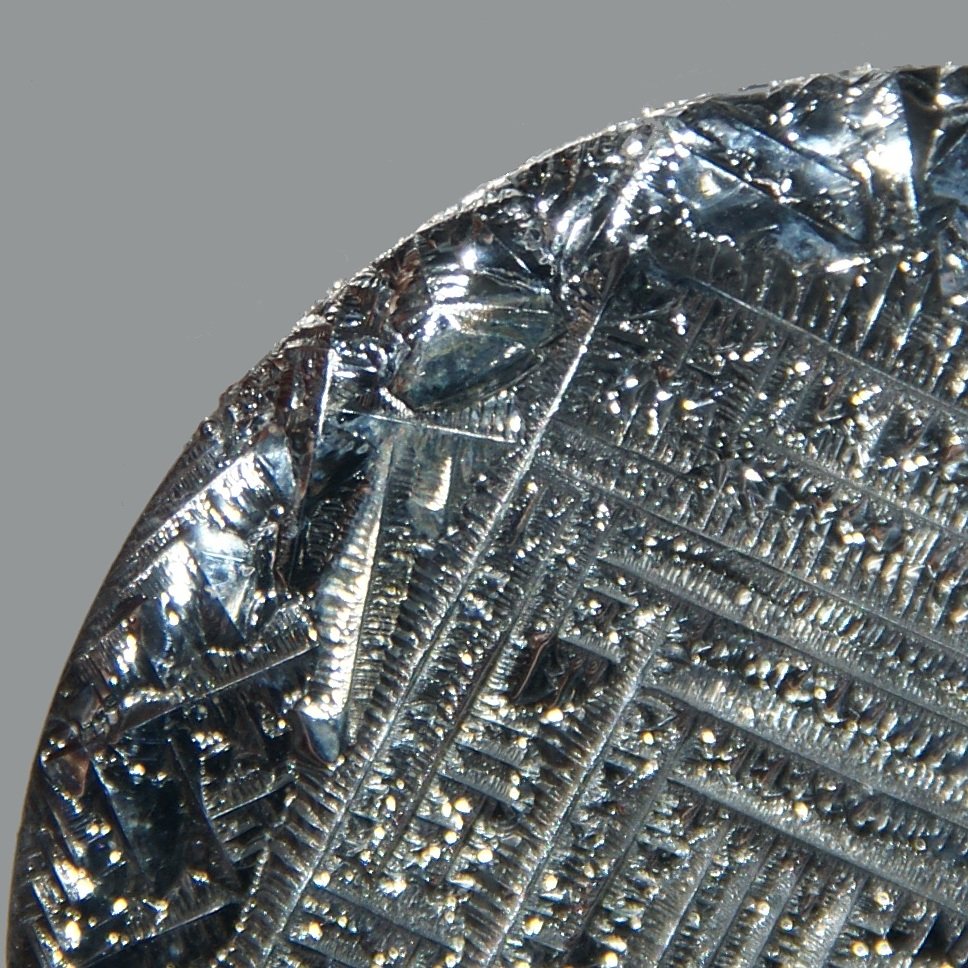
이것은 무엇인가?
A brittle, silvery element recovered from the slime at the bottom of a copper refinery tank, and the basis of one of the two commercial thin-film solar technologies.
왜 중요한가?
Cadmium telluride panels are the main non-silicon solar technology in production, and their scale is capped by how much tellurium copper refining yields.
이 소재의 심층 서술 섹션은 아직 게재되지 않았습니다. 아래 내용은 모두 원본 데이터셋에서 직접 가져온 것으로 완전한 상태입니다.
생산 주체
지도에서 보기 →Refinery production
Refinery productionmetric tons 2025 (추정치) 세계 합계 1,000 metric tons
USGS Mineral Commodity Summaries 2026 · Refinery production; almost entirely a by-product of copper electrorefining anode slimes. · 출처 ↗
나머지 열을 보려면 표를 옆으로 스크롤하십시오.
| 국가 | 생산 | 세계 비중 |
|---|---|---|
| China | 800.0 | 80.0% |
| Russia | 67.00 | 6.7% |
| Japan | 61.00 | 6.1% |
| Canada | 28.00 | 2.8% |
| Uzbekistan | 18.00 | 1.8% |
| South Africa | 5.00 | 0.5% |
| Bulgaria | 1.00 | 0.1% |
| Other countries | Not applicable | — |
| 세계 합계 | 1,000 | 100% |
Refinery production: concentrate
Refinery production: concentratemetric tons 2025 (추정치)
USGS Mineral Commodity Summaries 2026 · Refinery production; almost entirely a by-product of copper electrorefining anode slimes. · 출처 ↗
나머지 열을 보려면 표를 옆으로 스크롤하십시오.
| 국가 | 생산 | 세계 비중 |
|---|---|---|
| Sweden | 48.00 | — |
Refinery production: copper telluride
Refinery production: copper telluridemetric tons 2025 (추정치)
USGS Mineral Commodity Summaries 2026 · Refinery production; almost entirely a by-product of copper electrorefining anode slimes. · 출처 ↗
나머지 열을 보려면 표를 옆으로 스크롤하십시오.
| 국가 | 생산 | 세계 비중 |
|---|---|---|
| United States | Withheld | — |
'비공개'는 USGS가 개별 기업의 데이터 노출을 막기 위해 수치를 억제한 것으로, 0을 의미하지 않습니다. 출처가 각 수치를 독립적으로 반올림하고 '기타 국가' 항목을 항상 별도로 구분하지는 않기 때문에, 국가별 합계가 세계 합계와 일치하지 않을 수 있습니다.
가격
annual average, dollars per kilogram: Europe
연간 평균dollars per kilogram
기준: annual average, dollars per kilogram: Europe. 다음 자료에 게재된 연간 평균 USGS Mineral Commodity Summaries 2026 · 출처 ↗. 이 수치는 기준 연간 평균값이며, 실시간 시장 가격이 아니다.
annual average, dollars per kilogram: United States
연간 평균dollars per kilogram
기준: annual average, dollars per kilogram: United States. 다음 자료에 게재된 연간 평균 USGS Mineral Commodity Summaries 2026 · 출처 ↗. 이 수치는 기준 연간 평균값이며, 실시간 시장 가격이 아니다.
처리·정련 지점
| 시설 | 종류 | 단계 | 국가 | 역할 |
|---|---|---|---|---|
| Guixi Smelter | 제련소 | 가공 | China | 산출물 |
용도
전체 최종 시장 →| 최종 시장 | 거기에서의 기능 | 중요도 |
|---|---|---|
| Solar Power | Cadmium-telluride thin-film cells | 중요 |
기술별 소요량
| 기술 | 수량 | 고시 가격 | 기준 |
|---|---|---|---|
| Cadmium Telluride Thin-Film Module Scale is limited by copper-refining by-product supply. | 25.00–60.00 kg | per MW of capacity | Semiconductor layer |
Indicative range compiled from published technology studies and chemistry; verify against a manufacturer specification before use. 재료 계산기에서 임의의 규모로 이 수치를 계산하십시오. →
수출 통제
| 국가 | 지배력 | 적용 대상 |
|---|---|---|
| China | Export licensing requirement for materials and technologies | Antimony (2024), bismuth (2025), synthesized diamond (2025), gallium (2023), germanium (2023), graphite (2023), indium (2025), magnesium materials (2024), molybdenum (2025), rare earths (2025), silver (2026), tellurium (2025), tungsten (2025), and items related to lithium batteries and artificial graphite anode materials (2025). ↗ |
USGS Mineral Commodity Summaries 2026, table 4 — controls in effect as of January 2026, excluding controls since lifted.
국경을 따라 추적하기
모든 여정 →이 소재의 화물이 실제로 가는 곳 — 모든 나라, 모든 보관자, 그리고 각 단계에서 남는 것.
Chilean sulfide concentrate to Chinese cathode to a wire Chile mines the most copper in the world. China refines the most. Those are not the same sentence.