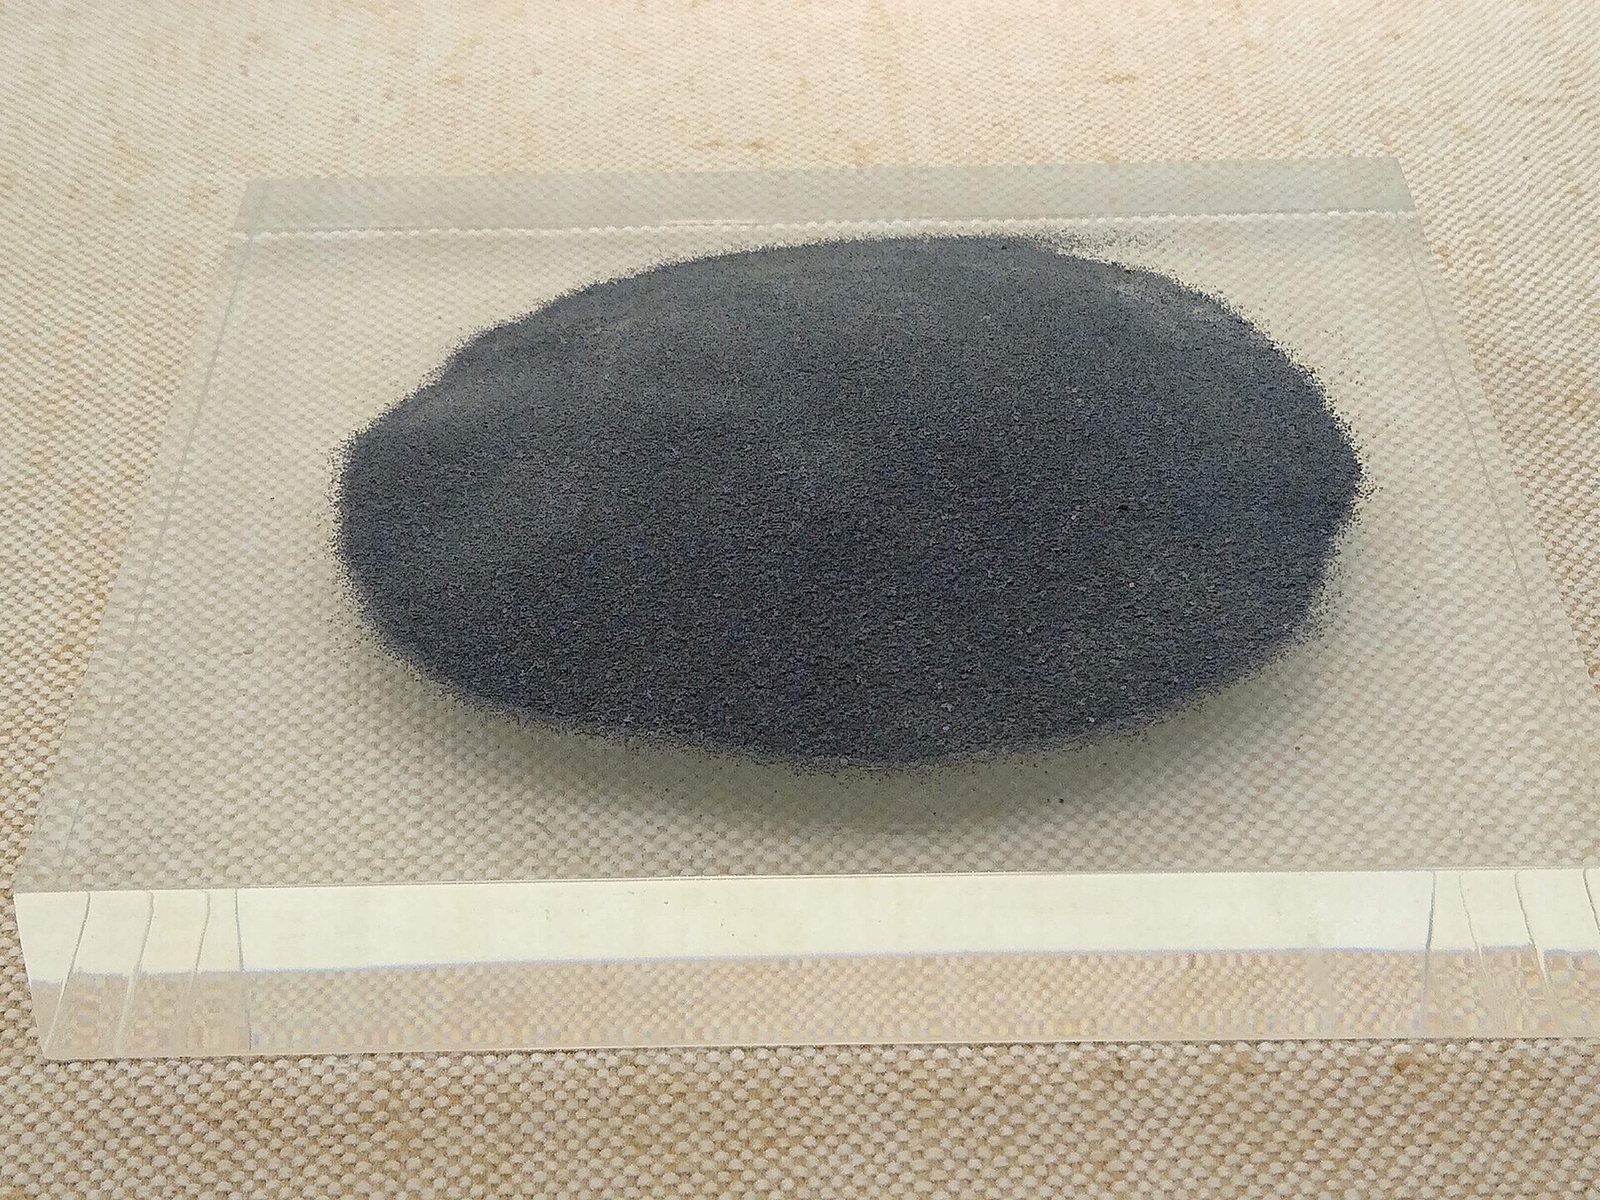
これは何か
Black beach sand — ilmenite and rutile — that is the starting point both for titanium metal and for the white pigment in paint.
なぜ重要なのか
More than 90% of this ore never becomes metal; it becomes titanium dioxide, the whitest white in industrial use.
この材料に関する詳細な解説はまだ公開されていません。以下の内容はすべてソースデータセットから直接取得したものであり、完全な状態で表示されています。
岩石中の産出箇所
全鉱石鉱物 →実際に以下を担う鉱物 titanium mineral concentrates. 鉱床が鉱体となるのは、採掘コストを回収できるほど十分な濃度で鉱石が濃集している場合に限られる。
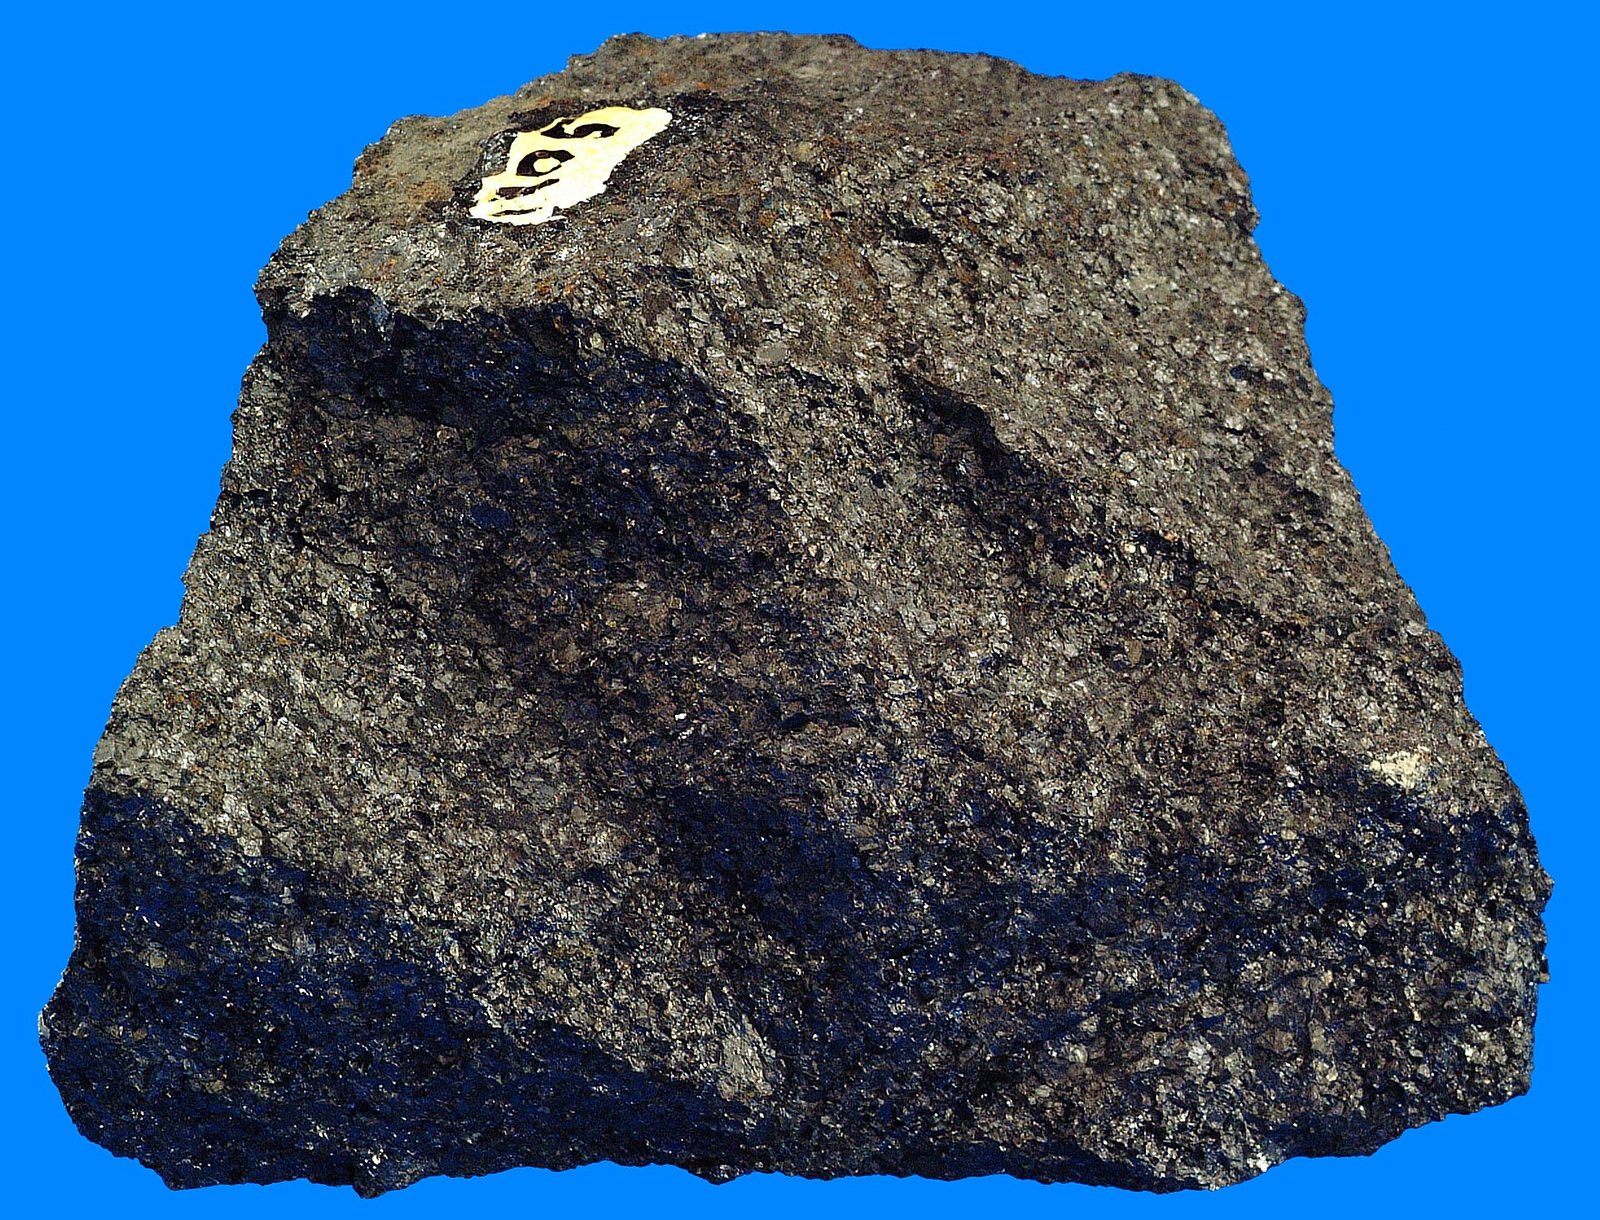
Ilmenite
The dominant titanium mineral, about 45-65% TiO2, mined from heavy mineral sand deposits along ancient shorelines.
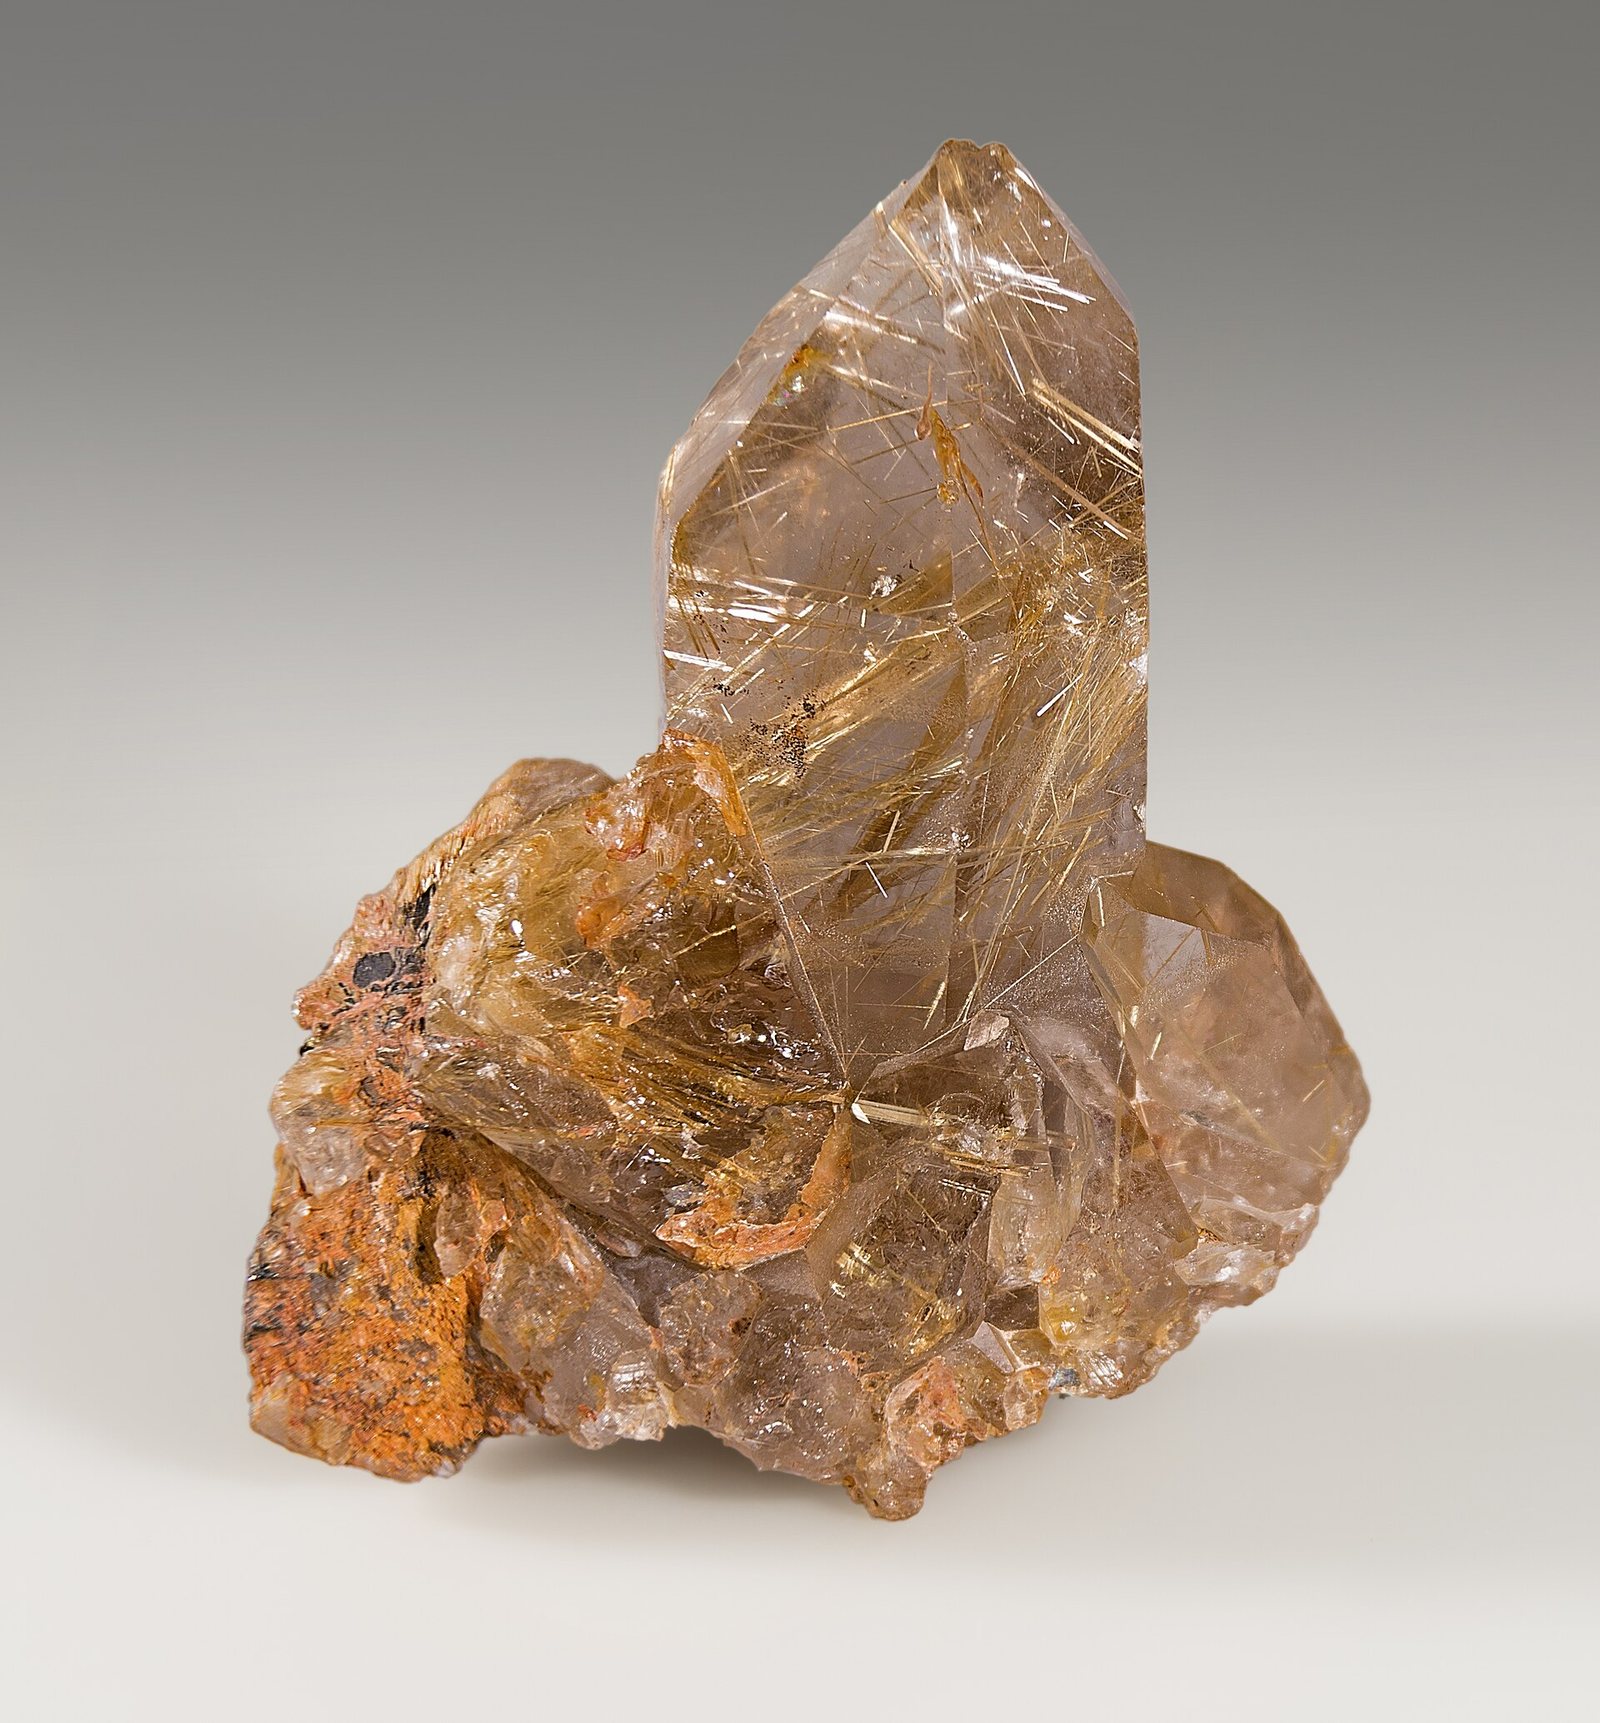
Rutile
Nearly pure titanium dioxide at about 95%. Scarcer and more valuable than ilmenite, and the preferred feed for titanium…
生産者
地図で見る →Mine production: Ilmenite
Mine production: Ilmenitethousand metric tons 2025 (推定値)
USGS Mineral Commodity Summaries 2026 · Gross weight of ilmenite plus rutile concentrate, TiO2 content varies by mineral. · 出典 ↗
テーブルを横にスクロールすると残りの列が表示されます。
| 国 | 生産 | 世界に占める割合 |
|---|---|---|
| China | 3,200 | — |
| Mozambique | 1,900 | — |
| South Africa | 1,300 | — |
| Australia | 780.0 | — |
| Norway | 390.0 | — |
| Senegal | 370.0 | — |
| Canada | 360.0 | — |
| Madagascar | 300.0 | — |
| India | 240.0 | — |
| Other countries | 230.0 | — |
| Ukraine | 200.0 | — |
| United States | 100.0 | — |
Mine production: Rutile
Mine production: Rutilethousand metric tons 2025 (推定値)
USGS Mineral Commodity Summaries 2026 · Gross weight of ilmenite plus rutile concentrate, TiO2 content varies by mineral. · 出典 ↗
テーブルを横にスクロールすると残りの列が表示されます。
| 国 | 生産 | 世界に占める割合 |
|---|---|---|
| Australia | 200.0 | — |
| Sierra Leone | 110.0 | — |
| South Africa | 100.0 | — |
| India | 13.00 | — |
| Ukraine | 10.00 | — |
| Mozambique | 10.00 | — |
| Other countries | 9.00 | — |
| Kenya | Zero | — |
| United States | s | — |
Mine production: ilmenite and rutile, rounded
Mine production: ilmenite and rutile, roundedthousand metric tons 2025 (推定値) 世界合計 9,800 thousand metric tons
USGS Mineral Commodity Summaries 2026 · Gross weight of ilmenite plus rutile concentrate, TiO2 content varies by mineral. · 出典 ↗
テーブルを横にスクロールすると残りの列が表示されます。
| 国 | 生産 | 世界に占める割合 |
|---|---|---|
| 世界合計 | 9,800 | 100% |
Mine production: ilmenite, rounded
Mine production: ilmenite, roundedthousand metric tons 2025 (推定値) 世界合計 9,400 thousand metric tons
USGS Mineral Commodity Summaries 2026 · Gross weight of ilmenite plus rutile concentrate, TiO2 content varies by mineral. · 出典 ↗
テーブルを横にスクロールすると残りの列が表示されます。
| 国 | 生産 | 世界に占める割合 |
|---|---|---|
| 世界合計 | 9,400 | 100% |
Mine production: rutile, rounded
Mine production: rutile, roundedthousand metric tons 2025 (推定値) 世界合計 450.0 thousand metric tons
USGS Mineral Commodity Summaries 2026 · Gross weight of ilmenite plus rutile concentrate, TiO2 content varies by mineral. · 出典 ↗
テーブルを横にスクロールすると残りの列が表示されます。
| 国 | 生産 | 世界に占める割合 |
|---|---|---|
| 世界合計 | 450.0 | 100% |
「非開示」とは、個別企業のデータが特定されないようUSGSが数値を公表しなかったことを意味し、ゼロを意味するものではありません。出典が各数値を独立して丸め処理しており、「その他の国」の内訳を常に示しているわけではないため、各国の数値の合計が世界合計と一致しないことがあります。
埋蔵量の保有者
Reserves: Ilmenite
Reserves: Ilmenitethousand metric tons 2025
USGS Mineral Commodity Summaries 2026 · 出典 ↗
| 国 | 埋蔵量 | 世界に占める割合 |
|---|---|---|
| Australia | 170,000 | — |
| China | 110,000 | — |
| Canada | 50,000 | — |
| Other countries | 46,000 | — |
| Norway | 37,000 | — |
| Madagascar | 30,000 | — |
| South Africa | 28,000 | — |
| India | 15,000 | — |
| Ukraine | 5,900 | — |
| United States | 2,000 | — |
| Senegal | Not applicable | — |
| Mozambique | Not applicable | — |
Reserves: Rutile
Reserves: Rutilethousand metric tons 2025
USGS Mineral Commodity Summaries 2026 · 出典 ↗
| 国 | 埋蔵量 | 世界に占める割合 |
|---|---|---|
| Australia | 35,000 | — |
| South Africa | 6,200 | — |
| Sierra Leone | 2,900 | — |
| Ukraine | 2,500 | — |
| Mozambique | 720.0 | — |
| India | 670.0 | — |
| Other countries | >540.0 | — |
| Kenya | Zero | — |
| United States | s | — |
Reserves: ilmenite and rutile, rounded
Reserves: ilmenite and rutile, roundedthousand metric tons 2025
USGS Mineral Commodity Summaries 2026 · 出典 ↗
| 国 | 埋蔵量 | 世界に占める割合 |
|---|---|---|
| 世界合計 | >540,000 | 100% |
情報源はこの世界合計値を点推定値ではなく範囲推定値として公表しているため、最終列のシェアもそれ自体が範囲推定値となる。
Reserves: ilmenite, rounded
Reserves: ilmenite, roundedthousand metric tons 2025
USGS Mineral Commodity Summaries 2026 · 出典 ↗
| 国 | 埋蔵量 | 世界に占める割合 |
|---|---|---|
| 世界合計 | >490,000 | 100% |
情報源はこの世界合計値を点推定値ではなく範囲推定値として公表しているため、最終列のシェアもそれ自体が範囲推定値となる。
Reserves: rutile, rounded
Reserves: rutile, roundedthousand metric tons 2025
USGS Mineral Commodity Summaries 2026 · 出典 ↗
| 国 | 埋蔵量 | 世界に占める割合 |
|---|---|---|
| 世界合計 | >49,000 | 100% |
情報源はこの世界合計値を点推定値ではなく範囲推定値として公表しているため、最終列のシェアもそれ自体が範囲推定値となる。
価格
dollars per metric ton: Ilmenite, average unit value of imports
年間平均dollars per metric ton
基準: dollars per metric ton: Ilmenite, average unit value of imports. 以下に公表された年間平均値: USGS Mineral Commodity Summaries 2026 · 出典 ↗. これらは参照用の年間平均値であり、リアルタイムの市況相場ではない。
dollars per metric ton: Slag, 80%–95% TiO2, average unit value of imports
年間平均dollars per metric ton
基準: dollars per metric ton: Slag, 80%–95% TiO2, average unit value of imports. 以下に公表された年間平均値: USGS Mineral Commodity Summaries 2026 · 出典 ↗. これらは参照用の年間平均値であり、リアルタイムの市況相場ではない。
dollars per metric ton
年間平均dollars per metric ton
基準: dollars per metric ton. 以下に公表された年間平均値: USGS Mineral Commodity Summaries 2026 · 出典 ↗. これらは参照用の年間平均値であり、リアルタイムの市況相場ではない。
dollars per metric ton: Ilmenite and leucoxene, bulk, f.o.b. Australia
年間平均dollars per metric ton
基準: dollars per metric ton: Ilmenite and leucoxene, bulk, f.o.b. Australia. 以下に公表された年間平均値: USGS Mineral Commodity Summaries 2026 · 出典 ↗. これらは参照用の年間平均値であり、リアルタイムの市況相場ではない。
dollars per metric ton: Rutile, bulk, minimum 95% TiO2, free on board (f.o.b.) Australia
年間平均dollars per metric ton
基準: dollars per metric ton: Rutile, bulk, minimum 95% TiO2, free on board (f.o.b.) Australia. 以下に公表された年間平均値: USGS Mineral Commodity Summaries 2026 · 出典 ↗. これらは参照用の年間平均値であり、リアルタイムの市況相場ではない。
輸出規制
| 国 | 支配 | 適用対象 |
|---|---|---|
| Vietnam | Export ban | Raw materials of iron, lead-zinc, chromite, manganese, apatite, and rare earths and deeply processed titanium (2012). ↗ |
USGS Mineral Commodity Summaries 2026, table 4 — controls in effect as of January 2026, excluding controls since lifted.