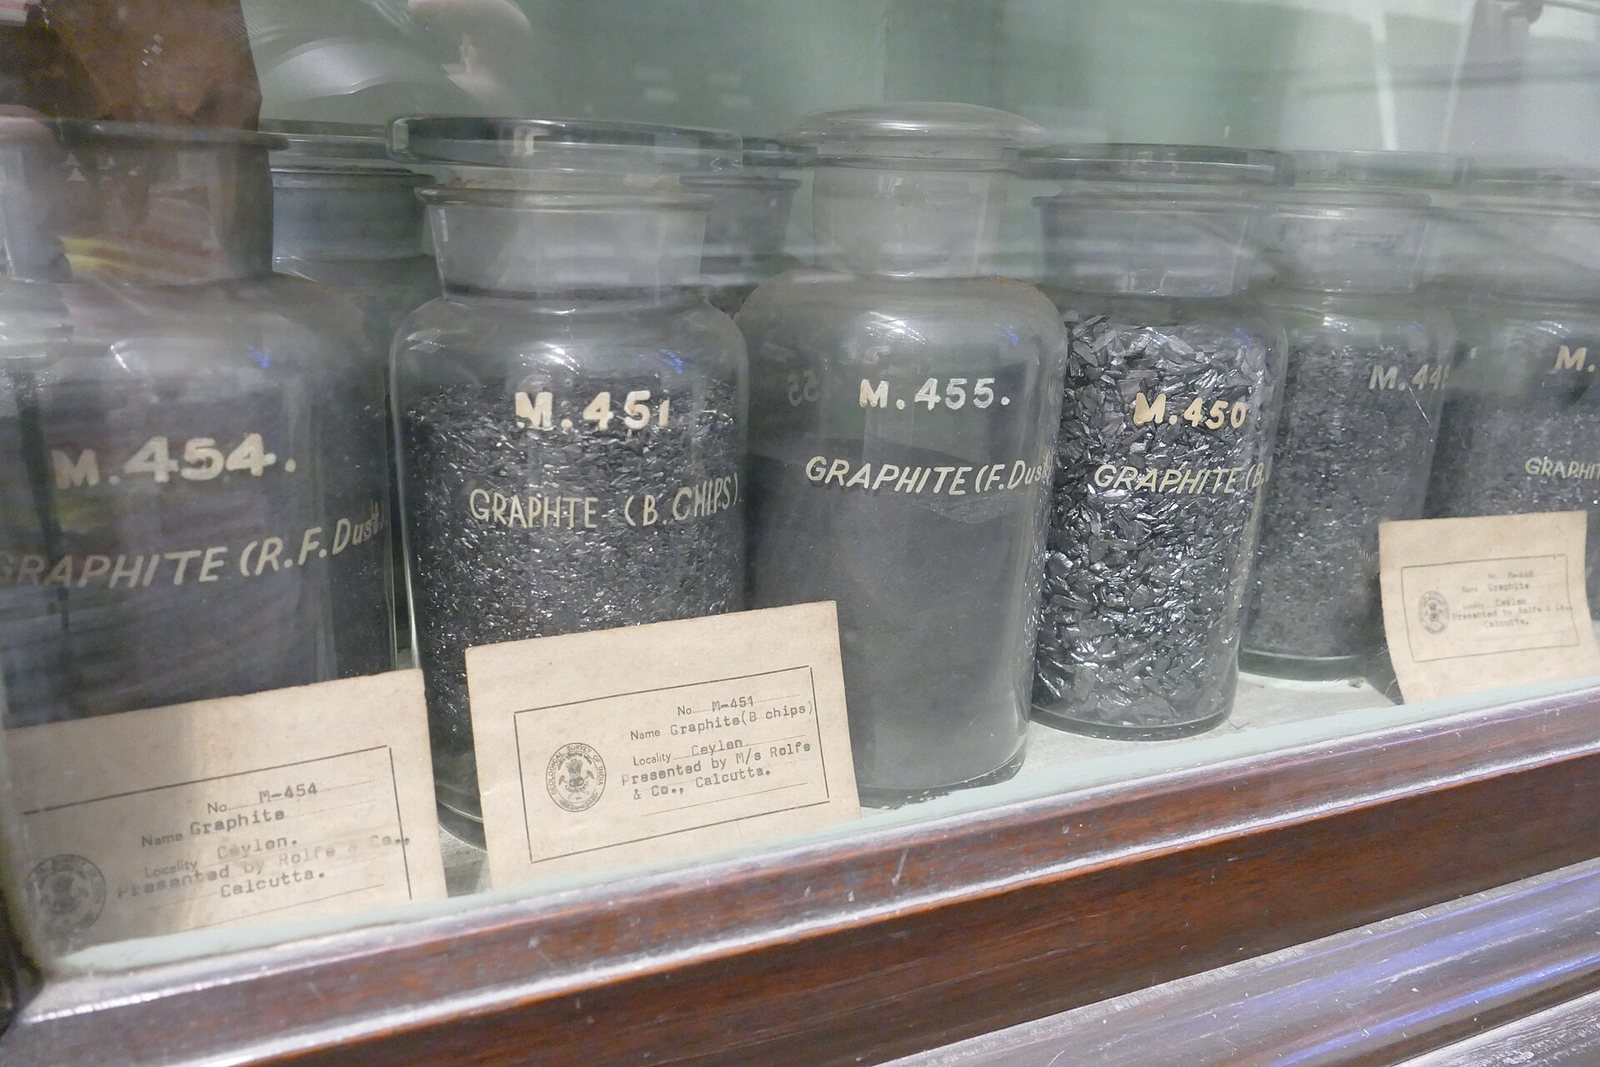
What is it?
Pure carbon in soft, slippery sheets — the same stuff as pencil lead — and the material that holds the lithium when a battery is charged.
Why does it matter?
Every lithium-ion cell has a graphite anode, and by weight there is more graphite in a battery than lithium. It is also the electrode that makes electric-arc steelmaking possible.
Deeper written sections for this material have not been published yet. Everything below is drawn straight from the source datasets and is complete.
Where it comes from in the rock
All ore minerals →These are the minerals that actually carry graphite. A deposit is only an orebody if one of them is concentrated enough to pay for digging it up.
Who produces it
See it on a map →Mine production
Mine productionmetric tons 2025 (estimated) World total 1,800,000 metric tons
USGS Mineral Commodity Summaries 2026 · USGS reports natural graphite only. Synthetic graphite, made by baking petroleum coke at ~3,000 C, is a separate and larger industry. · source ↗
Scroll the table sideways for the remaining columns.
| Country | Production | Share of world |
|---|---|---|
| China | 1,400,000 | 77.8% |
| Madagascar | 80,000 | 4.4% |
| Tanzania | 75,000 | 4.2% |
| Brazil | 65,000 | 3.6% |
| Mozambique | 60,000 | 3.3% |
| Russia | 25,000 | 1.4% |
| India | 17,000 | 0.9% |
| Korea, North | 8,000 | 0.4% |
| Canada | 8,000 | 0.4% |
| Norway | 6,600 | 0.4% |
| Sri Lanka | 3,200 | 0.2% |
| Turkey | 2,200 | 0.1% |
| Ukraine | 800.0 | 0.0% |
| Mexico | 740.0 | 0.0% |
| Vietnam | 500.0 | 0.0% |
| Korea, Republic of | 500.0 | 0.0% |
| Austria | 200.0 | 0.0% |
| Germany | 140.0 | 0.0% |
| United States | Zero | — |
| World total | 1,800,000 | 100% |
“Withheld” means the USGS suppressed the figure to avoid disclosing an individual company's data — it does not mean zero. Country rows do not always sum to the world total because the source rounds each figure independently and does not always break out an “other countries” line.
Who holds the reserves
Reserves
Reservesmetric tons 2025
USGS Mineral Commodity Summaries 2026 · source ↗
| Country | Reserves | Share of world |
|---|---|---|
| China | 100,000,000 | 32.3% |
| Brazil | 74,000,000 | 23.9% |
| Madagascar | 27,000,000 | 8.7% |
| Mozambique | 25,000,000 | 8.1% |
| Tanzania | 18,000,000 | 5.8% |
| Russia | 14,000,000 | 4.5% |
| Vietnam | 9,700,000 | 3.1% |
| India | 8,600,000 | 2.8% |
| Turkey | 6,900,000 | 2.2% |
| Canada | 5,900,000 | 1.9% |
| Mexico | 3,100,000 | 1.0% |
| Korea, North | 2,000,000 | 0.6% |
| Korea, Republic of | 1,800,000 | 0.6% |
| Sri Lanka | 1,500,000 | 0.5% |
| Norway | 600,000 | 0.2% |
| United States | s | — |
| Austria | s | — |
| Germany | s | — |
| Ukraine | s | — |
| World total | 310,000,000 | 100% |
Price
average unit value of imports, dollars per metric ton at foreign ports: Amorphous
Annual averagedollars per metric ton
Basis: average unit value of imports, dollars per metric ton at foreign ports: Amorphous. Annual averages as published in USGS Mineral Commodity Summaries 2026 · source ↗. These are reference annual averages, not a live market quote.
average unit value of imports, dollars per metric ton at foreign ports: Lump and chip (Sri Lanka)
Annual averagedollars per metric ton
Basis: average unit value of imports, dollars per metric ton at foreign ports: Lump and chip (Sri Lanka). Annual averages as published in USGS Mineral Commodity Summaries 2026 · source ↗. These are reference annual averages, not a live market quote.
average unit value of imports, dollars per metric ton at foreign ports: Flake
Annual averagedollars per metric ton
Basis: average unit value of imports, dollars per metric ton at foreign ports: Flake. Annual averages as published in USGS Mineral Commodity Summaries 2026 · source ↗. These are reference annual averages, not a live market quote.
Where it is processed and refined
| Plant | Kind | Stage | Country | Role |
|---|---|---|---|---|
| CATL Ningde Plants | Gigafactory | Component | China | Input |
| Gigafactory Nevada | Gigafactory | Component | United States | Input |
What it is used for
All end markets →| End market | What it does there | Importance |
|---|---|---|
| Electric Vehicles | The anode — the heaviest active material in the cell | Defining |
| Consumer Electronics | Battery anode | Defining |
| Grid Storage | Anode | Defining |
How much of it a technology needs
| Technology | Quantity | Quoted | Basis |
|---|---|---|---|
| LFP Lithium-Ion Battery | 55.00–85.00 kg | per 75 kWh pack | Anode active material |
| NMC Lithium-Ion Battery Roughly 1 kg of anode material per kWh. | 50.00–80.00 kg | per 75 kWh pack | Anode active material |
Indicative range compiled from published technology studies and chemistry; verify against a manufacturer specification before use. Run these numbers at any scale in the material calculator →
Export controls
| Country | Control | Applies to |
|---|---|---|
| China | Export licensing requirement for materials and technologies | Antimony (2024), bismuth (2025), synthesized diamond (2025), gallium (2023), germanium (2023), graphite (2023), indium (2025), magnesium materials (2024), molybdenum (2025), rare earths (2025), silver (2026), tellurium (2025), tungsten (2025), and items related to lithium batteries and artificial graphite anode materials (2025). ↗ |
| Namibia | Export ban | Ores and concentrates of cobalt, graphite, lithium, manganese, and rare earths (2023). ↗ |
USGS Mineral Commodity Summaries 2026, table 4 — controls in effect as of January 2026, excluding controls since lifted.