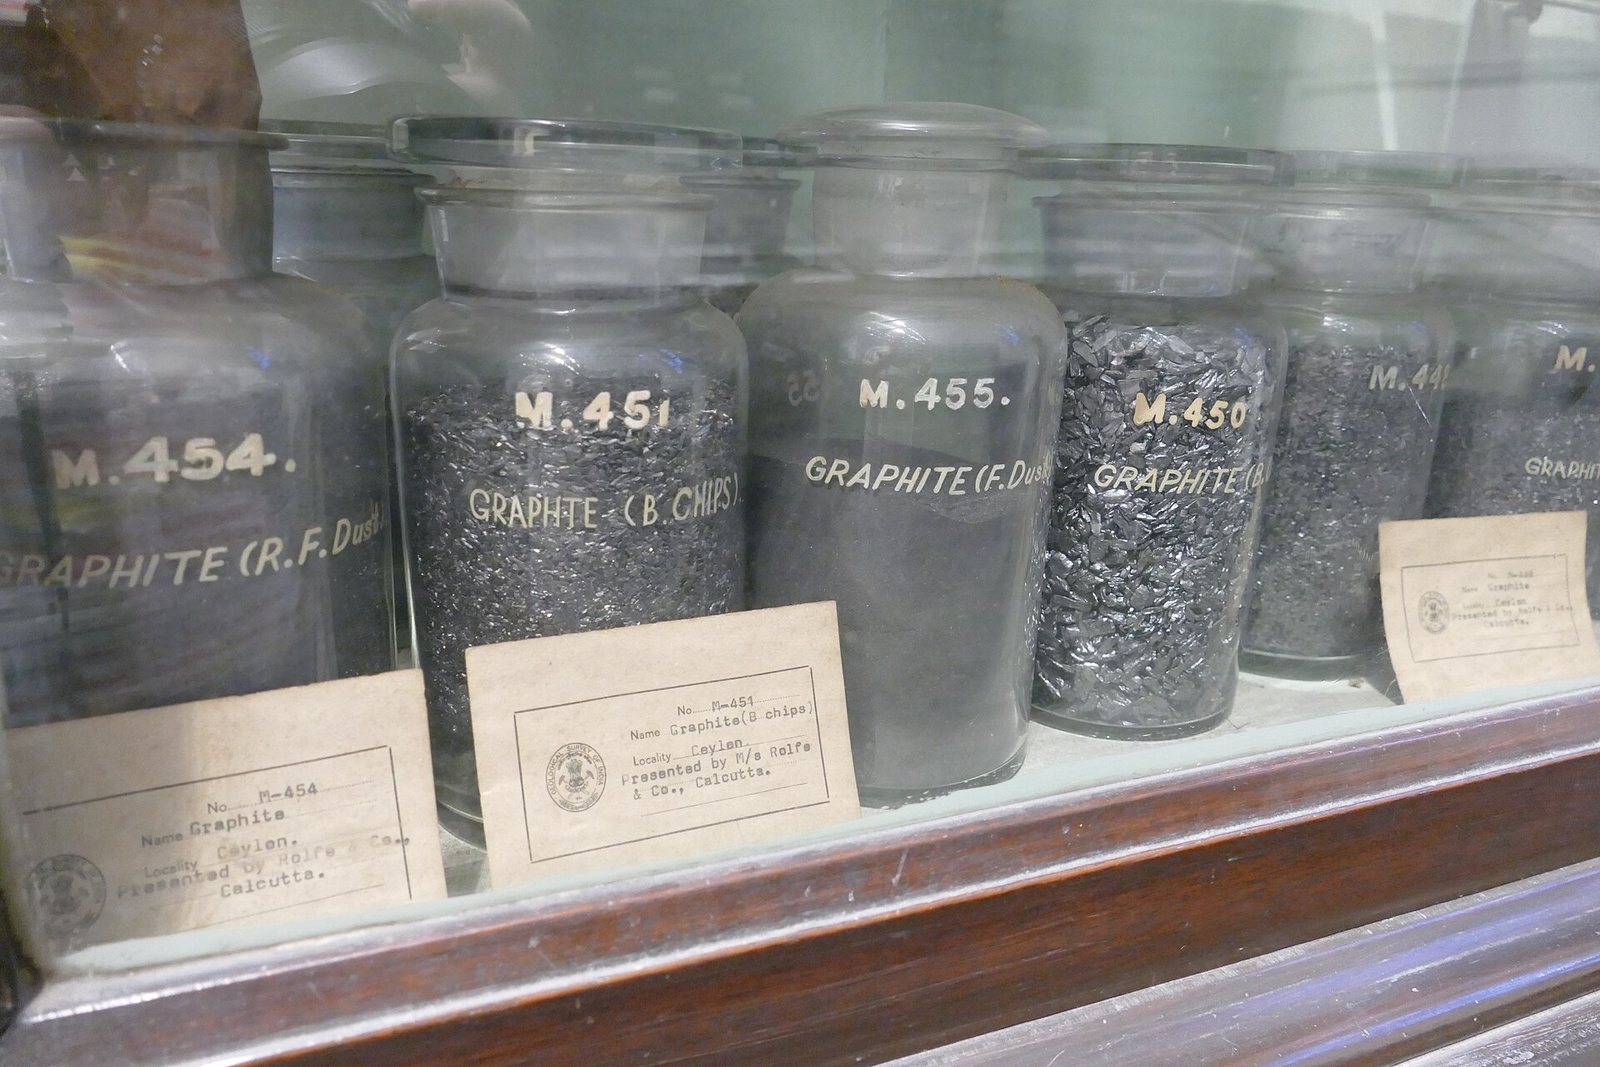
これは何か
Pure carbon in soft, slippery sheets — the same stuff as pencil lead — and the material that holds the lithium when a battery is charged.
なぜ重要なのか
Every lithium-ion cell has a graphite anode, and by weight there is more graphite in a battery than lithium. It is also the electrode that makes electric-arc steelmaking possible.
Where it is in the Earth
Graphite is a crystalline form of carbon, meaning its atoms are arranged in flat, parallel sheets held loosely together — which is why it feels slippery and leaves marks on paper. It reaches mineable concentrations through two quite different geological routes, and which route produced a deposit largely determines what the graphite looks like and what it is good for.
The more common route is metamorphic: ancient organic matter, buried deeply and subjected to intense heat and pressure over millions of years, loses its hydrogen, oxygen and other elements and recombines as pure carbon in a crystalline lattice. The result is flake graphite, found in metamorphic rocks such as schists, gneisses and marbles. These deposits tend to be large and geographically widespread; they account for the great majority of what is mined. The other route is igneous: carbon-bearing fluids moving through fractures in rock can precipitate graphite directly, producing vein or lump deposits. Sri Lanka is the world's principal source of this rarer, higher-purity vein type, which commands a notably higher price than flake, as the import value data on this page shows. A third variety, amorphous graphite, is not truly amorphous in the strict chemical sense — it is microcrystalline flake graphite so finely divided that individual crystals are invisible. It forms from coal seams that have been baked by igneous intrusions.
The reason deposits cluster where they do follows from these origins. The great metamorphic belts of eastern China, the East African coast, Brazil's ancient basement rocks, and parts of India and Russia all host the kind of deeply buried, carbon-rich sediments that metamorphism converts into flake graphite. China's concentration reflects the sheer scale of its Precambrian metamorphic terranes — the very old rock formations that cover large parts of the country's interior and north-east. East African deposits in Madagascar, Tanzania and Mozambique have attracted considerable attention because they lie within similar ancient geological provinces and carry flake sizes that suit battery applications.
Getting it out
Most graphite is mined by open-pit methods, which means removing the soil and rock sitting above the ore body in a series of descending steps called benches, then extracting the ore itself. Open-pit mining is preferred when the deposit lies close to the surface and extends broadly in area, because the economics of moving large volumes of material are far more manageable in the open air than underground. Underground mining is used where the ore body is narrow, deep, or where surface conditions make open-pit impractical; some older Chinese and Indian operations follow this pattern.
Ore grade is the single most important number governing whether a deposit can be mined at all. For flake graphite, the tables on this page note that typical run-of-mine ore contains between five and fifteen percent graphitic carbon. That means for every tonne of ore dug up, somewhere between 850 and 950 kilograms is waste rock that must be moved, crushed and disposed of. The ratio of waste to ore — called the strip ratio in open-pit mining — determines a great deal of the cost. A deposit with a higher grade moves less waste per tonne of graphite recovered, which directly affects whether it can survive periods of lower prices. Vein graphite in Sri Lanka is an exception: grades are substantially higher, which is part of why it has been mined continuously from underground workings for well over a century despite the labour-intensive nature of the method.
Unlike metals such as copper or lithium, graphite is not extracted from a chemical compound but recovered as the mineral itself. There is no smelting step required to liberate the metal from its ore; the challenge instead is separating intact graphite flakes from the surrounding rock without breaking them. Flake size matters enormously to buyers, particularly for battery applications, so mining practice is shaped as much by the need to preserve crystal integrity as by the need to move tonnes efficiently.
What pulls on it
Graphite has two distinct demand bases that operate largely independently of each other. The older and still very large use is in steel and foundry applications, principally as electrodes in electric-arc furnaces — the vessels that melt scrap steel using enormous electrical currents — and as refractory linings and lubricants in metallurgical processes. This segment has been relatively stable over decades, tied to the rate of steel production from scrap rather than from iron ore, and it consumes a different product from the battery sector: primarily synthetic graphite made from petroleum coke, or large-flake natural graphite in specific refractory applications.
The newer and faster-growing use is as the anode material in lithium-ion batteries. Every lithium-ion cell, regardless of the cathode chemistry used, requires a graphite anode, and by weight graphite is the largest single active material in the cell. The material-intensity figures on this page give concrete meaning to this: a single battery pack of the kind used in an electric vehicle requires tens of kilograms of graphite anode material. As electric vehicle production has grown, battery demand for graphite has grown with it. Consumer electronics and grid-scale energy storage add further to this pull, though the per-unit quantities involved are smaller than in vehicle applications.
For demand to shift sharply, one of two things would need to happen: either the lithium-ion battery chemistry itself would have to change — replacing graphite anodes with a material such as silicon or lithium metal — or steelmaking patterns would have to shift away from electric-arc furnace routes. Silicon anodes are an active area of research precisely because silicon holds more lithium per unit volume than graphite, but replacing graphite entirely is a different matter from blending small amounts of silicon into a graphite anode, which is already done. Battery chemistries that store energy without a graphite anode do exist — sodium-ion batteries use alternative anode materials — but their penetration into the market remains, as of the data period covered here, modest. The more immediate question for flake graphite is not whether demand will fall but whether supply can be built outside China quickly enough to track growth in battery manufacturing in other regions.
岩石中の産出箇所
全鉱石鉱物 →実際に以下を担う鉱物 graphite. 鉱床が鉱体となるのは、採掘コストを回収できるほど十分な濃度で鉱石が濃集している場合に限られる。
生産者
地図で見る →Mine production
Mine productionmetric tons 2025 (推定値) 世界合計 1,800,000 metric tons
USGS Mineral Commodity Summaries 2026 · USGS reports natural graphite only. Synthetic graphite, made by baking petroleum coke at ~3,000 C, is a separate and larger industry. · 出典 ↗
テーブルを横にスクロールすると残りの列が表示されます。
| 国 | 生産 | 世界に占める割合 |
|---|---|---|
| China | 1,400,000 | 77.8% |
| Madagascar | 80,000 | 4.4% |
| Tanzania | 75,000 | 4.2% |
| Brazil | 65,000 | 3.6% |
| Mozambique | 60,000 | 3.3% |
| Russia | 25,000 | 1.4% |
| India | 17,000 | 0.9% |
| Korea, North | 8,000 | 0.4% |
| Canada | 8,000 | 0.4% |
| Norway | 6,600 | 0.4% |
| Sri Lanka | 3,200 | 0.2% |
| Turkey | 2,200 | 0.1% |
| Ukraine | 800.0 | 0.0% |
| Mexico | 740.0 | 0.0% |
| Vietnam | 500.0 | 0.0% |
| Korea, Republic of | 500.0 | 0.0% |
| Austria | 200.0 | 0.0% |
| Germany | 140.0 | 0.0% |
| United States | Zero | — |
| 世界合計 | 1,800,000 | 100% |
「非開示」とは、個別企業のデータが特定されないようUSGSが数値を公表しなかったことを意味し、ゼロを意味するものではありません。出典が各数値を独立して丸め処理しており、「その他の国」の内訳を常に示しているわけではないため、各国の数値の合計が世界合計と一致しないことがあります。
埋蔵量の保有者
Reserves
Reservesmetric tons 2025
USGS Mineral Commodity Summaries 2026 · 出典 ↗
| 国 | 埋蔵量 | 世界に占める割合 |
|---|---|---|
| China | 100,000,000 | 32.3% |
| Brazil | 74,000,000 | 23.9% |
| Madagascar | 27,000,000 | 8.7% |
| Mozambique | 25,000,000 | 8.1% |
| Tanzania | 18,000,000 | 5.8% |
| Russia | 14,000,000 | 4.5% |
| Vietnam | 9,700,000 | 3.1% |
| India | 8,600,000 | 2.8% |
| Turkey | 6,900,000 | 2.2% |
| Canada | 5,900,000 | 1.9% |
| Mexico | 3,100,000 | 1.0% |
| Korea, North | 2,000,000 | 0.6% |
| Korea, Republic of | 1,800,000 | 0.6% |
| Sri Lanka | 1,500,000 | 0.5% |
| Norway | 600,000 | 0.2% |
| United States | s | — |
| Austria | s | — |
| Germany | s | — |
| Ukraine | s | — |
| 世界合計 | 310,000,000 | 100% |
価格
average unit value of imports, dollars per metric ton at foreign ports: Amorphous
年間平均dollars per metric ton
基準: average unit value of imports, dollars per metric ton at foreign ports: Amorphous. 以下に公表された年間平均値: USGS Mineral Commodity Summaries 2026 · 出典 ↗. これらは参照用の年間平均値であり、リアルタイムの市況相場ではない。
average unit value of imports, dollars per metric ton at foreign ports: Lump and chip (Sri Lanka)
年間平均dollars per metric ton
基準: average unit value of imports, dollars per metric ton at foreign ports: Lump and chip (Sri Lanka). 以下に公表された年間平均値: USGS Mineral Commodity Summaries 2026 · 出典 ↗. これらは参照用の年間平均値であり、リアルタイムの市況相場ではない。
average unit value of imports, dollars per metric ton at foreign ports: Flake
年間平均dollars per metric ton
基準: average unit value of imports, dollars per metric ton at foreign ports: Flake. 以下に公表された年間平均値: USGS Mineral Commodity Summaries 2026 · 出典 ↗. これらは参照用の年間平均値であり、リアルタイムの市況相場ではない。
処理・精製が行われる場所
| プラント | 種別 | ステージ | 国 | 役割 |
|---|---|---|---|---|
| CATL Ningde Plants | ギガファクトリー | コンポーネント | China | 投入 |
| Gigafactory Nevada | ギガファクトリー | コンポーネント | United States | 投入 |
用途
全エンドマーケット →| 最終市場 | そこでの機能 | 重要度 |
|---|---|---|
| Electric Vehicles | The anode — the heaviest active material in the cell | 定義 |
| Consumer Electronics | Battery anode | 定義 |
| Grid Storage | Anode | 定義 |
技術が必要とする量
| 技術 | 数量 | 建値 | 基準 |
|---|---|---|---|
| LFP Lithium-Ion Battery | 55.00–85.00 kg | per 75 kWh pack | Anode active material |
| NMC Lithium-Ion Battery Roughly 1 kg of anode material per kWh. | 50.00–80.00 kg | per 75 kWh pack | Anode active material |
Indicative range compiled from published technology studies and chemistry; verify against a manufacturer specification before use. 素材計算機で任意の規模に換算して実行 →
輸出規制
| 国 | 支配 | 適用対象 |
|---|---|---|
| China | Export licensing requirement for materials and technologies | Antimony (2024), bismuth (2025), synthesized diamond (2025), gallium (2023), germanium (2023), graphite (2023), indium (2025), magnesium materials (2024), molybdenum (2025), rare earths (2025), silver (2026), tellurium (2025), tungsten (2025), and items related to lithium batteries and artificial graphite anode materials (2025). ↗ |
| Namibia | Export ban | Ores and concentrates of cobalt, graphite, lithium, manganese, and rare earths (2023). ↗ |
USGS Mineral Commodity Summaries 2026, table 4 — controls in effect as of January 2026, excluding controls since lifted.