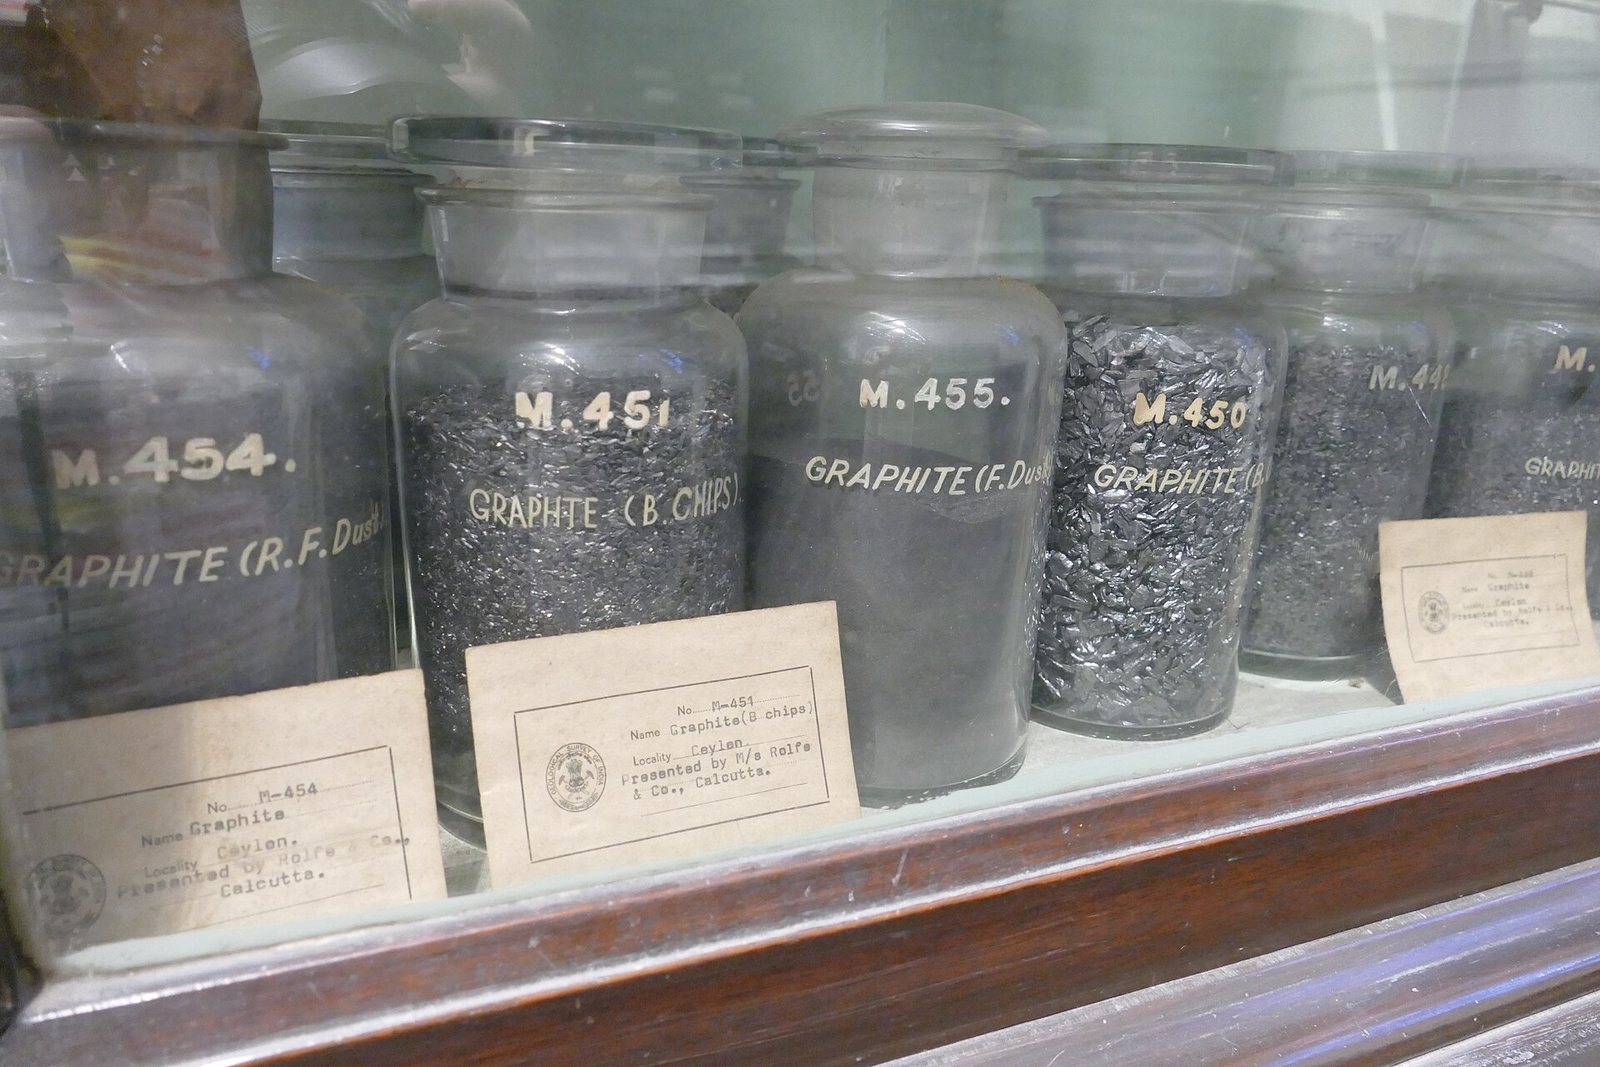
Wat is het?
Pure carbon in soft, slippery sheets — the same stuff as pencil lead — and the material that holds the lithium when a battery is charged.
Waarom is het van belang?
Every lithium-ion cell has a graphite anode, and by weight there is more graphite in a battery than lithium. It is also the electrode that makes electric-arc steelmaking possible.
Uitgebreidere geschreven secties voor dit materiaal zijn nog niet gepubliceerd. Alles hieronder is rechtstreeks afkomstig uit de brondatasets en is volledig.
Waar het in het gesteente vandaan komt
Alle ertsmineralen →Dit zijn de mineralen die daadwerkelijk graphite. Een afzetting is alleen een ertslichaam als een van beide voldoende geconcentreerd is om de winning ervan te bekostigen.
Wie het produceert
Bekijk het op een kaart →Mine production
Mine productionmetric tons 2025 (geschat) Wereldtotaal 1,800,000 metric tons
USGS Mineral Commodity Summaries 2026 · USGS reports natural graphite only. Synthetic graphite, made by baking petroleum coke at ~3,000 C, is a separate and larger industry. · bron ↗
Schuif de tabel zijwaarts voor de overige kolommen.
| Land | Productie | Aandeel van de wereld |
|---|---|---|
| China | 1,400,000 | 77.8% |
| Madagascar | 80,000 | 4.4% |
| Tanzania | 75,000 | 4.2% |
| Brazil | 65,000 | 3.6% |
| Mozambique | 60,000 | 3.3% |
| Russia | 25,000 | 1.4% |
| India | 17,000 | 0.9% |
| Korea, North | 8,000 | 0.4% |
| Canada | 8,000 | 0.4% |
| Norway | 6,600 | 0.4% |
| Sri Lanka | 3,200 | 0.2% |
| Turkey | 2,200 | 0.1% |
| Ukraine | 800.0 | 0.0% |
| Mexico | 740.0 | 0.0% |
| Vietnam | 500.0 | 0.0% |
| Korea, Republic of | 500.0 | 0.0% |
| Austria | 200.0 | 0.0% |
| Germany | 140.0 | 0.0% |
| United States | Zero | — |
| Wereldtotaal | 1,800,000 | 100% |
"Ingehouden" betekent dat de USGS het cijfer heeft onderdrukt om gegevens van een individueel bedrijf niet prijs te geven — het betekent niet nul. Landrijen tellen niet altijd op tot het wereldtotaal, omdat de bron elk cijfer afzonderlijk afrondt en niet altijd een regel "overige landen" uitsplitst.
Wie de reserves bezit
Reserves
Reservesmetric tons 2025
USGS Mineral Commodity Summaries 2026 · bron ↗
| Land | Reserves | Aandeel van de wereld |
|---|---|---|
| China | 100,000,000 | 32.3% |
| Brazil | 74,000,000 | 23.9% |
| Madagascar | 27,000,000 | 8.7% |
| Mozambique | 25,000,000 | 8.1% |
| Tanzania | 18,000,000 | 5.8% |
| Russia | 14,000,000 | 4.5% |
| Vietnam | 9,700,000 | 3.1% |
| India | 8,600,000 | 2.8% |
| Turkey | 6,900,000 | 2.2% |
| Canada | 5,900,000 | 1.9% |
| Mexico | 3,100,000 | 1.0% |
| Korea, North | 2,000,000 | 0.6% |
| Korea, Republic of | 1,800,000 | 0.6% |
| Sri Lanka | 1,500,000 | 0.5% |
| Norway | 600,000 | 0.2% |
| United States | s | — |
| Austria | s | — |
| Germany | s | — |
| Ukraine | s | — |
| Wereldtotaal | 310,000,000 | 100% |
Prijs
average unit value of imports, dollars per metric ton at foreign ports: Amorphous
Jaargemiddeldedollars per metric ton
Grondslag: average unit value of imports, dollars per metric ton at foreign ports: Amorphous. Jaargemiddelden zoals gepubliceerd in USGS Mineral Commodity Summaries 2026 · bron ↗. Dit zijn referentiejaargemiddelden, geen live marktkoers.
average unit value of imports, dollars per metric ton at foreign ports: Lump and chip (Sri Lanka)
Jaargemiddeldedollars per metric ton
Grondslag: average unit value of imports, dollars per metric ton at foreign ports: Lump and chip (Sri Lanka). Jaargemiddelden zoals gepubliceerd in USGS Mineral Commodity Summaries 2026 · bron ↗. Dit zijn referentiejaargemiddelden, geen live marktkoers.
average unit value of imports, dollars per metric ton at foreign ports: Flake
Jaargemiddeldedollars per metric ton
Grondslag: average unit value of imports, dollars per metric ton at foreign ports: Flake. Jaargemiddelden zoals gepubliceerd in USGS Mineral Commodity Summaries 2026 · bron ↗. Dit zijn referentiejaargemiddelden, geen live marktkoers.
Waar het wordt verwerkt en geraffineerd
| Installatie | Soort | Fase | Land | Rol |
|---|---|---|---|---|
| CATL Ningde Plants | Gigafabriek | Component | China | Invoer |
| Gigafactory Nevada | Gigafabriek | Component | United States | Invoer |
Waarvoor het wordt gebruikt
Alle eindmarkten →| Eindmarkt | Wat het daar doet | Belang |
|---|---|---|
| Electric Vehicles | The anode — the heaviest active material in the cell | Definiëren |
| Consumer Electronics | Battery anode | Definiëren |
| Grid Storage | Anode | Definiëren |
Hoeveel een technologie ervan nodig heeft
| Technologie | Hoeveelheid | Genoteerd | Grondslag |
|---|---|---|---|
| LFP Lithium-Ion Battery | 55.00–85.00 kg | per 75 kWh pack | Anode active material |
| NMC Lithium-Ion Battery Roughly 1 kg of anode material per kWh. | 50.00–80.00 kg | per 75 kWh pack | Anode active material |
Indicative range compiled from published technology studies and chemistry; verify against a manufacturer specification before use. Voer deze getallen op elke schaal uit in de materiaalcalculator →
Exportbeperkingen
| Land | Controle | Van toepassing op |
|---|---|---|
| China | Export licensing requirement for materials and technologies | Antimony (2024), bismuth (2025), synthesized diamond (2025), gallium (2023), germanium (2023), graphite (2023), indium (2025), magnesium materials (2024), molybdenum (2025), rare earths (2025), silver (2026), tellurium (2025), tungsten (2025), and items related to lithium batteries and artificial graphite anode materials (2025). ↗ |
| Namibia | Export ban | Ores and concentrates of cobalt, graphite, lithium, manganese, and rare earths (2023). ↗ |
USGS Mineral Commodity Summaries 2026, table 4 — controls in effect as of January 2026, excluding controls since lifted.