これは何か
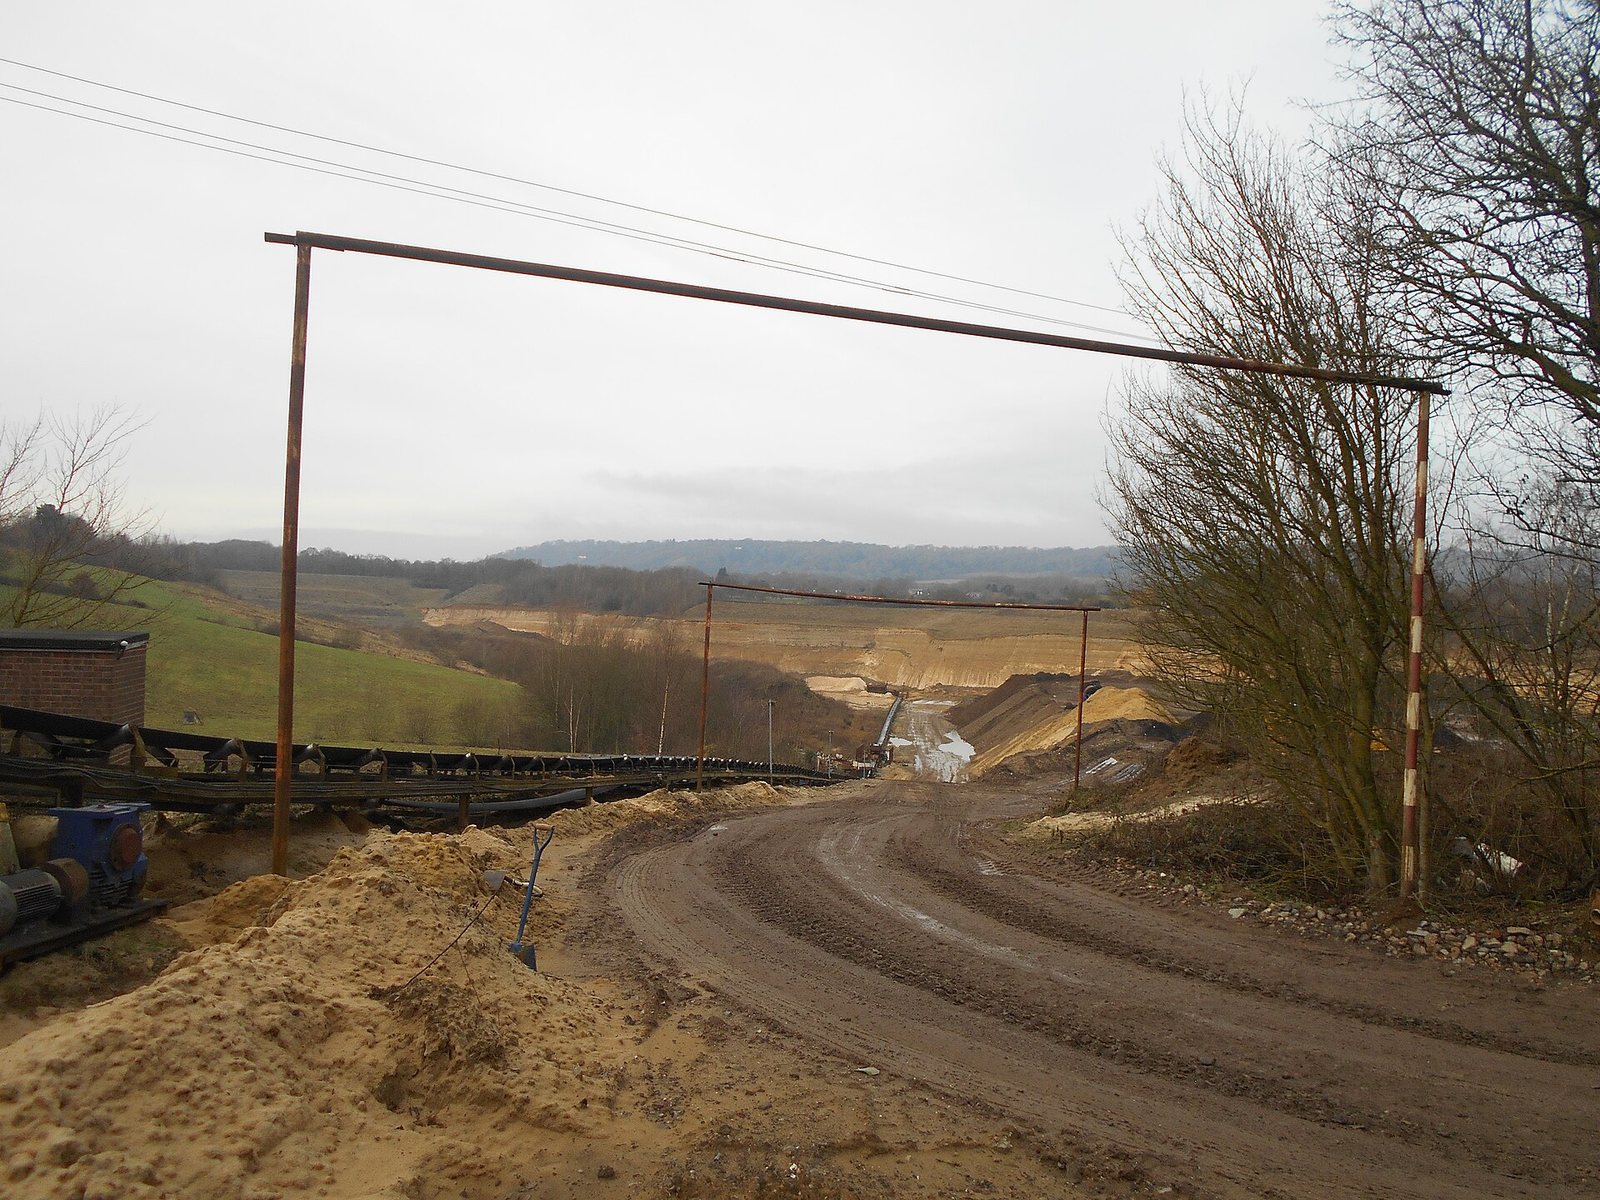
Sand selected for what it is made of rather than what size it is — nearly pure quartz, for glass, foundries and fracking.
なぜ重要なのか
Every sheet of glass, every foundry mould and every hydraulically fractured well runs on graded silica sand of a specific roundness and crush strength.
この材料に関する詳細な解説はまだ公開されていません。以下の内容はすべてソースデータセットから直接取得したものであり、完全な状態で表示されています。
生産者
地図で見る →Mine production
Mine productionthousand metric tons 2025 (推定値) 世界合計 430,000 thousand metric tons
USGS Mineral Commodity Summaries 2026 · Gross weight; distinct from construction sand and gravel, which is sold by size not composition. · 出典 ↗
テーブルを横にスクロールすると残りの列が表示されます。
| 国 | 生産 | 世界に占める割合 |
|---|---|---|
| United States | 120,000 | 27.9% |
| China | 92,000 | 21.4% |
| Netherlands | 68,000 | 15.8% |
| Other countries | 23,000 | 5.3% |
| Turkey | 14,000 | 3.3% |
| Italy | 13,000 | 3.0% |
| France | 13,000 | 3.0% |
| India | 12,000 | 2.8% |
| Germany | 9,200 | 2.1% |
| Bulgaria | 8,800 | 2.0% |
| Russia | 7,300 | 1.7% |
| Spain | 6,300 | 1.5% |
| Malaysia | 6,000 | 1.4% |
| Poland | 5,900 | 1.4% |
| Australia | 5,600 | 1.3% |
| United Kingdom | 4,700 | 1.1% |
| Argentina | 4,500 | 1.0% |
| Canada | 3,800 | 0.9% |
| Indonesia | 3,500 | 0.8% |
| Mexico | 2,700 | 0.6% |
| Saudi Arabia | 2,100 | 0.5% |
| 世界合計 | 430,000 | 100% |
「非開示」とは、個別企業のデータが特定されないようUSGSが数値を公表しなかったことを意味し、ゼロを意味するものではありません。出典が各数値を独立して丸め処理しており、「その他の国」の内訳を常に示しているわけではないため、各国の数値の合計が世界合計と一致しないことがあります。
価格
average value, dollars per metric ton
年間平均dollars per metric ton
基準: average value, dollars per metric ton. 以下に公表された年間平均値: USGS Mineral Commodity Summaries 2026 · 出典 ↗. これらは参照用の年間平均値であり、リアルタイムの市況相場ではない。