Wat is het?
Sand selected for what it is made of rather than what size it is — nearly pure quartz, for glass, foundries and fracking.
Waarom is het van belang?
Every sheet of glass, every foundry mould and every hydraulically fractured well runs on graded silica sand of a specific roundness and crush strength.
What pulls on it
Industrial sand reaches customers through three principal channels that are largely distinct from each other: glass manufacture, metal casting foundries, and hydraulic fracturing of oil and gas wells. Each sector is driven by its own economic logic, and they do not move together. Glass demand tracks construction activity, automotive production, and consumer electronics. Foundry sand demand follows manufacturing output, particularly in the automotive and heavy engineering industries. Frac sand demand is almost entirely a function of oil and gas drilling activity in countries with active unconventional hydrocarbon development, above all the United States.
The United States accounts for 120,000 thousand metric tonnes of the 430,000 thousand metric tonnes produced globally in the data year, reflecting both its large construction and manufacturing base and the scale of shale oil and gas operations that consume frac sand. China at 92,000 thousand metric tonnes and the Netherlands at 68,000 thousand metric tonnes round out the three largest producers; the Netherlands figure is striking for a small country and reflects extensive marine and fluvial sand resources exploited in part for export within Europe. The geographic pattern of demand differs from the pattern of production wherever high-purity sand must be transported long distances to reach processing clusters or end users.
Sharp changes in demand are most likely to come from the oil and gas sector. Frac sand consumption rises and falls with drilling programmes in a way that glass and foundry sand do not, because glass plants and foundries operate more or less continuously while drilling campaigns can start or stop relatively quickly. A sustained period of low oil prices suppresses drilling activity and with it frac sand demand, while a rebound has the opposite effect. Glass demand is structurally more stable but is not immune: a collapse in construction or automotive production affects it materially, as does any long-run shift in packaging preferences away from glass containers.
Where it is in the Earth
Industrial sand is, in essence, quartz that has been separated from everything else over a very long period of geological time. Quartz — silicon dioxide, SiO₂ — is one of the most chemically resistant common minerals on Earth. When granite or other silica-rich rocks weather and break down, most of the constituent minerals dissolve, clay up, or simply crumble. Quartz grains survive. Rivers carry them, wind moves them, and over millions of years the grains become progressively rounded and sorted by size as they travel. The result, when conditions are right, is a deposit that is overwhelmingly quartz, with only minor amounts of feldspar, iron oxides, or clay left to remove. Deposits of this kind typically take one of three forms: ancient aeolian (wind-blown) sandstones, fluvial (river-laid) sand bodies, or coastal and marine accumulations.
The geological age of the host rock matters considerably. The famous St. Peter Sandstone of the American Midwest, for example, is an Ordovician deposit — laid down roughly 450 million years ago — and it has had an immense amount of time to purify itself through repeated cycles of erosion and redeposition. Younger deposits can be equally pure if the source terrain was right and transport distances were long, but in general, the older and more extensively reworked a sand body is, the cleaner it tends to be. This is why usable high-purity silica sand is not found everywhere: the combination of a silica-rich source, a long transport path, and a depositional basin that preserved the material for us to mine today is geographically selective. Europe's deposits are concentrated in particular sedimentary basins; the United States has its midcontinent sandstone belt; the Netherlands draws on glacially and fluvially reworked material. Tropical regions with intense chemical weathering can also produce clean residual sands, which accounts for Malaysia's presence among significant producers.
Grain shape is partly a product of geology and partly of transport history. Grains that have been tumbled for long distances in a river or across a desert dune face become rounded and smooth. Grains that were quarried close to their parent rock retain angular edges. For most industrial uses — fracking in particular — roundness is directly tied to performance, because round grains pack uniformly and crush more predictably under stress. This means that not every clean quartz deposit is industrially equivalent; roundness and sorting must both be present, which further restricts the geography of commercially attractive deposits.
Getting it out
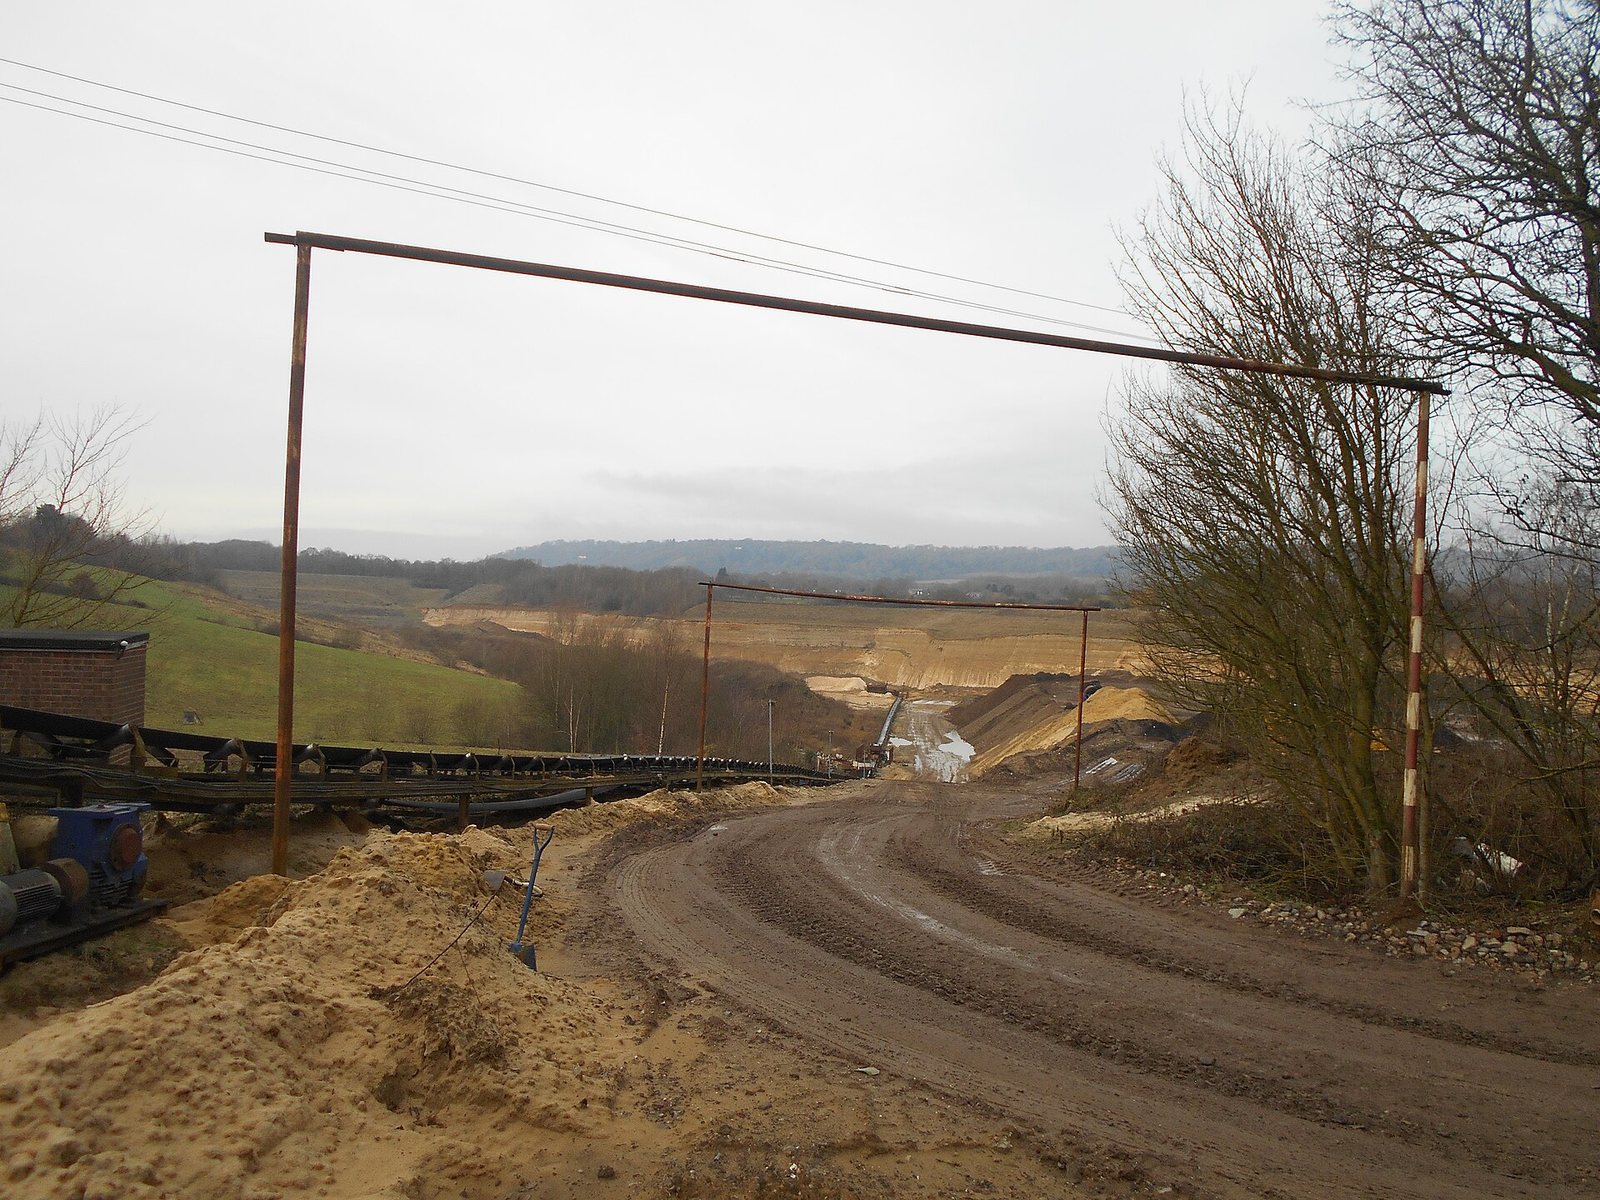
Industrial sand is almost always extracted by open-cast (open-pit) methods, because the deposits are typically loose, shallow, and laterally extensive. There is rarely an economic case for underground working when the same material lies at or near the surface over large areas. Where the deposit is a consolidated sandstone — rock rather than loose sand — drilling and blasting are used to break it, after which the material is crushed before processing. Where the deposit is already unconsolidated, mechanical excavators or hydraulic monitors (high-pressure water jets) simply disaggregate the material in place, and it is sluiced or conveyed directly to the wet plant.
The concept of ore grade is somewhat different here than in metal mining. There is no single element being extracted; instead, the specification is about purity and physical properties — how much SiO₂ is present, how much iron oxide stains the grains, what the grain-size distribution looks like, and how round the grains are. A deposit with naturally high silica content and low iron may need relatively little processing; one with more feldspar or clay contamination requires more washing and screening. Because industrial sand is a bulk commodity sold by the tonne, and because it commands a modest price per tonne relative to metals, operators are very sensitive to the ratio of overburden (the material above the deposit that must be moved and discarded) to usable sand. Thick overburden raises costs sharply and can render a deposit uneconomical even if the sand itself is high quality.
Water is a central feature of industrial sand mining wherever the deposit is loose. Wet mining — using water to mobilise and transport the sand — is common because it is efficient and because many processing steps that follow are themselves wet. In drier regions or where water is scarce, dry mining with conveyors is used instead, though this constrains the processing options downstream. The scale of individual operations can be very large, since the low value per tonne forces producers to compensate with high throughput.
Wie het produceert
Bekijk het op een kaart →Mine production
Mine productionthousand metric tons 2025 (geschat) Wereldtotaal 430,000 thousand metric tons
USGS Mineral Commodity Summaries 2026 · Gross weight; distinct from construction sand and gravel, which is sold by size not composition. · bron ↗
Schuif de tabel zijwaarts voor de overige kolommen.
| Land | Productie | Aandeel van de wereld |
|---|---|---|
| United States | 120,000 | 27.9% |
| China | 92,000 | 21.4% |
| Netherlands | 68,000 | 15.8% |
| Other countries | 23,000 | 5.3% |
| Turkey | 14,000 | 3.3% |
| Italy | 13,000 | 3.0% |
| France | 13,000 | 3.0% |
| India | 12,000 | 2.8% |
| Germany | 9,200 | 2.1% |
| Bulgaria | 8,800 | 2.0% |
| Russia | 7,300 | 1.7% |
| Spain | 6,300 | 1.5% |
| Malaysia | 6,000 | 1.4% |
| Poland | 5,900 | 1.4% |
| Australia | 5,600 | 1.3% |
| United Kingdom | 4,700 | 1.1% |
| Argentina | 4,500 | 1.0% |
| Canada | 3,800 | 0.9% |
| Indonesia | 3,500 | 0.8% |
| Mexico | 2,700 | 0.6% |
| Saudi Arabia | 2,100 | 0.5% |
| Wereldtotaal | 430,000 | 100% |
"Ingehouden" betekent dat de USGS het cijfer heeft onderdrukt om gegevens van een individueel bedrijf niet prijs te geven — het betekent niet nul. Landrijen tellen niet altijd op tot het wereldtotaal, omdat de bron elk cijfer afzonderlijk afrondt en niet altijd een regel "overige landen" uitsplitst.
Prijs
average value, dollars per metric ton
Jaargemiddeldedollars per metric ton
Grondslag: average value, dollars per metric ton. Jaargemiddelden zoals gepubliceerd in USGS Mineral Commodity Summaries 2026 · bron ↗. Dit zijn referentiejaargemiddelden, geen live marktkoers.