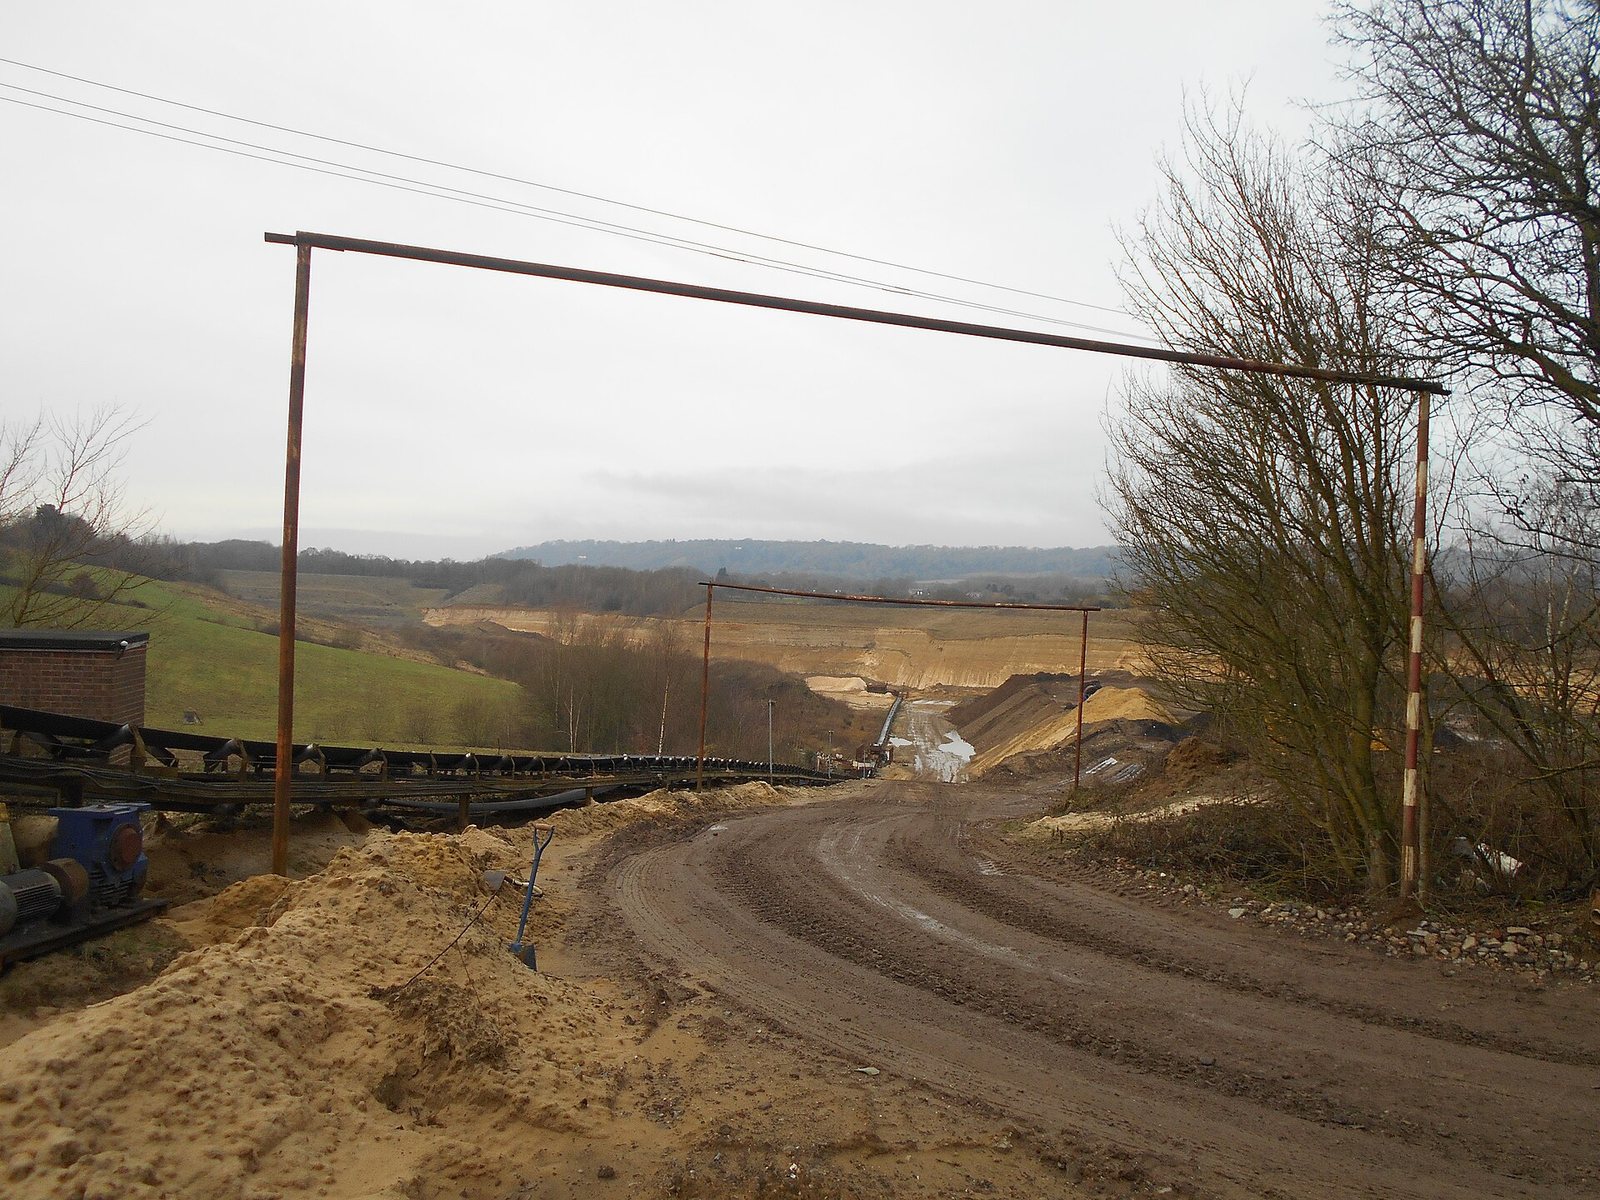
이것은 무엇인가?
Sand selected for what it is made of rather than what size it is — nearly pure quartz, for glass, foundries and fracking.
왜 중요한가?
Every sheet of glass, every foundry mould and every hydraulically fractured well runs on graded silica sand of a specific roundness and crush strength.
What pulls on it
Industrial sand reaches customers through three principal channels that are largely distinct from each other: glass manufacture, metal casting foundries, and hydraulic fracturing of oil and gas wells. Each sector is driven by its own economic logic, and they do not move together. Glass demand tracks construction activity, automotive production, and consumer electronics. Foundry sand demand follows manufacturing output, particularly in the automotive and heavy engineering industries. Frac sand demand is almost entirely a function of oil and gas drilling activity in countries with active unconventional hydrocarbon development, above all the United States.
The United States accounts for 120,000 thousand metric tonnes of the 430,000 thousand metric tonnes produced globally in the data year, reflecting both its large construction and manufacturing base and the scale of shale oil and gas operations that consume frac sand. China at 92,000 thousand metric tonnes and the Netherlands at 68,000 thousand metric tonnes round out the three largest producers; the Netherlands figure is striking for a small country and reflects extensive marine and fluvial sand resources exploited in part for export within Europe. The geographic pattern of demand differs from the pattern of production wherever high-purity sand must be transported long distances to reach processing clusters or end users.
Sharp changes in demand are most likely to come from the oil and gas sector. Frac sand consumption rises and falls with drilling programmes in a way that glass and foundry sand do not, because glass plants and foundries operate more or less continuously while drilling campaigns can start or stop relatively quickly. A sustained period of low oil prices suppresses drilling activity and with it frac sand demand, while a rebound has the opposite effect. Glass demand is structurally more stable but is not immune: a collapse in construction or automotive production affects it materially, as does any long-run shift in packaging preferences away from glass containers.
Where it is in the Earth
Industrial sand is, in essence, quartz that has been separated from everything else over a very long period of geological time. Quartz — silicon dioxide, SiO₂ — is one of the most chemically resistant common minerals on Earth. When granite or other silica-rich rocks weather and break down, most of the constituent minerals dissolve, clay up, or simply crumble. Quartz grains survive. Rivers carry them, wind moves them, and over millions of years the grains become progressively rounded and sorted by size as they travel. The result, when conditions are right, is a deposit that is overwhelmingly quartz, with only minor amounts of feldspar, iron oxides, or clay left to remove. Deposits of this kind typically take one of three forms: ancient aeolian (wind-blown) sandstones, fluvial (river-laid) sand bodies, or coastal and marine accumulations.
The geological age of the host rock matters considerably. The famous St. Peter Sandstone of the American Midwest, for example, is an Ordovician deposit — laid down roughly 450 million years ago — and it has had an immense amount of time to purify itself through repeated cycles of erosion and redeposition. Younger deposits can be equally pure if the source terrain was right and transport distances were long, but in general, the older and more extensively reworked a sand body is, the cleaner it tends to be. This is why usable high-purity silica sand is not found everywhere: the combination of a silica-rich source, a long transport path, and a depositional basin that preserved the material for us to mine today is geographically selective. Europe's deposits are concentrated in particular sedimentary basins; the United States has its midcontinent sandstone belt; the Netherlands draws on glacially and fluvially reworked material. Tropical regions with intense chemical weathering can also produce clean residual sands, which accounts for Malaysia's presence among significant producers.
Grain shape is partly a product of geology and partly of transport history. Grains that have been tumbled for long distances in a river or across a desert dune face become rounded and smooth. Grains that were quarried close to their parent rock retain angular edges. For most industrial uses — fracking in particular — roundness is directly tied to performance, because round grains pack uniformly and crush more predictably under stress. This means that not every clean quartz deposit is industrially equivalent; roundness and sorting must both be present, which further restricts the geography of commercially attractive deposits.
Getting it out
Industrial sand is almost always extracted by open-cast (open-pit) methods, because the deposits are typically loose, shallow, and laterally extensive. There is rarely an economic case for underground working when the same material lies at or near the surface over large areas. Where the deposit is a consolidated sandstone — rock rather than loose sand — drilling and blasting are used to break it, after which the material is crushed before processing. Where the deposit is already unconsolidated, mechanical excavators or hydraulic monitors (high-pressure water jets) simply disaggregate the material in place, and it is sluiced or conveyed directly to the wet plant.
The concept of ore grade is somewhat different here than in metal mining. There is no single element being extracted; instead, the specification is about purity and physical properties — how much SiO₂ is present, how much iron oxide stains the grains, what the grain-size distribution looks like, and how round the grains are. A deposit with naturally high silica content and low iron may need relatively little processing; one with more feldspar or clay contamination requires more washing and screening. Because industrial sand is a bulk commodity sold by the tonne, and because it commands a modest price per tonne relative to metals, operators are very sensitive to the ratio of overburden (the material above the deposit that must be moved and discarded) to usable sand. Thick overburden raises costs sharply and can render a deposit uneconomical even if the sand itself is high quality.
Water is a central feature of industrial sand mining wherever the deposit is loose. Wet mining — using water to mobilise and transport the sand — is common because it is efficient and because many processing steps that follow are themselves wet. In drier regions or where water is scarce, dry mining with conveyors is used instead, though this constrains the processing options downstream. The scale of individual operations can be very large, since the low value per tonne forces producers to compensate with high throughput.
Turning ore into product 수준 3
The objective of processing is to take run-of-mine sand — a mixture of grain sizes, mineralogy, and surface contaminations — and produce one or more specification products. The first stage is almost always wet screening, in which a water slurry passes over vibrating screens with calibrated apertures. This separates the material into size fractions; coarse and very fine material that falls outside any product specification is discarded as reject. The fraction retained is then washed to remove clay, silt, and soluble salts. Attrition scrubbing — a step in which the grains are abraded against each other in a high-density pulp — breaks up clay coatings that simple washing cannot dislodge.
Iron removal is the step that most distinguishes industrial sand processing from simple aggregate production. Even trace amounts of iron oxide give glass a green or brown tint, which is unacceptable for clear or optical glass. Two main techniques are used: magnetic separation, in which the slurry passes through a high-intensity magnetic field that pulls out iron-bearing mineral grains; and flotation or acid leaching, in which iron compounds on grain surfaces are chemically dissolved. High-intensity dry magnetic separation is widely used for glass-grade sand. For the most demanding optical and technical glass applications, acid scrubbing with dilute sulfuric or oxalic acid may follow to reduce iron to trace levels. Each additional purification step adds cost and generates a reject stream that must be managed.
Drying and sizing are the final steps before despatch. Wet processed sand is dewatered mechanically — on vacuum filters or in centrifuges — then thermally dried in rotary drum dryers. Dry screening follows to produce precisely graded size fractions, since different end markets specify narrow size bands. Frac sand, for instance, is sold to American Petroleum Institute mesh specifications; glass sand is sold to maximum iron oxide tolerances expressed in parts per million. A single mine and plant typically produces several distinct product grades simultaneously, and the economics of the operation depend on maximising the yield of the higher-value grades from a given tonne of feed.
Substitution and recycling 수준 3
For most applications, there is no mineral substitute for high-purity silica sand that is both technically adequate and commercially viable at scale. Glass requires silica as its primary former — the silicon-oxygen network is the glass itself — and no other abundant, cheap mineral fulfils the same structural role. Foundry sand can in principle be replaced by other refractory granular materials, including chromite sand, zircon sand, and olivine sand, all of which are used in specialist castings where silica's thermal behaviour is inadequate. However, these alternatives are substantially more expensive per tonne and their use is confined to situations where silica genuinely cannot perform. Frac sand faces a more direct substitute in manufactured ceramic proppants — small engineered spheres sintered from bauxite or kaolin — which offer higher crush strength for deeper, higher-pressure wells. Ceramic proppants are used where well conditions exceed what natural silica grains can withstand, but they carry a cost premium that limits their application to the most demanding situations.
Recycling returns some volume to the system, particularly in foundries. Spent foundry sand — the used granular material recovered after metal has been cast — can be reclaimed by thermal regeneration, in which organic binders are burned off to leave the base sand reusable. Reclaimed foundry sand is widely used within foundries and, in lower grades, in construction applications. The proportion that is actually reclaimed varies with the economics of disposal and virgin sand cost; where virgin sand is cheap and disposal costs are low, the incentive to reclaim is reduced. Frac sand, once pumped downhole, is irrecoverable. Glass sand is consumed in the melt and does not return as sand. Post-consumer glass cullet does reduce the quantity of virgin sand needed in a glass batch — adding cullet lowers the melting temperature and reduces raw material inputs — but it does not eliminate the need for virgin silica, since cullet supply is limited and its composition must be carefully controlled by glass colour and type.
Where the chain is fragile 수준 4
Industrial sand differs from most minerals discussed on this site in that geographic concentration of supply is not the primary risk. Production is spread across many countries, and the United States, China, and the Netherlands together already represent a large share of global output, with a further dispersed tail of producers in Europe, Asia, and elsewhere. No single country dominates in the way that, for example, the Democratic Republic of Congo dominates cobalt. The more operative risks are local and regulatory rather than geopolitical. Silica sand mining is land-intensive and generates dust containing crystalline silica, a regulated respiratory hazard. In many jurisdictions, permitting new mines or expanding existing ones has become a lengthy process, with lead times that can span years. This means that supply cannot respond rapidly to a demand surge, and a period of strong frac sand demand in particular can create regional tightness even where adequate geological resources exist.
The frac sand segment introduces a distinct form of supply-chain fragility through its coupling to oil and gas markets. Producers who expanded capacity during drilling booms have subsequently faced sharp demand contractions, creating cyclical overcapacity and price pressure. The price data in the table illustrates this: the average value per metric tonne moved from $40.80 in 2021 to $45.40 in 2022 and then declined in both subsequent years, reaching $36.00 in 2025. The industrial sand market cannot smooth this volatility the way a more diversified commodity might, because frac sand and glass sand are not interchangeable products, and plant configurations designed for one grade are not readily redeployed to the other.
A subtler source of uncertainty lies in reporting conventions. Industrial sand figures are compiled on a gross weight basis and are explicitly distinguished from construction sand and gravel, which is traded on size rather than composition. In practice, the boundary between the two categories is applied inconsistently across national statistical systems. Some countries report all washed and screened sand together; others disaggregate rigorously. The Netherlands figure, for instance, is large enough to prompt questions about whether all of it meets the compositional thresholds used in the United States or USGS definitions. Researchers comparing country totals should examine the underlying national methodology before drawing conclusions about relative scale, since what counts as industrial sand differs between statistical agencies.
생산 주체
지도에서 보기 →Mine production
Mine productionthousand metric tons 2025 (추정치) 세계 합계 430,000 thousand metric tons
USGS Mineral Commodity Summaries 2026 · Gross weight; distinct from construction sand and gravel, which is sold by size not composition. · 출처 ↗
나머지 열을 보려면 표를 옆으로 스크롤하십시오.
| 국가 | 생산 | 세계 비중 |
|---|---|---|
| United States | 120,000 | 27.9% |
| China | 92,000 | 21.4% |
| Netherlands | 68,000 | 15.8% |
| Other countries | 23,000 | 5.3% |
| Turkey | 14,000 | 3.3% |
| Italy | 13,000 | 3.0% |
| France | 13,000 | 3.0% |
| India | 12,000 | 2.8% |
| Germany | 9,200 | 2.1% |
| Bulgaria | 8,800 | 2.0% |
| Russia | 7,300 | 1.7% |
| Spain | 6,300 | 1.5% |
| Malaysia | 6,000 | 1.4% |
| Poland | 5,900 | 1.4% |
| Australia | 5,600 | 1.3% |
| United Kingdom | 4,700 | 1.1% |
| Argentina | 4,500 | 1.0% |
| Canada | 3,800 | 0.9% |
| Indonesia | 3,500 | 0.8% |
| Mexico | 2,700 | 0.6% |
| Saudi Arabia | 2,100 | 0.5% |
| 세계 합계 | 430,000 | 100% |
'비공개'는 USGS가 개별 기업의 데이터 노출을 막기 위해 수치를 억제한 것으로, 0을 의미하지 않습니다. 출처가 각 수치를 독립적으로 반올림하고 '기타 국가' 항목을 항상 별도로 구분하지는 않기 때문에, 국가별 합계가 세계 합계와 일치하지 않을 수 있습니다.
가격
average value, dollars per metric ton
연간 평균dollars per metric ton
기준: average value, dollars per metric ton. 다음 자료에 게재된 연간 평균 USGS Mineral Commodity Summaries 2026 · 출처 ↗. 이 수치는 기준 연간 평균값이며, 실시간 시장 가격이 아니다.