从矿石到产品,全程溯源
The Materials Atlas
材料 矿山与矿床 加工与精炼 溯源记录 供应链 企业 国家/地区 资讯
按货架浏览材料 电池材料 稀土元素 铜与电气 半导体材料 核材料 航空航天与国防 贵金属 钢铁与合金金属 工业矿物 农业矿物 能源原材料 矿石矿物 元素周期表
需求 终端市场 技术 材料计算器 地图 筛选器
学习与工具 了解术语表 数据问答AI智能体 研究与数据API ★ 已保存
关于 关于我们方法论 数据来源联系我们 免责声明
阅读选项
🧭 引导视图 初次接触矿石品位、精矿、精炼、副产品等概念?我们在您浏览时对每个术语进行解释,语言浅显易懂,数据相同,帮助内置其中。
⚡ 专家视角 您已熟悉这一行业,直接看数据即可——简洁、快速、紧凑,无附加说明。此为默认视图。
主题
界面语言
深度 材料页面分四个级别撰写。在任意材料页面选择后,系统将记住您的选择。
★ 已保存 研究与数据
Industrial Sand & Gravel

工业矿物

Industrial Sand & Gravel

Sand selected for what it is made of rather than what size it is — nearly pure quartz, for glass, foundries and fracking.

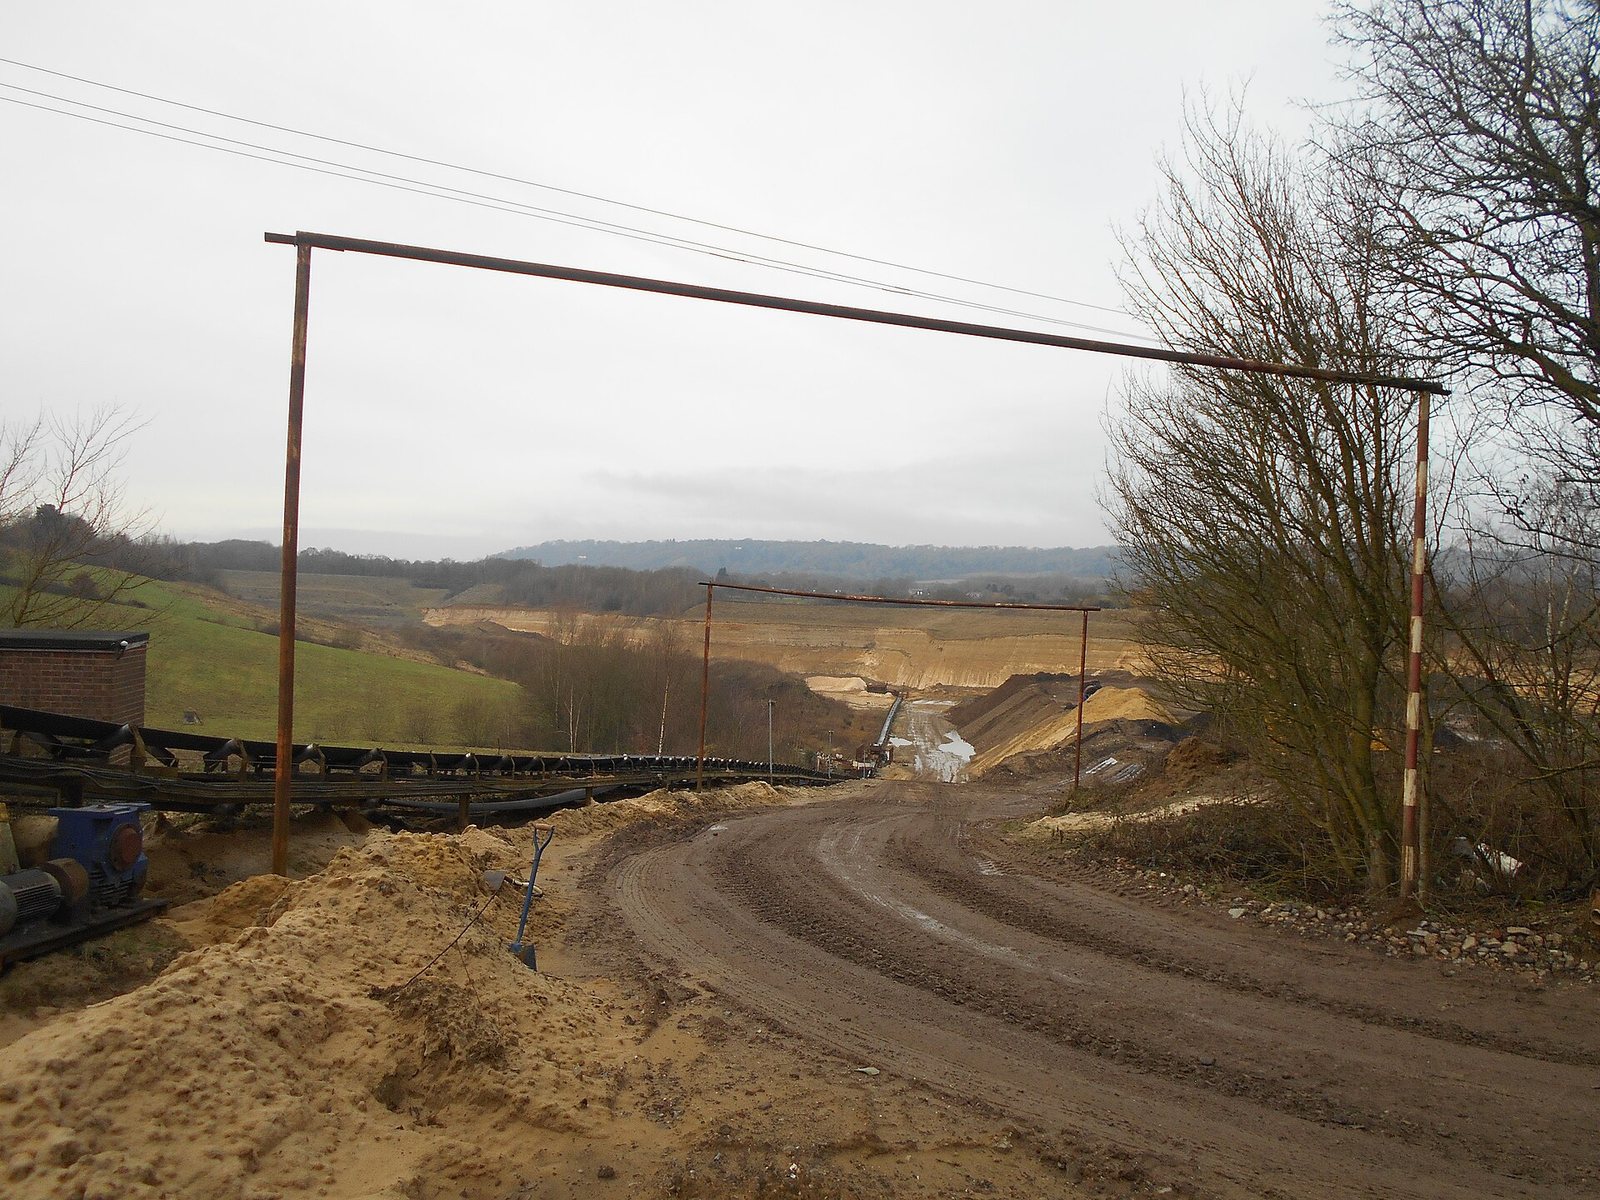
Wrotham Quarry, Addinton 07 · Simon Burchell · CC BY-SA 4.0 · Wikimedia Commons

这是什么?

Sand selected for what it is made of rather than what size it is — nearly pure quartz, for glass, foundries and fracking.

为何重要?

Every sheet of glass, every foundry mould and every hydraulically fractured well runs on graded silica sand of a specific roundness and crush strength.

What pulls on it

Industrial sand reaches customers through three principal channels that are largely distinct from each other: glass manufacture, metal casting foundries, and hydraulic fracturing of oil and gas wells. Each sector is driven by its own economic logic, and they do not move together. Glass demand tracks construction activity, automotive production, and consumer electronics. Foundry sand demand follows manufacturing output, particularly in the automotive and heavy engineering industries. Frac sand demand is almost entirely a function of oil and gas drilling activity in countries with active unconventional hydrocarbon development, above all the United States.

The United States accounts for 120,000 thousand metric tonnes of the 430,000 thousand metric tonnes produced globally in the data year, reflecting both its large construction and manufacturing base and the scale of shale oil and gas operations that consume frac sand. China at 92,000 thousand metric tonnes and the Netherlands at 68,000 thousand metric tonnes round out the three largest producers; the Netherlands figure is striking for a small country and reflects extensive marine and fluvial sand resources exploited in part for export within Europe. The geographic pattern of demand differs from the pattern of production wherever high-purity sand must be transported long distances to reach processing clusters or end users.

Sharp changes in demand are most likely to come from the oil and gas sector. Frac sand consumption rises and falls with drilling programmes in a way that glass and foundry sand do not, because glass plants and foundries operate more or less continuously while drilling campaigns can start or stop relatively quickly. A sustained period of low oil prices suppresses drilling activity and with it frac sand demand, while a rebound has the opposite effect. Glass demand is structurally more stable but is not immune: a collapse in construction or automotive production affects it materially, as does any long-run shift in packaging preferences away from glass containers.

Where it is in the Earth

Industrial sand is, in essence, quartz that has been separated from everything else over a very long period of geological time. Quartz — silicon dioxide, SiO₂ — is one of the most chemically resistant common minerals on Earth. When granite or other silica-rich rocks weather and break down, most of the constituent minerals dissolve, clay up, or simply crumble. Quartz grains survive. Rivers carry them, wind moves them, and over millions of years the grains become progressively rounded and sorted by size as they travel. The result, when conditions are right, is a deposit that is overwhelmingly quartz, with only minor amounts of feldspar, iron oxides, or clay left to remove. Deposits of this kind typically take one of three forms: ancient aeolian (wind-blown) sandstones, fluvial (river-laid) sand bodies, or coastal and marine accumulations.

The geological age of the host rock matters considerably. The famous St. Peter Sandstone of the American Midwest, for example, is an Ordovician deposit — laid down roughly 450 million years ago — and it has had an immense amount of time to purify itself through repeated cycles of erosion and redeposition. Younger deposits can be equally pure if the source terrain was right and transport distances were long, but in general, the older and more extensively reworked a sand body is, the cleaner it tends to be. This is why usable high-purity silica sand is not found everywhere: the combination of a silica-rich source, a long transport path, and a depositional basin that preserved the material for us to mine today is geographically selective. Europe's deposits are concentrated in particular sedimentary basins; the United States has its midcontinent sandstone belt; the Netherlands draws on glacially and fluvially reworked material. Tropical regions with intense chemical weathering can also produce clean residual sands, which accounts for Malaysia's presence among significant producers.

Grain shape is partly a product of geology and partly of transport history. Grains that have been tumbled for long distances in a river or across a desert dune face become rounded and smooth. Grains that were quarried close to their parent rock retain angular edges. For most industrial uses — fracking in particular — roundness is directly tied to performance, because round grains pack uniformly and crush more predictably under stress. This means that not every clean quartz deposit is industrially equivalent; roundness and sorting must both be present, which further restricts the geography of commercially attractive deposits.

Getting it out

Industrial sand is almost always extracted by open-cast (open-pit) methods, because the deposits are typically loose, shallow, and laterally extensive. There is rarely an economic case for underground working when the same material lies at or near the surface over large areas. Where the deposit is a consolidated sandstone — rock rather than loose sand — drilling and blasting are used to break it, after which the material is crushed before processing. Where the deposit is already unconsolidated, mechanical excavators or hydraulic monitors (high-pressure water jets) simply disaggregate the material in place, and it is sluiced or conveyed directly to the wet plant.

The concept of ore grade is somewhat different here than in metal mining. There is no single element being extracted; instead, the specification is about purity and physical properties — how much SiO₂ is present, how much iron oxide stains the grains, what the grain-size distribution looks like, and how round the grains are. A deposit with naturally high silica content and low iron may need relatively little processing; one with more feldspar or clay contamination requires more washing and screening. Because industrial sand is a bulk commodity sold by the tonne, and because it commands a modest price per tonne relative to metals, operators are very sensitive to the ratio of overburden (the material above the deposit that must be moved and discarded) to usable sand. Thick overburden raises costs sharply and can render a deposit uneconomical even if the sand itself is high quality.

Water is a central feature of industrial sand mining wherever the deposit is loose. Wet mining — using water to mobilise and transport the sand — is common because it is efficient and because many processing steps that follow are themselves wet. In drier regions or where water is scarce, dry mining with conveyors is used instead, though this constrains the processing options downstream. The scale of individual operations can be very large, since the low value per tonne forces producers to compensate with high throughput.

正确读取数据。 Gross weight; distinct from construction sand and gravel, which is sold by size not composition. Glass sand, foundry sand, frac sand, filtration sand.

Mine production

Mine productionthousand metric tons 2025 (估计值) 全球合计 430,000 thousand metric tons

USGS Mineral Commodity Summaries 2026 · Gross weight; distinct from construction sand and gravel, which is sold by size not composition. · 来源 ↗

横向滚动表格以查看其余列。

国家/地区产量 占全球份额
United States 120,000 27.9%
China 92,000 21.4%
Netherlands 68,000 15.8%
Other countries 23,000 5.3%
Turkey 14,000 3.3%
Italy 13,000 3.0%
France 13,000 3.0%
India 12,000 2.8%
Germany 9,200 2.1%
Bulgaria 8,800 2.0%
Russia 7,300 1.7%
Spain 6,300 1.5%
Malaysia 6,000 1.4%
Poland 5,900 1.4%
Australia 5,600 1.3%
United Kingdom 4,700 1.1%
Argentina 4,500 1.0%
Canada 3,800 0.9%
Indonesia 3,500 0.8%
Mexico 2,700 0.6%
Saudi Arabia 2,100 0.5%
全球合计 430,000100%

"未披露"表示美国地质调查局(USGS)为避免泄露单个企业数据而对该数字进行了保密处理——并不意味着数值为零。各国行数之和不一定等于世界合计,原因在于来源对每个数字单独进行四舍五入处理,且并不总是单独列出"其他国家/地区"一行。

价格

average value, dollars per metric ton

年度平均值dollars per metric ton

2021 · 40.80 高 45.40 dollars per metric ton 2025 · 36.00

基准: average value, dollars per metric ton. 年度平均值,来源: USGS Mineral Commodity Summaries 2026 · 来源 ↗. 以下为参考年度均价,非实时市场报价。

新闻动态

更多 →

KOSPI tumbles despite chip buybacks: how much support can they really provide?

Invezz02 Sep 2026

China's LNG Imports Set to Drop 18% in August as Prices Soar

OilPrice.com31 Aug 2026

China’s Grip on Erbium and Yttrium Could Choke Data-Center Growth

IEEE Spectrum26 Aug 2026

Core Power teams up with US Administration on maritime nuclear

World Nuclear News25 Aug 2026

材料

所有材料 关键矿产 稀土 电池材料 矿石矿物 元素周期表 筛选器

地层

矿山与矿床 加工与精炼 国家/地区 地图

经济体

溯源记录 供应链 终端市场 技术 企业 材料计算器

了解

了解术语表 数据问答AI智能体 研究与数据开放 API 资讯★ 已保存

关于我们

关于我们联系我们 方法论数据来源 编辑方针 隐私政策使用条款 免责声明