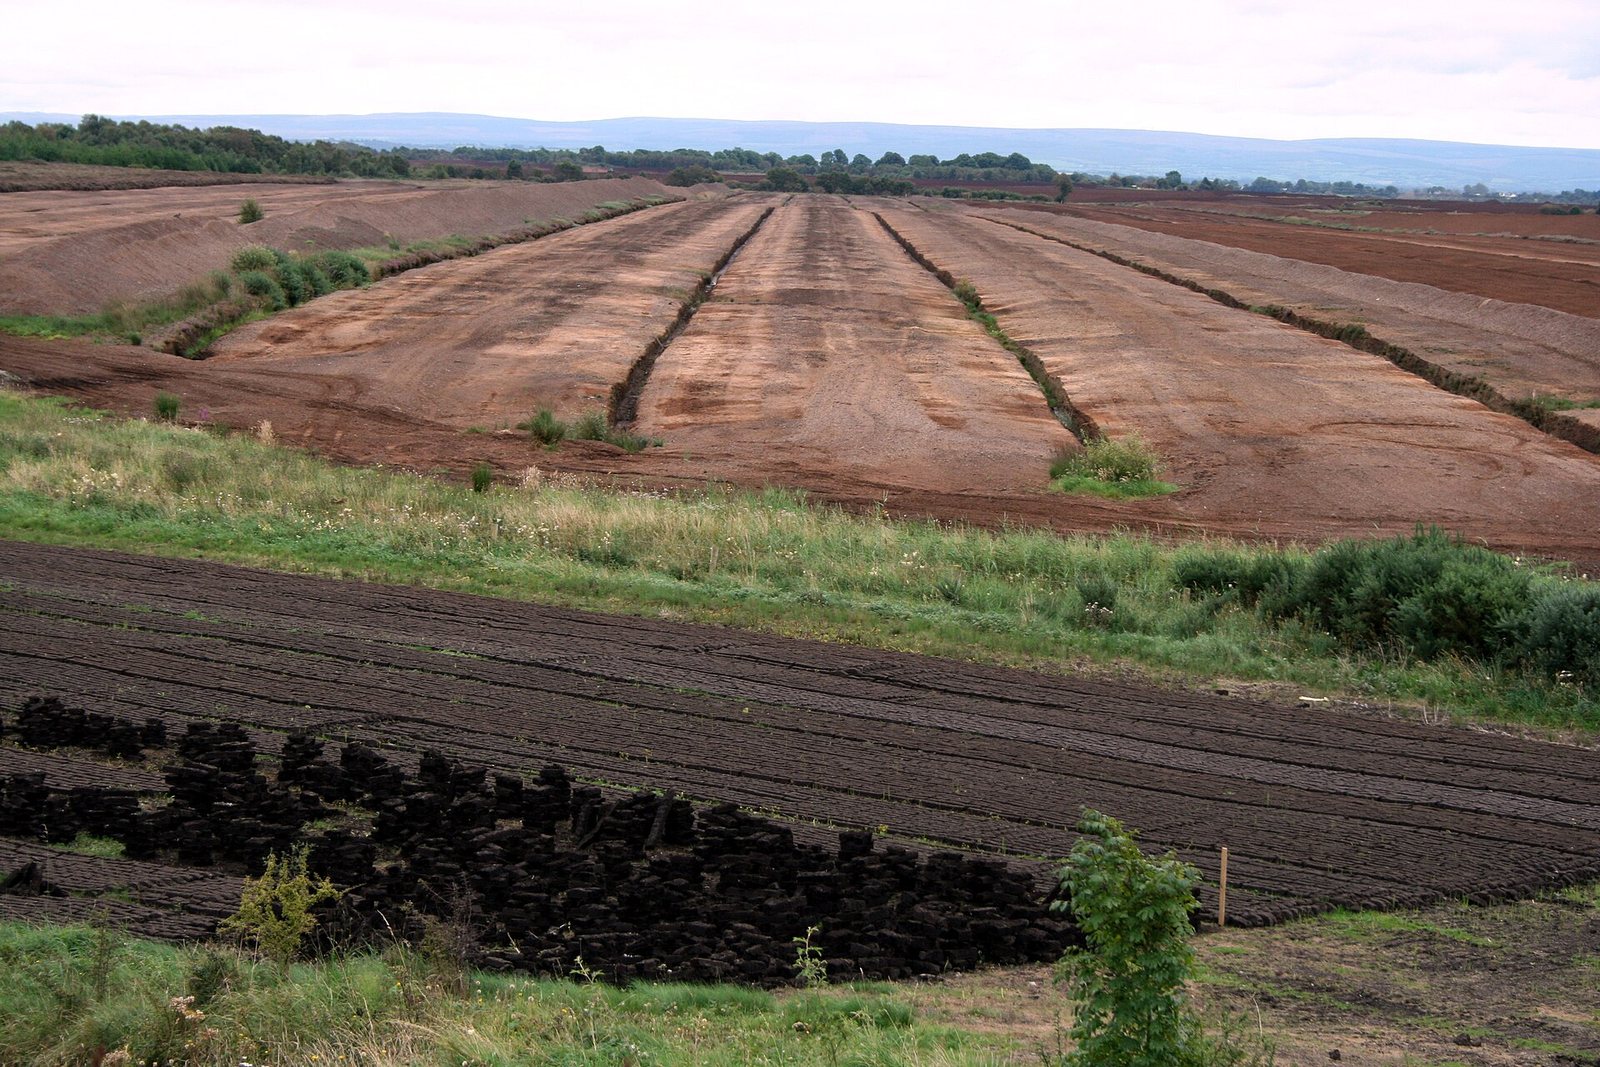
What is it?
Half-rotted plant matter from waterlogged bogs — the first stage on the road from a swamp to a coal seam.
Why does it matter?
Peatlands hold more carbon than all the world's forests, which is why cutting them for fuel and compost is now contested rather than routine.
Deeper written sections for this material have not been published yet. Everything below is drawn straight from the source datasets and is complete.
Who produces it
See it on a map →Mine production
Mine productionthousand metric tons 2025 (estimated) World total 17,000 thousand metric tons
USGS Mineral Commodity Summaries 2026 · Gross weight, air-dried basis. · source ↗
Scroll the table sideways for the remaining columns.
| Country | Production | Share of world |
|---|---|---|
| Finland | 2,500 | 14.7% |
| Canada | 2,000 | 11.8% |
| Latvia | 2,000 | 11.8% |
| Belarus | 1,800 | 10.6% |
| Sweden | 1,800 | 10.6% |
| Russia | 1,800 | 10.6% |
| Estonia | 1,100 | 6.5% |
| Other countries | 960.0 | 5.6% |
| Poland | 890.0 | 5.2% |
| Germany | 830.0 | 4.9% |
| Lithuania | 540.0 | 3.2% |
| Ukraine | 450.0 | 2.6% |
| United States | 330.0 | 1.9% |
| World total | 17,000 | 100% |
“Withheld” means the USGS suppressed the figure to avoid disclosing an individual company's data — it does not mean zero. Country rows do not always sum to the world total because the source rounds each figure independently and does not always break out an “other countries” line.
Who holds the reserves
Reserves
Reservesthousand metric tons 2025
USGS Mineral Commodity Summaries 2026 · source ↗
| Country | Reserves | Share of world |
|---|---|---|
| Finland | 6,000,000 | 46.2% |
| Belarus | 2,600,000 | 20.0% |
| Other countries | 1,400,000 | 10.8% |
| Russia | 1,000,000 | 7.7% |
| Canada | 720,000 | 5.5% |
| Estonia | 570,000 | 4.4% |
| Lithuania | 210,000 | 1.6% |
| United States | 150,000 | 1.2% |
| Latvia | 150,000 | 1.2% |
| Poland | s | — |
| Sweden | s | — |
| Ukraine | s | — |
| Germany | s | — |
| World total | 13,000,000 | 100% |
Price
average unit value, f.o.b. mine, dollars per metric ton
Annual averagedollars per metric ton
Basis: average unit value, f.o.b. mine, dollars per metric ton. Annual averages as published in USGS Mineral Commodity Summaries 2026 · source ↗. These are reference annual averages, not a live market quote.