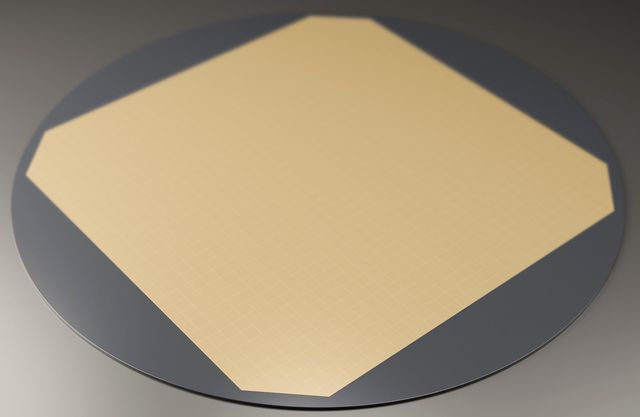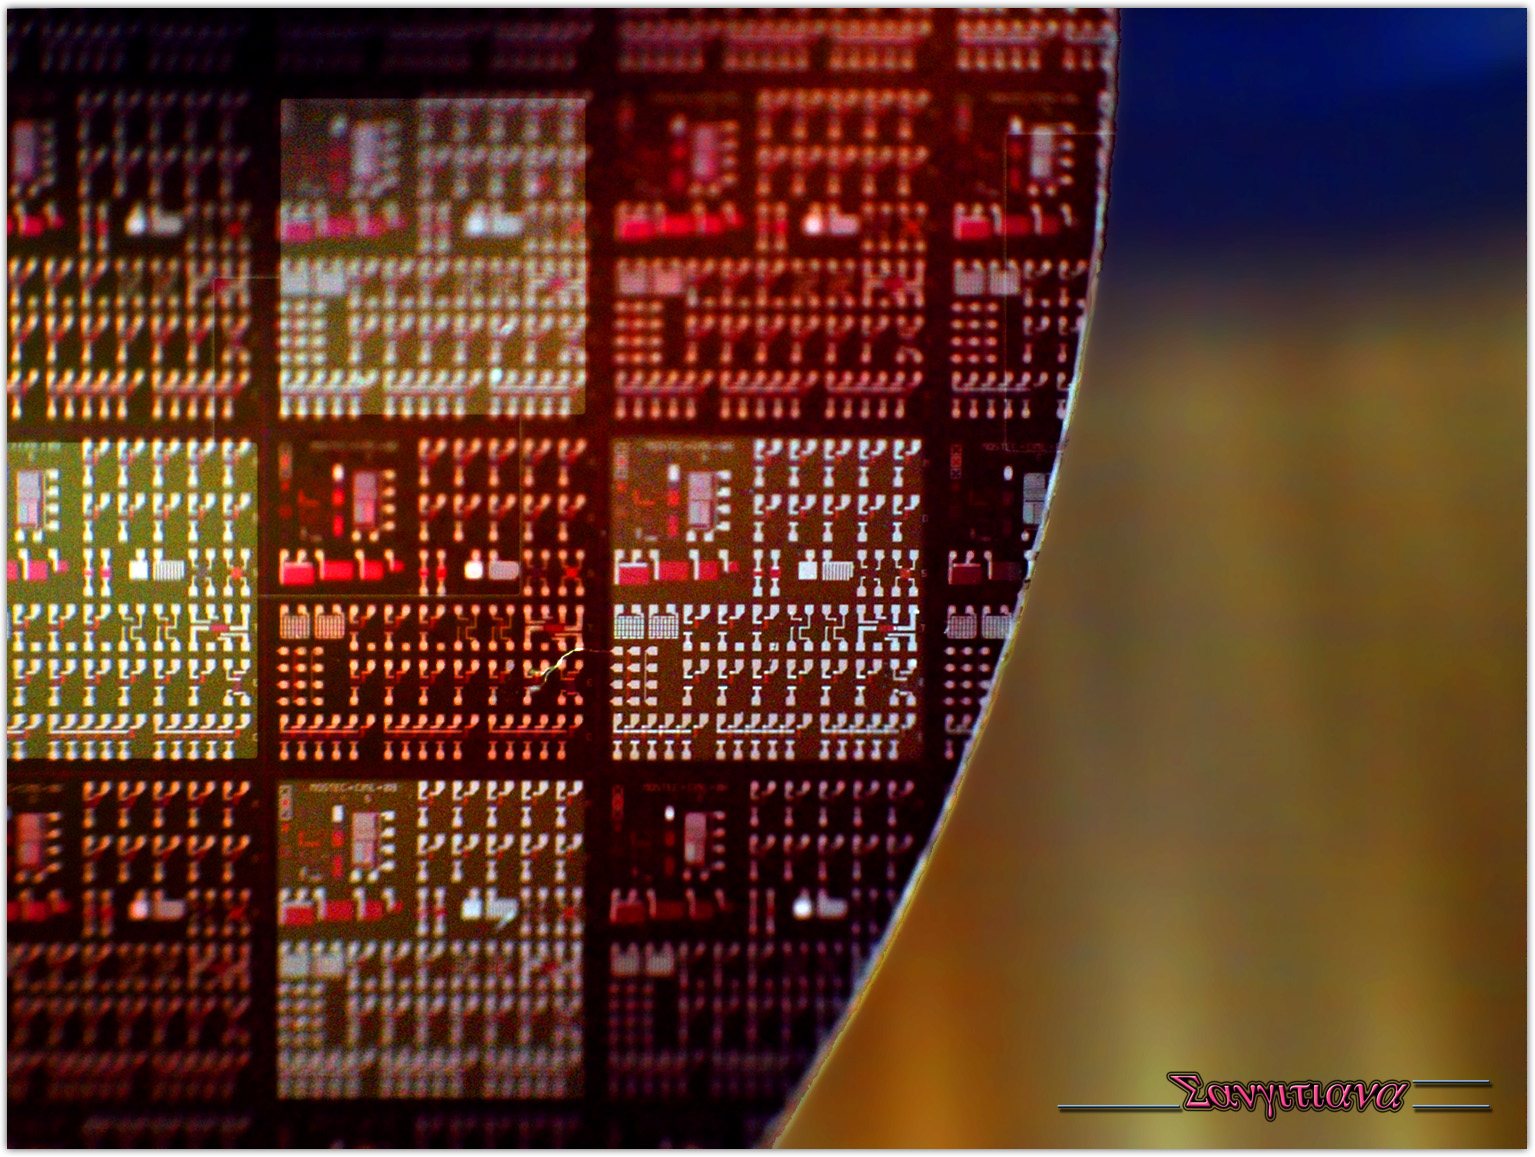
Was ist das?
The second-most-common element in the Earth's crust — ordinary sand — purified until only one atom in a billion is something else.
Warum ist das wichtig?
Every chip and almost every solar panel starts as a single silicon crystal. The purification, not the raw material, is the hard part.
Where it is in the Earth
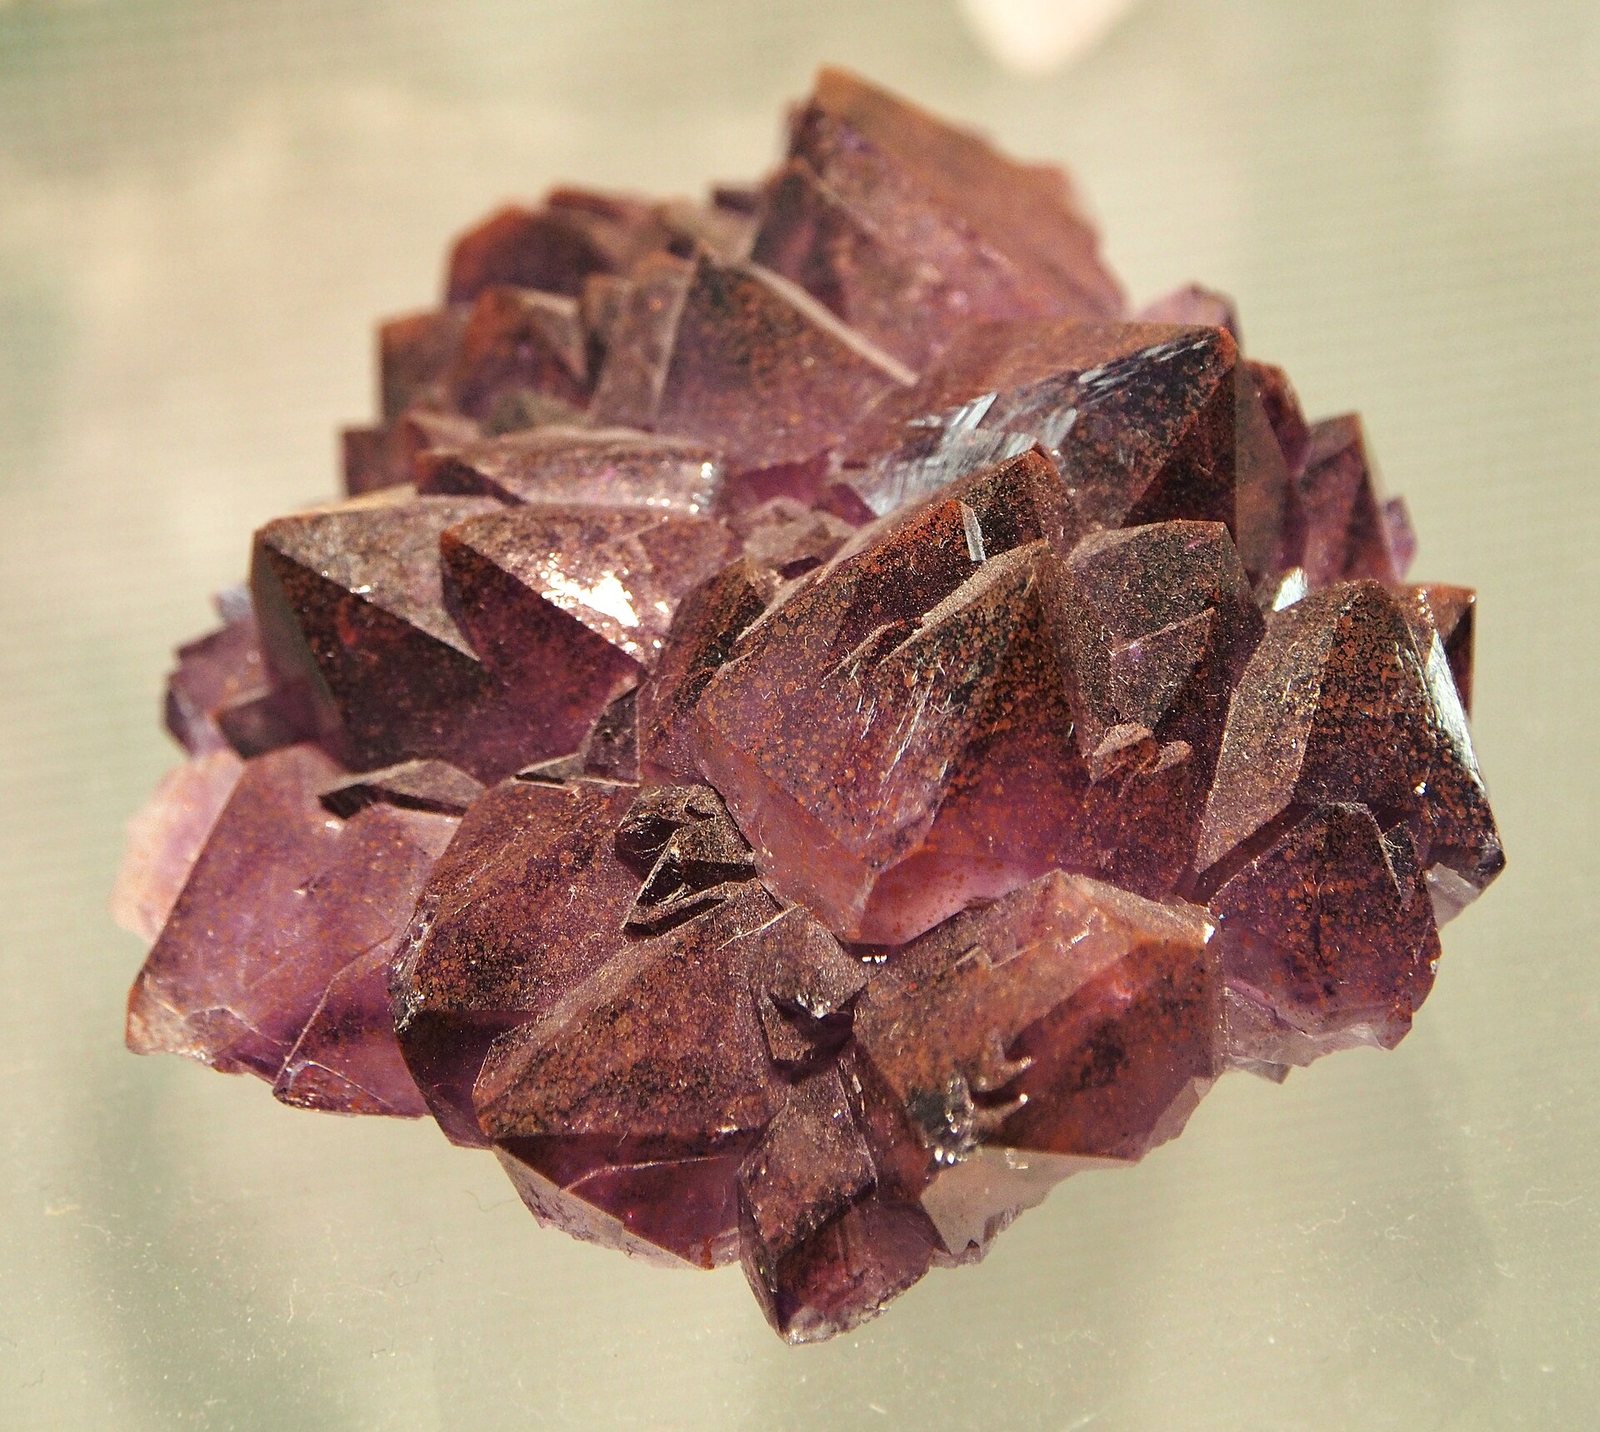
Silicon is the second most abundant element in the Earth's crust, yet it almost never occurs in pure metallic form. In nature it bonds immediately with oxygen, forming silicon dioxide (quartz) and a broad family of silicate minerals that make up the bulk of common rocks — granite, sandstone, quartzite, and many others. The sheer prevalence of silicon-bearing rock is not, on its own, what makes a deposit worth mining. What matters is finding quartz that is both physically concentrated and chemically clean enough to feed a smelter without excessive pre-treatment.
The most useful deposits are high-purity quartzite — metamorphic rock in which ancient sandy sediments were compressed and recrystallised by heat and pressure deep in the crust over hundreds of millions of years. That metamorphic process can flush out many impurities, leaving behind masses of nearly pure silicon dioxide. Major deposits of this kind are found in Norway, Brazil, and parts of North America and Australia. A separate and more abundant source is unconsolidated silica sand, formed when quartz-rich rocks weather and the grains accumulate in river beds, beaches, and dunes. Sand is cheaper to extract but typically carries more iron, aluminium, and other contaminants that must be removed before the material can be smelted into silicon metal.
The geography of silicon production therefore reflects two separate things: where clean quartz happens to be concentrated by geology, and where cheap electricity is available to run the energy-intensive smelting furnaces. A country can have excellent quartzite and still not smelt much silicon if power costs are high, or it can import ore and smelt it locally if electricity is cheap. Norway and Iceland, for instance, exploit abundant hydroelectric power. China's dominance reflects a combination of domestic quartz resources, coal-powered electricity, and decades of deliberate industrial scaling.
Getting it out
Silicon metal starts life as mined quartz or quartzite, and in almost every case the mine is an open pit. The rock sits at or near the surface in large, coherent masses, which makes underground working unnecessary and uneconomic. Quartzite is blasted with explosives, loaded onto haul trucks, and crushed at a primary crushing plant near the pit. Because quartz is the target mineral rather than a trace metal dispersed through host rock, the ore grades are high — the material mined is predominantly the useful mineral itself. There is relatively little of what miners call waste rock, the barren material that must be moved but contains nothing saleable.
The practical challenge is not extracting enough silicon dioxide but extracting it at sufficient purity. Even a quartzite body that looks uniform to the eye will contain veins and pockets of feldspar, mica, iron oxides, and other minerals. Mining therefore involves selective extraction — working those parts of the deposit that assay below certain thresholds for iron, aluminium, calcium, and other elements that would degrade the final metal. Ore that fails purity tests may be stockpiled separately or sold to lower-grade markets such as the construction aggregate or glass industries. This selectivity means the effective yield from a given volume of rock is lower than the raw abundance of quartz would suggest.
Silica sand operations follow a different pattern. The unconsolidated sand is dredged or scraped from the surface with minimal blasting, then washed and classified by particle size. Because the starting purity is lower than quartzite, sand operations typically invest more heavily in wet processing — scrubbing, magnetic separation, and flotation — before the material leaves the mine site. The result is a product still well short of silicon metal purity, requiring smelting to go further.
What pulls on it
Silicon has two largely separate demand streams that happen to start from the same element. The first is metallurgical: steel and aluminium producers use ferrosilicon and silicon metal as alloying agents to harden metals and remove dissolved oxygen, and the chemical industry uses silicon metal as the feedstock for silicone polymers and silicon tetrachloride. These markets are large, mature, and tied broadly to construction activity, automotive production, and industrial output. They do not require ultra-high purity and they absorb the bulk of the silicon produced globally by volume.
The second stream is the electronics and energy transition market, which demands polysilicon and, ultimately, single-crystal wafers. Solar photovoltaic manufacturing has become the dominant growth driver here. A crystalline silicon solar module requires between 2,500 and 4,000 kg of polysilicon per megawatt of generating capacity — a substantial physical quantity that scales directly with the rate of solar installation. Semiconductor demand, by contrast, uses far smaller quantities of silicon by weight (a single 300 mm wafer weighs roughly 125 grams, and the silicon content of finished chips is a small fraction of that), but the value embedded in each kilogram is vastly higher and the purity requirements are far more exacting.
For silicon demand to shift sharply downward in electronics, chip architectures would need to migrate away from silicon substrates entirely — something the industry has pursued incrementally with materials such as gallium nitride and silicon carbide for specific power applications, but not at a scale that threatens silicon's overall volume. In solar, a move away from crystalline silicon toward thin-film alternatives would reduce polysilicon demand, but crystalline silicon retains strong efficiency and cost advantages that have kept its market share dominant. The clearer upward pressure on demand comes from continued solar deployment, electric vehicle power electronics, and data-centre expansion, all of which draw on different parts of the silicon supply chain simultaneously.
Wo es im Gestein vorkommt
Alle Erzminerale →Dies sind die Mineralien, die tatsächlich silicon. Eine Lagerstätte ist nur dann ein Erzkörper, wenn eines der Minerale ausreichend konzentriert ist, um den Abbau wirtschaftlich zu rechtfertigen.
Wer es produziert
Auf einer Karte anzeigen →Ferrosilicon
Ferrosiliconthousand metric tons 2025 (geschätzt) Weltgesamt 5,000 thousand metric tons
USGS Mineral Commodity Summaries 2026 · USGS silicon figures are silicon CONTENT of ferrosilicon plus silicon metal, not polysilicon. · Quelle ↗
Tabelle seitwärts scrollen, um die restlichen Spalten zu sehen.
| Land | Produktion | Anteil an der Weltproduktion |
|---|---|---|
| China | 3,500 | 70.0% |
| Russia | 420.0 | 8.4% |
| Brazil | 170.0 | 3.4% |
| Norway | 150.0 | 3.0% |
| Other countries | 140.0 | 2.8% |
| Malaysia | 120.0 | 2.4% |
| Kazakhstan | 120.0 | 2.4% |
| Bhutan | 98.00 | 2.0% |
| Iceland | 72.00 | 1.4% |
| India | 59.00 | 1.2% |
| Spain | 40.00 | 0.8% |
| South Africa | 35.00 | 0.7% |
| Canada | 23.00 | 0.5% |
| France | 21.00 | 0.4% |
| United States | Withheld | — |
| Germany | Zero | — |
| Australia | Zero | — |
| Weltgesamt | 5,000 | 100% |
Silicon metal
Silicon metalthousand metric tons 2025 (geschätzt) Weltgesamt 4,600 thousand metric tons
USGS Mineral Commodity Summaries 2026 · USGS silicon figures are silicon CONTENT of ferrosilicon plus silicon metal, not polysilicon. · Quelle ↗
Tabelle seitwärts scrollen, um die restlichen Spalten zu sehen.
| Land | Produktion | Anteil an der Weltproduktion |
|---|---|---|
| China | 4,000 | 87.0% |
| Brazil | 180.0 | 3.9% |
| Norway | 130.0 | 2.8% |
| France | 68.00 | 1.5% |
| Australia | 47.00 | 1.0% |
| Other countries | 46.00 | 1.0% |
| Russia | 35.00 | 0.8% |
| Canada | 34.00 | 0.7% |
| Iceland | 16.00 | 0.3% |
| Germany | 13.00 | 0.3% |
| South Africa | 10.00 | 0.2% |
| Kazakhstan | 7.00 | 0.2% |
| Spain | 4.00 | 0.1% |
| India | Zero | — |
| Malaysia | Zero | — |
| United States | Withheld | — |
| Bhutan | Zero | — |
| Weltgesamt | 4,600 | 100% |
„Withheld" bedeutet, dass der USGS den Wert zurückgehalten hat, um keine Rückschlüsse auf Daten einzelner Unternehmen zuzulassen – er bedeutet nicht null. Die Länderwerte addieren sich nicht immer zum Weltgesamt, weil die Quelle jeden Einzelwert unabhängig rundet und eine Zeile „sonstige Länder" nicht immer ausweist.
Preis
average, cents per pound of silicon: Ferrosilicon, 75% silicon
Jahresdurchschnittcents per pound
Grundlage: average, cents per pound of silicon: Ferrosilicon, 75% silicon. Jahresdurchschnitte gemäß Veröffentlichung in USGS Mineral Commodity Summaries 2026 · Quelle ↗. Dies sind jährliche Referenzdurchschnittswerte, kein Live-Marktpreis.
average, cents per pound of silicon: Silicon metal
Jahresdurchschnittcents per pound
Grundlage: average, cents per pound of silicon: Silicon metal. Jahresdurchschnitte gemäß Veröffentlichung in USGS Mineral Commodity Summaries 2026 · Quelle ↗. Dies sind jährliche Referenzdurchschnittswerte, kein Live-Marktpreis.
Wo es aufbereitet und raffiniert wird
| Anlage | Art | Stufe | Land | Rolle |
|---|---|---|---|---|
| Samsung Pyeongtaek Campus | Halbleiterfertigung | Komponente | South Korea | Input |
| TSMC Fab 18, Tainan | Halbleiterfertigung | Komponente | Taiwan | Input |
| Hemlock Semiconductor Polysilicon Plant | Chemieanlage | Raffination | United States | Input |
| Xinjiang & Inner Mongolia Polysilicon Cluster | Chemieanlage | Raffination | China | Input |
Wofür es verwendet wird
Alle Endmärkte →| Endmarkt | Was es dort tut | Bedeutung |
|---|---|---|
| Data Centres & AI | Processors, memory and power conversion | Definition |
| Solar Power | The cell itself | Definition |
| Semiconductors | The wafer | Definition |
| Consumer Electronics | Every chip | Definition |
| Robotics & Automation | Controllers and sensors | Definition |
| Electric Vehicles | Power electronics and anode additive | Wichtig |
| Power Grids | Grid-scale power electronics and HVDC valves | Wichtig |
Wie viel eine Technologie davon benötigt
| Technologie | Menge | Angegeben | Grundlage |
|---|---|---|---|
| Crystalline Silicon Solar Module | 2,500–4,000 kg | per MW of capacity | Polysilicon in the wafers |
| Gallium Nitride Power Device | Spur | per device | Common substrate for GaN-on-Si |
| Leading-Edge Logic Chip | 0.12–0.15 kg | per 300 mm wafer | One 300 mm wafer weighs about 125 g |
Indicative range compiled from published technology studies and chemistry; verify against a manufacturer specification before use. Diese Zahlen mit beliebiger Skalierung im Materialrechner ausführen →
Grenzenübergreifend verfolgen
Alle Routen →Wo eine Sendung dieses Materials tatsächlich hingeht — jedes Land, jeder Verwahrer und was bei jedem Schritt zurückbleibt.
A quarry in North Carolina to the chip in your phone The most valuable sand on Earth, and almost all of it comes from one small district.