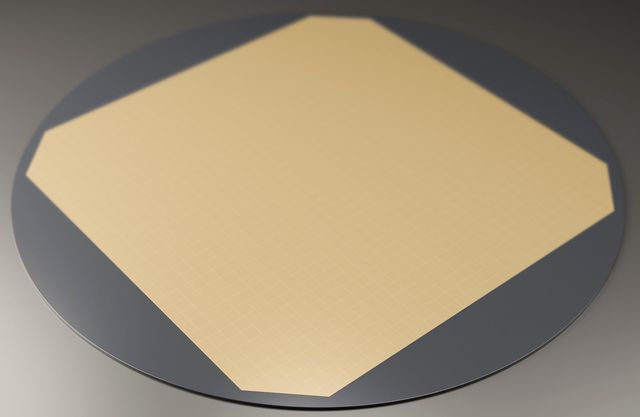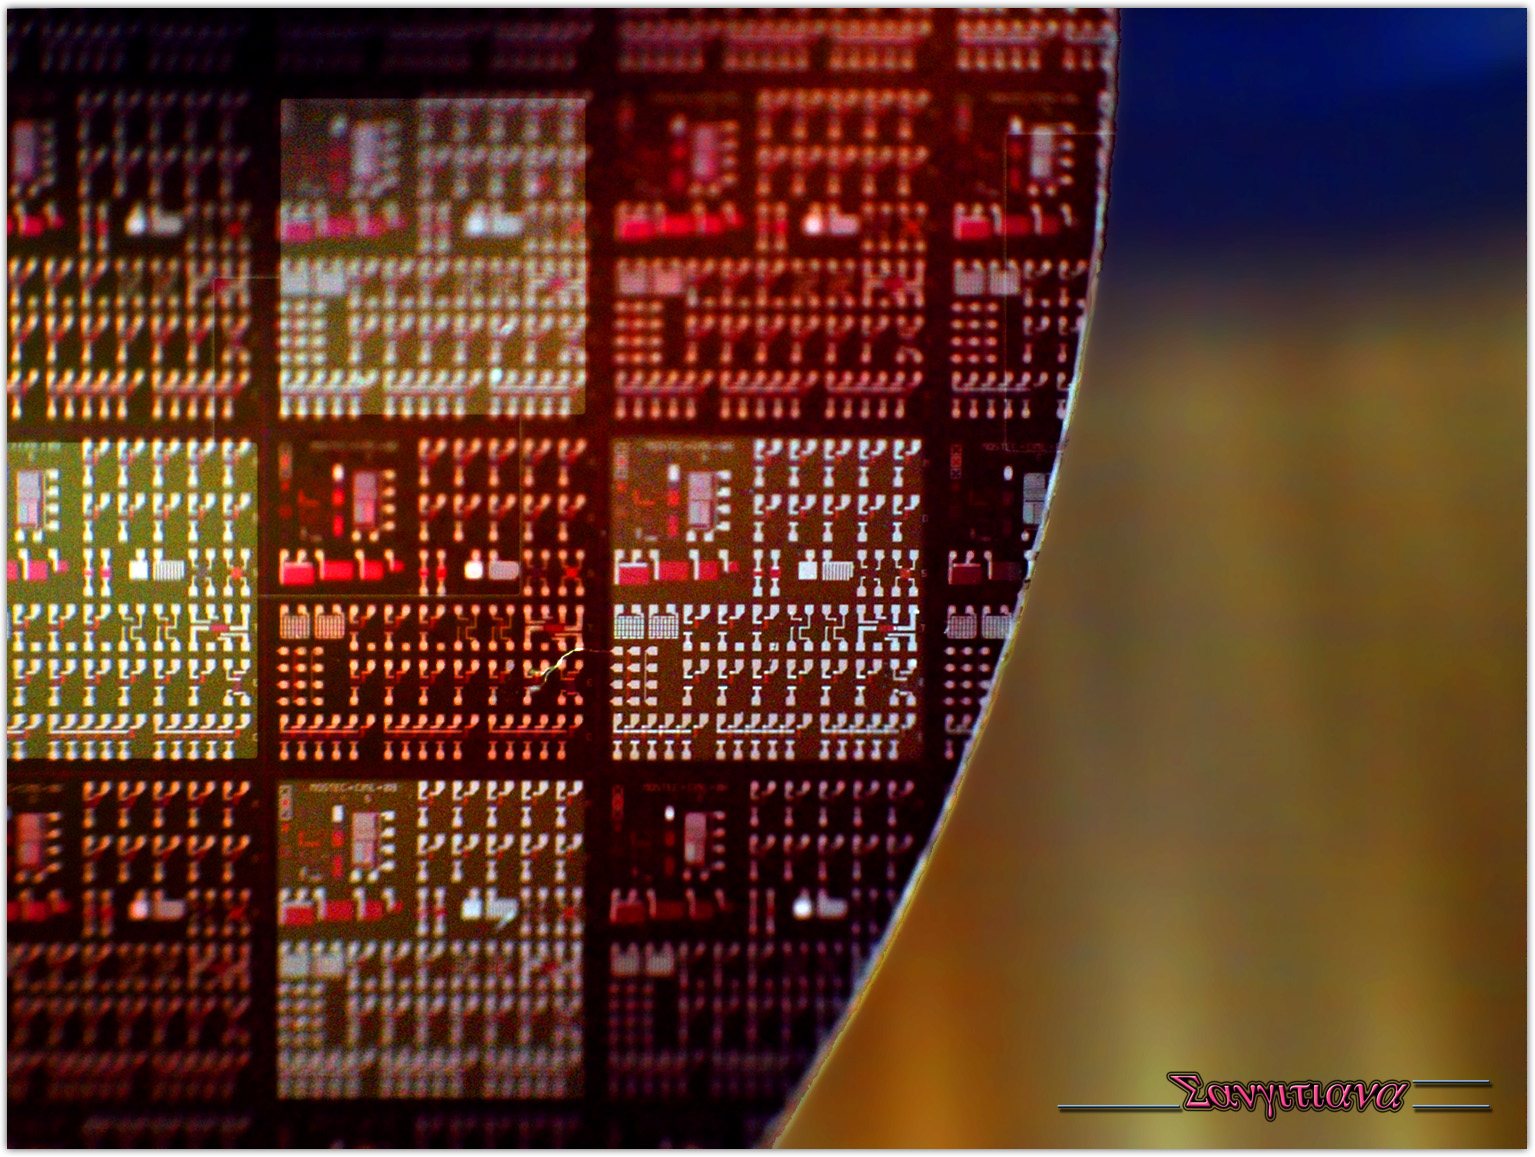
Apa ini?
The second-most-common element in the Earth's crust — ordinary sand — purified until only one atom in a billion is something else.
Mengapa ini penting?
Every chip and almost every solar panel starts as a single silicon crystal. The purification, not the raw material, is the hard part.
Where it is in the Earth
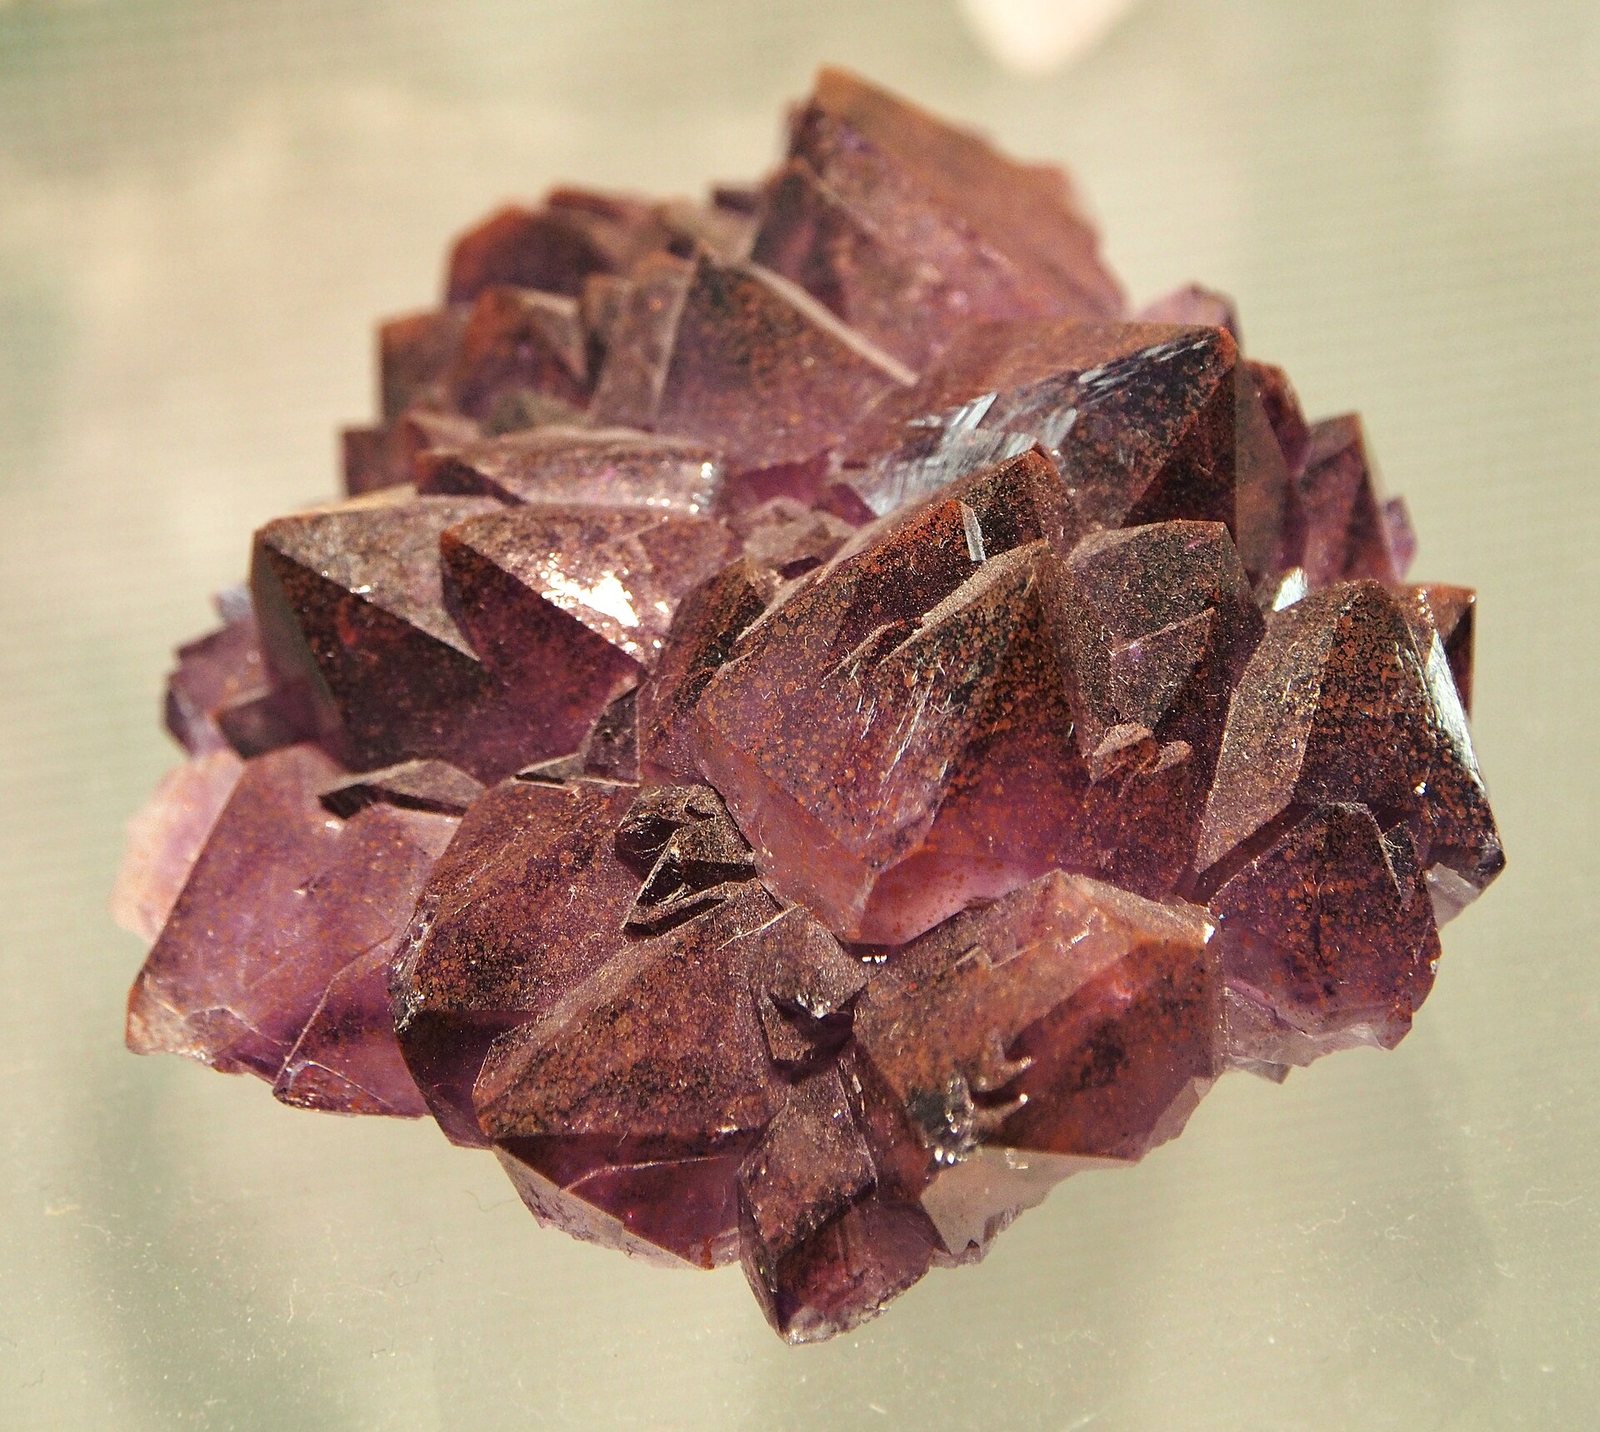
Silicon is the second most abundant element in the Earth's crust, yet it almost never occurs in pure metallic form. In nature it bonds immediately with oxygen, forming silicon dioxide (quartz) and a broad family of silicate minerals that make up the bulk of common rocks — granite, sandstone, quartzite, and many others. The sheer prevalence of silicon-bearing rock is not, on its own, what makes a deposit worth mining. What matters is finding quartz that is both physically concentrated and chemically clean enough to feed a smelter without excessive pre-treatment.
The most useful deposits are high-purity quartzite — metamorphic rock in which ancient sandy sediments were compressed and recrystallised by heat and pressure deep in the crust over hundreds of millions of years. That metamorphic process can flush out many impurities, leaving behind masses of nearly pure silicon dioxide. Major deposits of this kind are found in Norway, Brazil, and parts of North America and Australia. A separate and more abundant source is unconsolidated silica sand, formed when quartz-rich rocks weather and the grains accumulate in river beds, beaches, and dunes. Sand is cheaper to extract but typically carries more iron, aluminium, and other contaminants that must be removed before the material can be smelted into silicon metal.
The geography of silicon production therefore reflects two separate things: where clean quartz happens to be concentrated by geology, and where cheap electricity is available to run the energy-intensive smelting furnaces. A country can have excellent quartzite and still not smelt much silicon if power costs are high, or it can import ore and smelt it locally if electricity is cheap. Norway and Iceland, for instance, exploit abundant hydroelectric power. China's dominance reflects a combination of domestic quartz resources, coal-powered electricity, and decades of deliberate industrial scaling.
Getting it out
Silicon metal starts life as mined quartz or quartzite, and in almost every case the mine is an open pit. The rock sits at or near the surface in large, coherent masses, which makes underground working unnecessary and uneconomic. Quartzite is blasted with explosives, loaded onto haul trucks, and crushed at a primary crushing plant near the pit. Because quartz is the target mineral rather than a trace metal dispersed through host rock, the ore grades are high — the material mined is predominantly the useful mineral itself. There is relatively little of what miners call waste rock, the barren material that must be moved but contains nothing saleable.
The practical challenge is not extracting enough silicon dioxide but extracting it at sufficient purity. Even a quartzite body that looks uniform to the eye will contain veins and pockets of feldspar, mica, iron oxides, and other minerals. Mining therefore involves selective extraction — working those parts of the deposit that assay below certain thresholds for iron, aluminium, calcium, and other elements that would degrade the final metal. Ore that fails purity tests may be stockpiled separately or sold to lower-grade markets such as the construction aggregate or glass industries. This selectivity means the effective yield from a given volume of rock is lower than the raw abundance of quartz would suggest.
Silica sand operations follow a different pattern. The unconsolidated sand is dredged or scraped from the surface with minimal blasting, then washed and classified by particle size. Because the starting purity is lower than quartzite, sand operations typically invest more heavily in wet processing — scrubbing, magnetic separation, and flotation — before the material leaves the mine site. The result is a product still well short of silicon metal purity, requiring smelting to go further.
What pulls on it
Silicon has two largely separate demand streams that happen to start from the same element. The first is metallurgical: steel and aluminium producers use ferrosilicon and silicon metal as alloying agents to harden metals and remove dissolved oxygen, and the chemical industry uses silicon metal as the feedstock for silicone polymers and silicon tetrachloride. These markets are large, mature, and tied broadly to construction activity, automotive production, and industrial output. They do not require ultra-high purity and they absorb the bulk of the silicon produced globally by volume.
The second stream is the electronics and energy transition market, which demands polysilicon and, ultimately, single-crystal wafers. Solar photovoltaic manufacturing has become the dominant growth driver here. A crystalline silicon solar module requires between 2,500 and 4,000 kg of polysilicon per megawatt of generating capacity — a substantial physical quantity that scales directly with the rate of solar installation. Semiconductor demand, by contrast, uses far smaller quantities of silicon by weight (a single 300 mm wafer weighs roughly 125 grams, and the silicon content of finished chips is a small fraction of that), but the value embedded in each kilogram is vastly higher and the purity requirements are far more exacting.
For silicon demand to shift sharply downward in electronics, chip architectures would need to migrate away from silicon substrates entirely — something the industry has pursued incrementally with materials such as gallium nitride and silicon carbide for specific power applications, but not at a scale that threatens silicon's overall volume. In solar, a move away from crystalline silicon toward thin-film alternatives would reduce polysilicon demand, but crystalline silicon retains strong efficiency and cost advantages that have kept its market share dominant. The clearer upward pressure on demand comes from continued solar deployment, electric vehicle power electronics, and data-centre expansion, all of which draw on different parts of the silicon supply chain simultaneously.
Turning ore into product Tingkat 3
The gap between mined quartz and usable silicon spans several distinct stages, each carrying its own losses and energy costs. The first transformation is smelting in a submerged-arc electric furnace. Crushed quartzite is mixed with carbon reductants — typically coal, coke, and wood chips — and heated to temperatures above silicon's melting point of 1414 °C. The carbon strips the oxygen from silicon dioxide, leaving liquid silicon metal that pools at the furnace base and is tapped off periodically. The product at this stage is metallurgical-grade silicon, running at roughly 99% purity. The furnace process is electrically intensive; electricity typically represents the largest single cost component in silicon smelting, which explains why production concentrates in regions with low-cost power.
Metallurgical-grade silicon is the commodity form traded for use in aluminium alloys, silicones, and chemical intermediates. Semiconductor and solar applications demand far higher purity, and reaching it requires a separate chemical route. The dominant industrial process is the Siemens process: metallurgical silicon is first reacted with hydrogen chloride gas to form trichlorosilane (a volatile liquid), which is then purified by fractional distillation — the same basic principle used to refine crude oil into fractions, but applied to a gas-phase system at very high precision. The purified trichlorosilane is then decomposed at high temperature onto heated silicon rods, depositing pure silicon as a solid. The resulting polysilicon can reach purity levels of 99.9999999% — nine nines, in industry shorthand — with impurity concentrations measured in parts per billion. This stage is chemically complex, chlorine-intensive, and produces significant quantities of by-product chlorosilane streams that must be recovered or disposed of.
For semiconductor wafers, polysilicon undergoes a further step: the Czochralski process, in which a single crystal seed is slowly pulled from a melt of molten polysilicon, growing a cylindrical ingot with a perfectly ordered atomic lattice. The ingot is then sliced into wafers using wire saws, and a meaningful fraction of the polysilicon is lost as fine silicon powder — kerf — during cutting. Each subsequent stage of processing adds value but also introduces yield losses; the USGS figures shown in the production table cover only the upstream silicon metal and ferrosilicon output and do not capture the polysilicon, ingot, or wafer stages, which are tracked separately by industry bodies and national semiconductor associations.
Substitution and recycling Tingkat 3
In metallurgical uses, silicon's role as a deoxidiser and alloying element in steel and aluminium has no close single substitute — manganese can serve some overlapping functions, and aluminium itself is sometimes used as a deoxidiser in steelmaking, but the properties silicon imparts to alloys are distinctive enough that reformulating around its absence would require significant changes to materials specifications across many industries. Silicone chemistry is similarly dependent on silicon as its backbone element; there is no equivalent polymer family built from a different element that replicates silicone's combination of thermal stability, electrical insulation, and flexibility.
In semiconductor applications, gallium arsenide, silicon carbide, and gallium nitride each occupy niches where they outperform silicon — high-frequency radio applications, high-voltage power switching, and high-temperature environments respectively. These materials have been commercially available for decades, yet silicon retains the majority of semiconductor volume because it is cheaper to process, benefits from an enormous accumulated manufacturing base, and performs adequately across the widest range of applications. Substitution happens at the margins, not in bulk. For solar cells, perovskite materials have attracted sustained research interest as potential replacements or complements, but have not yet achieved the combination of efficiency, stability, and manufacturable cost that would allow them to displace crystalline silicon at scale.
Recycling of silicon metal and polysilicon is limited in practice. Silicon wafers embedded in finished chips or solar modules are difficult to recover in a form that can be re-used at semiconductor grade: contamination from encapsulants, metals, and dopants means that end-of-life silicon typically can only be recycled back into lower-grade applications such as metallurgical silicon or silicone feedstocks. Some kerf — the fine silicon powder lost during wafer slicing — is recovered and recycled within the supply chain, and silicon from rejected or broken wafers can re-enter the polysilicon melt if its purity profile is acceptable. But these flows are modest relative to primary production, and the energy cost of re-purifying contaminated silicon to electronic grade is only marginally less than producing fresh polysilicon from metallurgical feedstock.
Where the chain is fragile Tingkat 4
The concentration figures in the production table require careful reading. China accounts for approximately 4,000 thousand metric tonnes of silicon output in the USGS estimate — a share of world production that the USGS itself characterises as 87%. That concentration applies to both metallurgical-grade silicon and, more acutely, to polysilicon, where China's Xinjiang and Inner Mongolia clusters represent a large fraction of global capacity. The USGS unit basis used for the world production figures covers silicon content of ferrosilicon and silicon metal; it does not include polysilicon, which is tracked under different reporting frameworks. This means the production table understates Chinese influence over the semiconductor and solar supply chains, since polysilicon is the form that those chains actually consume.
The polysilicon stage is a particular bottleneck because it is capital-intensive, chemically complex, and slow to build. A new polysilicon plant requires years from investment decision to first production, and the process chemistry involves chlorine handling at scale, which creates both regulatory and siting challenges in many jurisdictions. The Hemlock Semiconductor plant listed in the processing table is one of the few significant polysilicon producers outside Asia, but its capacity is modest relative to Chinese output. The result is that even if quartzite mining and metallurgical smelting could be rapidly expanded outside China, the conversion of metallurgical silicon into the polysilicon that solar and semiconductor fabs actually need remains geographically concentrated in ways that the upstream production figures do not fully reveal.
A further reporting complexity is that published figures for silicon diverge significantly depending on whether the source is counting silicon metal, ferrosilicon, polysilicon, or wafers, and whether it is reporting on a silicon-content basis or a product-weight basis. The USGS explicitly states that its figures reflect silicon content of ferrosilicon plus silicon metal, not polysilicon — a distinction that matters when comparing USGS data with figures from the International Energy Agency or semiconductor industry associations, which focus on the downstream purified forms. Analysts working across these datasets should verify the unit basis before drawing comparisons, as the apparent production of a given country can differ substantially between sources depending on which part of the processing chain each source is covering.
Dari mana asalnya di dalam batuan
Semua mineral bijih →Inilah mineral yang sesungguhnya menjadi pembawa silicon. Suatu endapan hanya menjadi badan bijih jika salah satunya cukup terkonsentrasi untuk menutup biaya penambangannya.
Siapa yang memproduksinya
Lihat di peta →Ferrosilicon
Ferrosiliconthousand metric tons 2025 (estimasi) Total dunia 5,000 thousand metric tons
USGS Mineral Commodity Summaries 2026 · USGS silicon figures are silicon CONTENT of ferrosilicon plus silicon metal, not polysilicon. · sumber ↗
Gulir tabel ke samping untuk melihat kolom-kolom yang tersisa.
| Negara | Produksi | Pangsa dunia |
|---|---|---|
| China | 3,500 | 70.0% |
| Russia | 420.0 | 8.4% |
| Brazil | 170.0 | 3.4% |
| Norway | 150.0 | 3.0% |
| Other countries | 140.0 | 2.8% |
| Malaysia | 120.0 | 2.4% |
| Kazakhstan | 120.0 | 2.4% |
| Bhutan | 98.00 | 2.0% |
| Iceland | 72.00 | 1.4% |
| India | 59.00 | 1.2% |
| Spain | 40.00 | 0.8% |
| South Africa | 35.00 | 0.7% |
| Canada | 23.00 | 0.5% |
| France | 21.00 | 0.4% |
| United States | Withheld | — |
| Germany | Zero | — |
| Australia | Zero | — |
| Total dunia | 5,000 | 100% |
Silicon metal
Silicon metalthousand metric tons 2025 (estimasi) Total dunia 4,600 thousand metric tons
USGS Mineral Commodity Summaries 2026 · USGS silicon figures are silicon CONTENT of ferrosilicon plus silicon metal, not polysilicon. · sumber ↗
Gulir tabel ke samping untuk melihat kolom-kolom yang tersisa.
| Negara | Produksi | Pangsa dunia |
|---|---|---|
| China | 4,000 | 87.0% |
| Brazil | 180.0 | 3.9% |
| Norway | 130.0 | 2.8% |
| France | 68.00 | 1.5% |
| Australia | 47.00 | 1.0% |
| Other countries | 46.00 | 1.0% |
| Russia | 35.00 | 0.8% |
| Canada | 34.00 | 0.7% |
| Iceland | 16.00 | 0.3% |
| Germany | 13.00 | 0.3% |
| South Africa | 10.00 | 0.2% |
| Kazakhstan | 7.00 | 0.2% |
| Spain | 4.00 | 0.1% |
| India | Zero | — |
| Malaysia | Zero | — |
| United States | Withheld | — |
| Bhutan | Zero | — |
| Total dunia | 4,600 | 100% |
"Ditahan" berarti USGS menyembunyikan angka tersebut untuk menghindari pengungkapan data perusahaan tertentu — bukan berarti nol. Baris per negara tidak selalu berjumlah sama dengan total dunia karena sumber membulatkan setiap angka secara independen dan tidak selalu merinci baris "negara lain".
Harga
average, cents per pound of silicon: Ferrosilicon, 75% silicon
Rata-rata tahunancents per pound
Dasar: average, cents per pound of silicon: Ferrosilicon, 75% silicon. Rata-rata tahunan sebagaimana diterbitkan dalam USGS Mineral Commodity Summaries 2026 · sumber ↗. Ini adalah rata-rata tahunan referensi, bukan kuotasi pasar secara langsung.
average, cents per pound of silicon: Silicon metal
Rata-rata tahunancents per pound
Dasar: average, cents per pound of silicon: Silicon metal. Rata-rata tahunan sebagaimana diterbitkan dalam USGS Mineral Commodity Summaries 2026 · sumber ↗. Ini adalah rata-rata tahunan referensi, bukan kuotasi pasar secara langsung.
Di mana material diproses dan dimurnikan
| Fasilitas | Jenis | Tahap | Negara | Peran |
|---|---|---|---|---|
| Samsung Pyeongtaek Campus | Fab semikonduktor | Komponen | South Korea | Masukan |
| TSMC Fab 18, Tainan | Fab semikonduktor | Komponen | Taiwan | Masukan |
| Hemlock Semiconductor Polysilicon Plant | Pabrik kimia | Pemurnian | United States | Masukan |
| Xinjiang & Inner Mongolia Polysilicon Cluster | Pabrik kimia | Pemurnian | China | Masukan |
Untuk apa digunakan
Semua pasar akhir →| Pasar akhir | Apa yang dilakukannya di sana | Kepentingan |
|---|---|---|
| Data Centres & AI | Processors, memory and power conversion | Mendefinisikan |
| Solar Power | The cell itself | Mendefinisikan |
| Semiconductors | The wafer | Mendefinisikan |
| Consumer Electronics | Every chip | Mendefinisikan |
| Robotics & Automation | Controllers and sensors | Mendefinisikan |
| Electric Vehicles | Power electronics and anode additive | Penting |
| Power Grids | Grid-scale power electronics and HVDC valves | Penting |
Seberapa banyak yang dibutuhkan suatu teknologi
| Teknologi | Kuantitas | Dikutip | Dasar |
|---|---|---|---|
| Crystalline Silicon Solar Module | 2,500–4,000 kg | per MW of capacity | Polysilicon in the wafers |
| Gallium Nitride Power Device | jejak | per device | Common substrate for GaN-on-Si |
| Leading-Edge Logic Chip | 0.12–0.15 kg | per 300 mm wafer | One 300 mm wafer weighs about 125 g |
Indicative range compiled from published technology studies and chemistry; verify against a manufacturer specification before use. Jalankan angka-angka ini pada skala berapa pun dalam kalkulator material →
Ikuti melintasi perbatasan
Semua perjalanan →Ke mana kiriman material ini sebenarnya pergi — setiap negara, setiap pengelola, dan apa yang tersisa di setiap langkah.
A quarry in North Carolina to the chip in your phone The most valuable sand on Earth, and almost all of it comes from one small district.