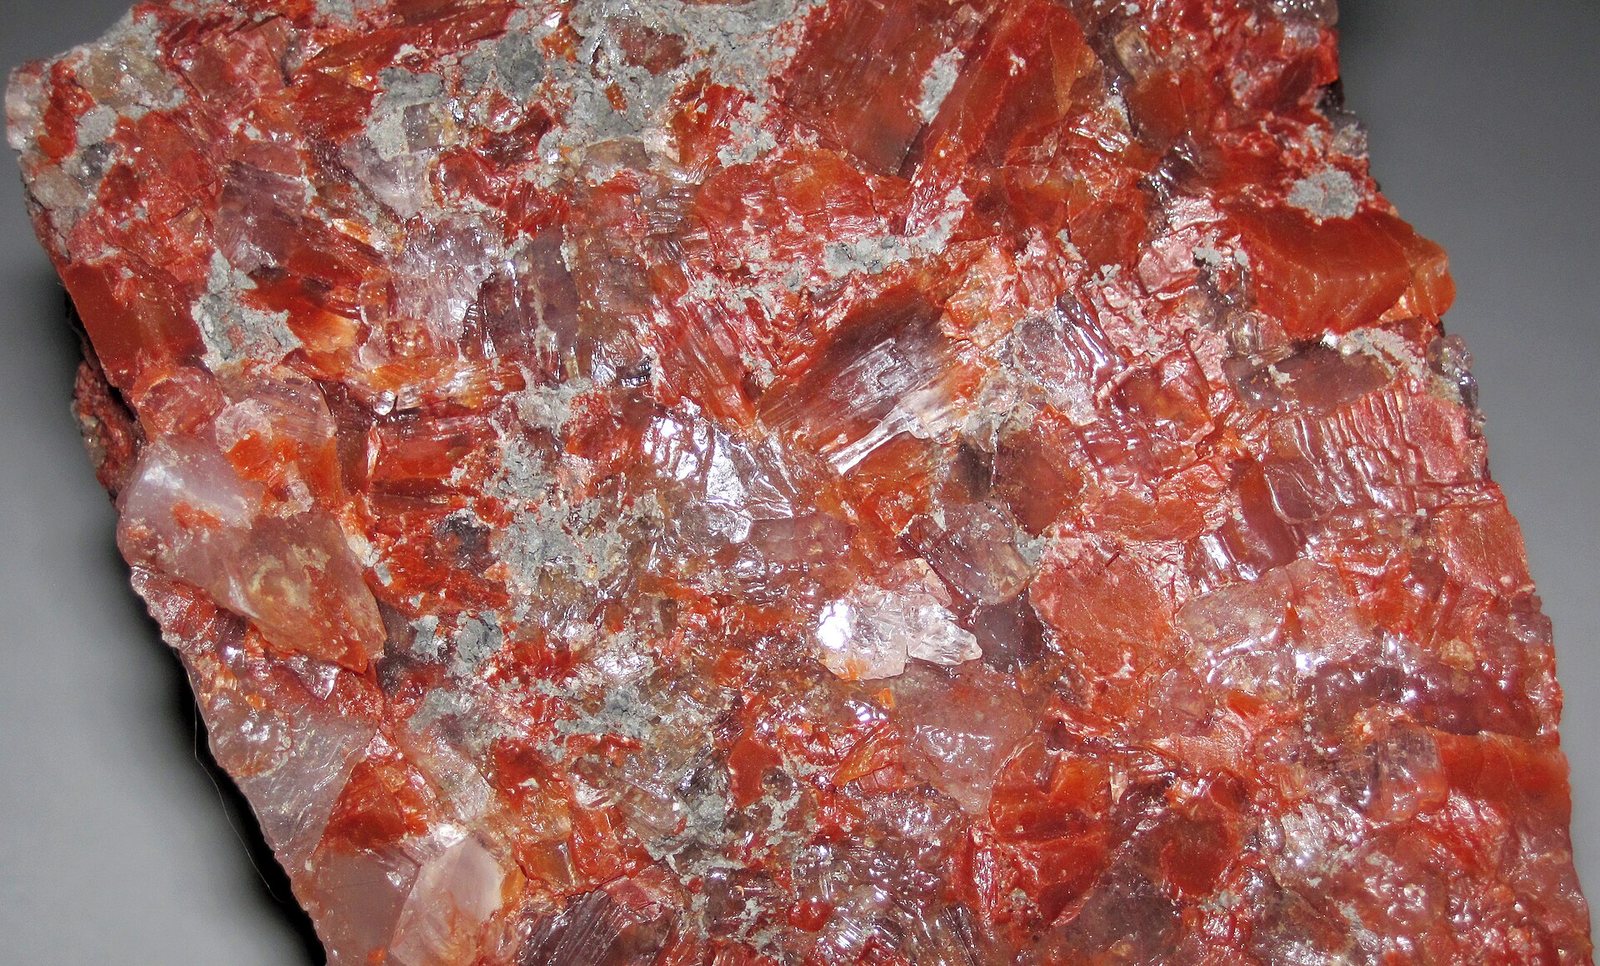
Was ist das?
Potassium salts mined from ancient dried-up seas — the K in NPK fertiliser, which plants need to move water and resist drought.
Warum ist das wichtig?
Potash supply is geographically concentrated to an unusual degree, so fertiliser prices are sensitive to events in very few places.
Where it is in the Earth
Where it is in the Earth
Potash deposits are the residue of ancient seas that evaporated completely. When a shallow, enclosed marine basin dries out over geological time, the dissolved salts it contained settle out in a predictable sequence. The least soluble minerals — carbonates and gypsum — precipitate first. Common salt, or halite (sodium chloride), comes next. The potassium-bearing salts, being the most soluble, precipitate last, forming thin but laterally extensive beds near the top of the evaporite sequence. These beds, laid down in some cases hundreds of millions of years ago, were then buried under younger sediments, which preserved them. The great potash-bearing basins of Saskatchewan in Canada, the Ural region of Russia, and Belarus all follow this origin story: Devonian or Permian seas that retreated and concentrated their dissolved load into layered salt sequences now sitting kilometres underground.
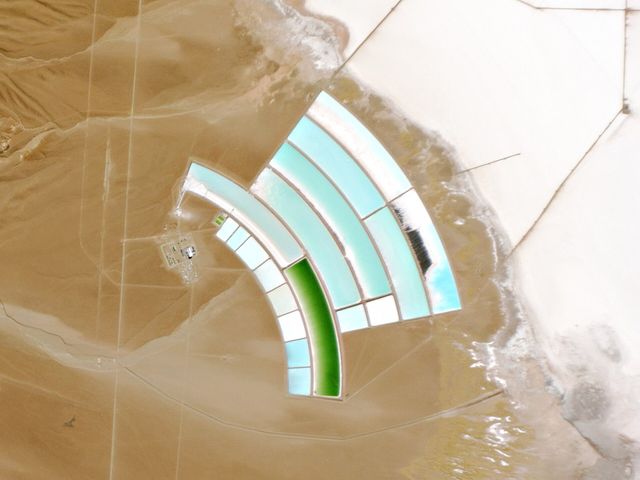
The ore mineral that matters most is sylvite, which is potassium chloride. It occurs mixed with halite, the geologically worthless sodium chloride that makes up the bulk of the rock. The ratio of sylvite to halite in the ore is described as the grade, typically expressed as a percentage of potassium oxide equivalent (K₂O), the conventional reporting unit for the industry. Halite is not merely gangue in a chemical sense — it is the matrix in which the sylvite sits, and separating the two efficiently is the central challenge of potash processing. A third route to potash exists in the brines of hypersaline lakes and salt flats, called salars, where dissolved potassium salts can be concentrated further by solar evaporation. The Salar de Atacama in Chile is the principal example currently in production.
The geographic distribution of deposits reflects the geography of ancient seas, not the geography of modern demand. Canada holds the largest reserves by a considerable margin, followed by Belarus and Russia. Many of the world's largest agricultural nations — Brazil, India, much of sub-Saharan Africa — sit on geologies that contain little or no economic potash, making them structurally dependent on imports from a small number of countries.
Getting it out
Getting it out
Most potash is won by conventional underground mining. The ore beds were formed as flat, horizontal sheets, and they remain broadly flat, which suits the room-and-pillar method: machines cut long galleries through the ore seam, leaving behind regular columns of unmined rock to hold up the roof. The Esterhazy mine in Saskatchewan, operated by Mosaic, is among the largest examples of this approach. The depth of the ore — often several hundred metres below surface — rules out open-pit mining for most deposits, because removing that much overlying rock would be neither economically nor practically feasible at scale.
Grade matters in potash mining in a direct way. The ore is a physical mixture of sylvite and halite, and the halite must be transported to the surface along with the sylvite even though only the sylvite has value. The lower the grade, the more halite moves per tonne of potassium recovered, and since underground haulage and hoisting are among the largest cost items in the operation, low-grade ore is punishingly expensive to mine. Processing plants are typically built directly above the mine to minimise surface transport of the heavy, bulky raw ore.
Where the geology permits, solution mining offers an alternative. Hot water is pumped underground to dissolve the potash-bearing salts selectively, and the resulting brine is pumped back to surface for processing. This avoids putting workers underground and removes the cost of cutting and hoisting solid rock, but it requires favourable geology — the dissolved cavity must behave predictably — and it generally recovers a smaller fraction of the ore in place than conventional mining. Brine-based production from natural brines, as practised at the Salar de Atacama, works differently again: the potassium is already in solution in a subsurface brine aquifer beneath the salt flat, and recovery depends on pumping, evaporation in large surface ponds, and harvesting the crystallised salts. This method is low in energy cost but slow, geographically constrained, and increasingly subject to scrutiny over water use in arid environments.
What pulls on it
What pulls on it
Potassium is one of the three primary macronutrients that plants require in large amounts, alongside nitrogen and phosphorus — hence the NPK shorthand that appears on fertiliser bags. Plants use potassium to regulate water movement through their tissues, activate enzymes, and build resistance to drought and disease. Unlike nitrogen, which the atmosphere provides in unlimited quantity and which the chemical industry can fix into ammonia given energy, potassium can only be obtained by mining: there is no synthetic substitute for the element itself. This makes potash demand essentially a function of global food production and, more specifically, of the area of cropland under intensive cultivation.
The connection between potash consumption and agricultural intensity is not uniform across crops. Fruits, vegetables, sugar crops, and oil palms are heavy users of potassium relative to their weight. Cereals are lighter users but cover far larger areas globally. As diets in populous developing countries shift toward more meat, dairy, and processed food, the feed crops needed to support that shift increase aggregate fertiliser demand. Brazil has been the most visible example of this dynamic over the past two decades, with its expanding soy and corn acreage driving sharply higher fertiliser imports. India represents a similar structural situation. Both countries produce little potash domestically and rely almost entirely on imports.
Demand does respond to price, though with a lag. When potash prices rose sharply in 2022 — as the table on this page shows — farmers in some markets reduced application rates or substituted lower-analysis products, and consumption fell. But the agronomic logic of potassium application means that extended under-application depletes soil reserves and eventually suppresses yields, which creates a recovery in demand. The result is a pattern of demand that is relatively inelastic over multi-year periods even when it responds to short-term price signals. Industrial uses of potash — in glass, ceramics, and certain chemical processes — exist but are small relative to agriculture, and a shift away from agricultural potash has no plausible near-term driver beyond price response.
Wo es im Gestein vorkommt
Alle Erzminerale →Dies sind die Mineralien, die tatsächlich potash. Eine Lagerstätte ist nur dann ein Erzkörper, wenn eines der Minerale ausreichend konzentriert ist, um den Abbau wirtschaftlich zu rechtfertigen.
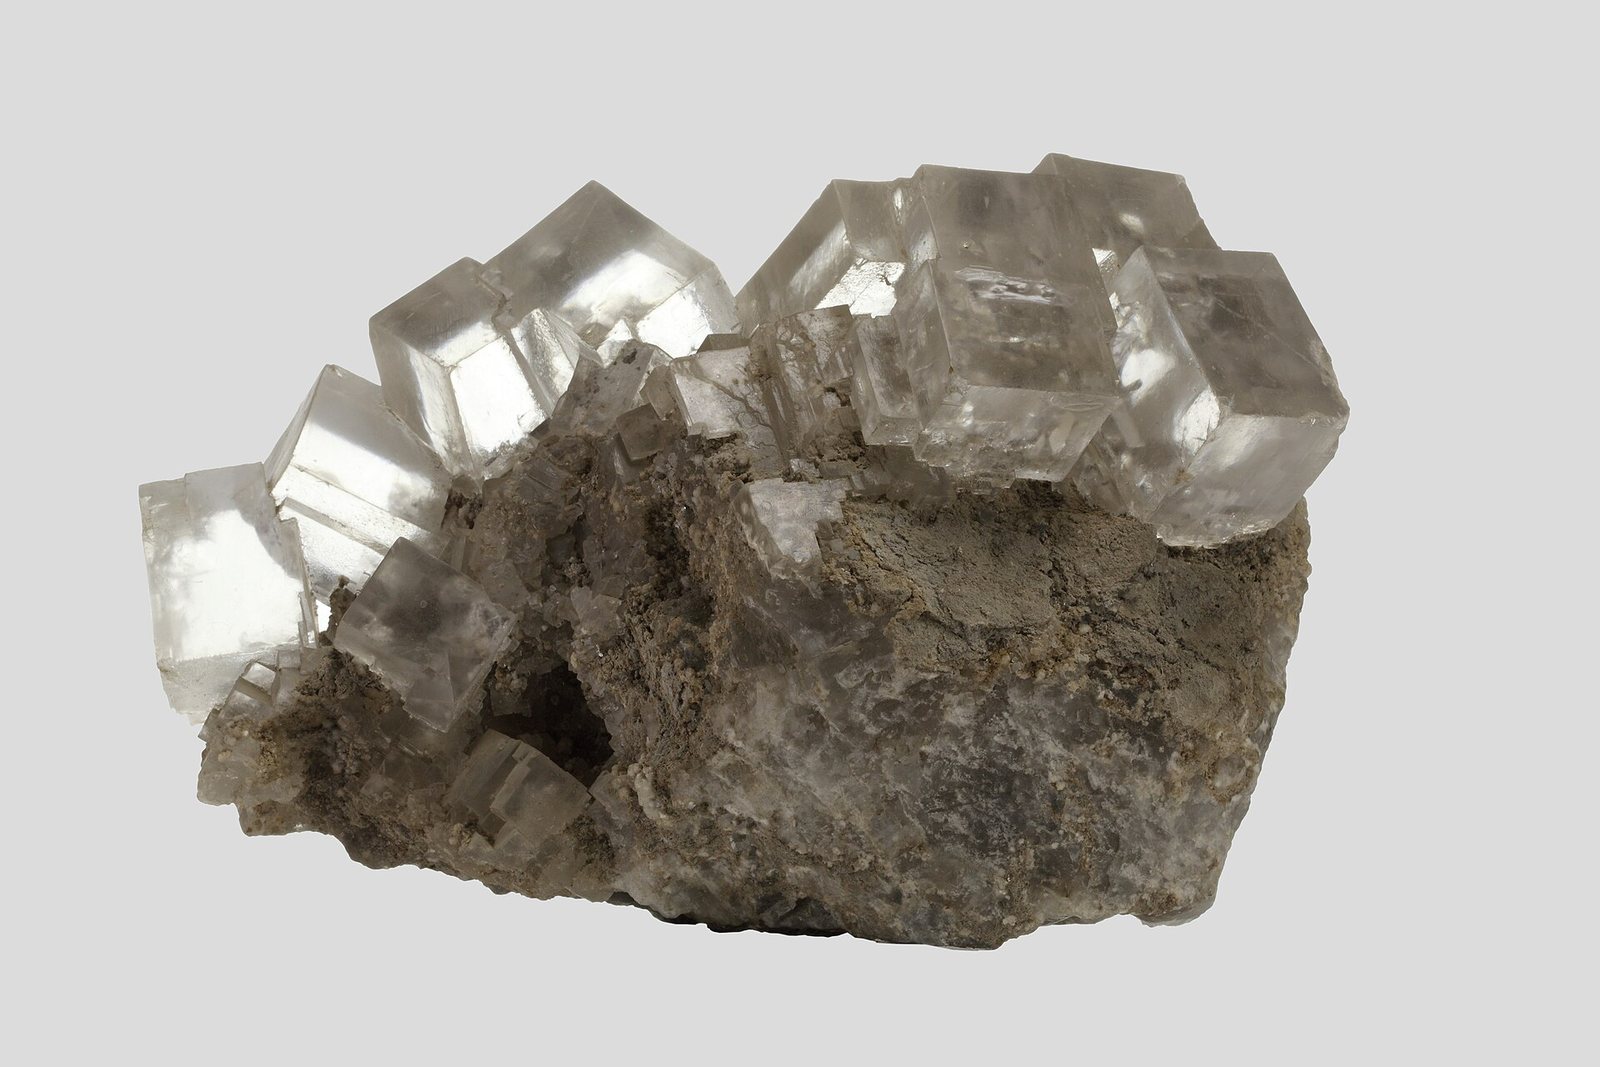
Halite
Rock salt. Deforms plastically under pressure, which is why it rises into domes and traps oil against their flanks.
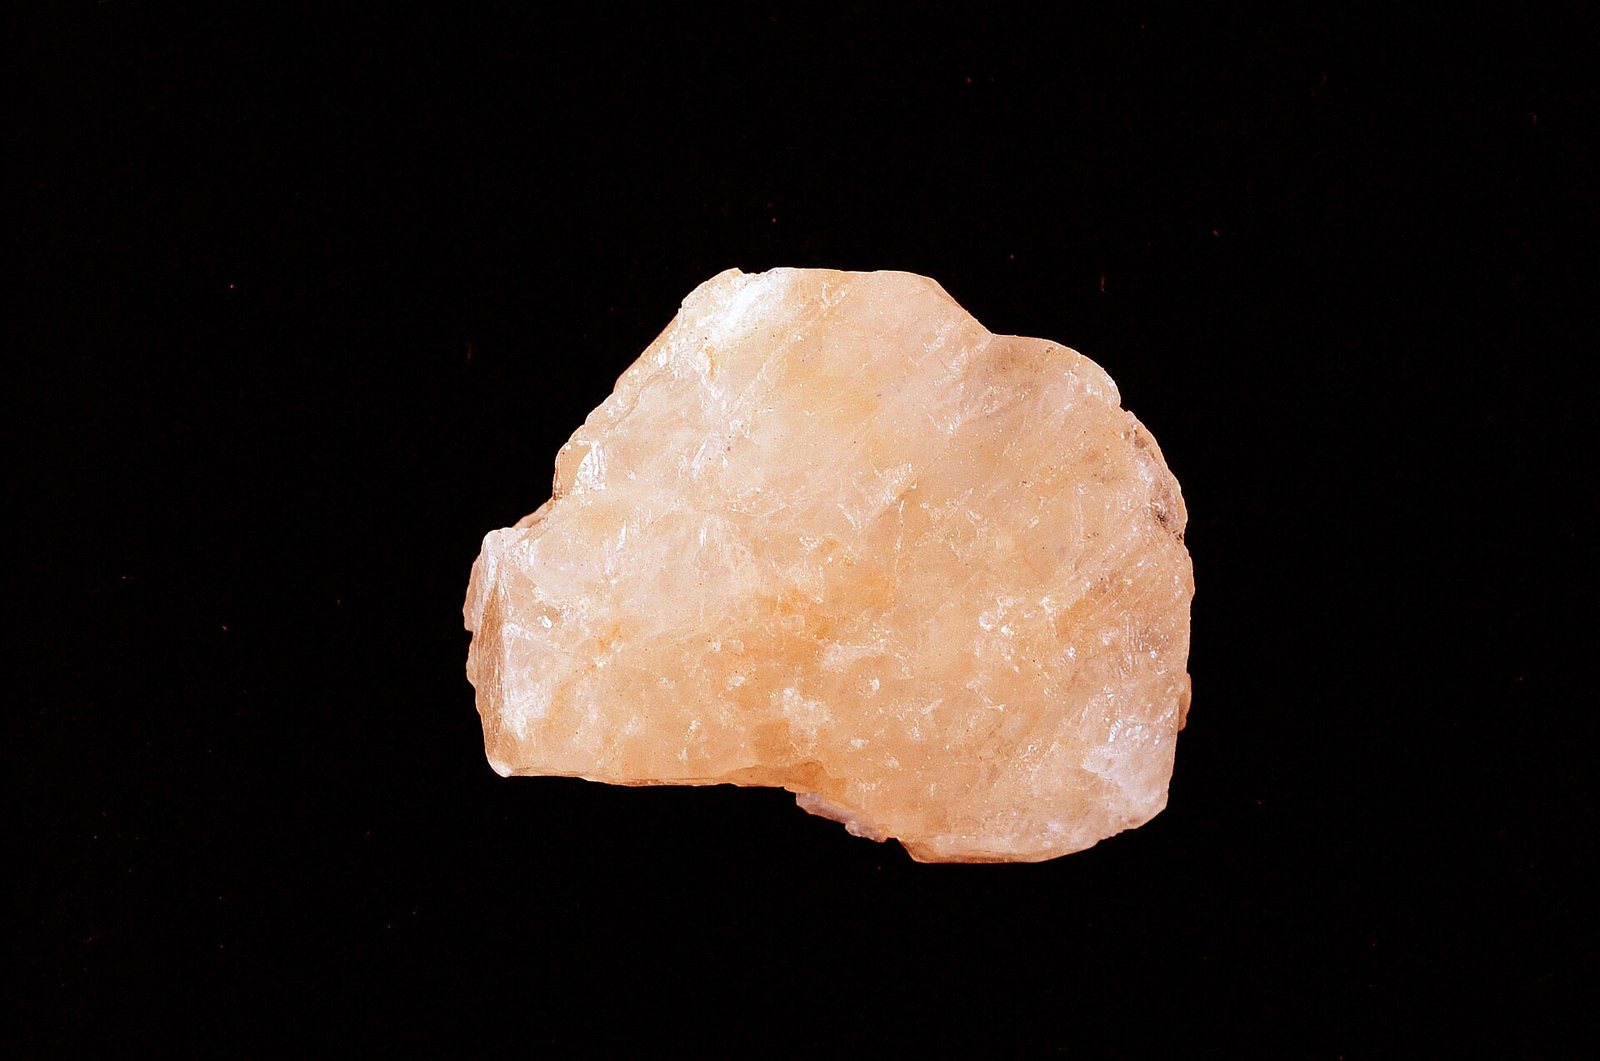
Sylvite
The potash mineral. Bitter rather than salty, and mined from beds left by evaporated inland seas.
Wer es produziert
Auf einer Karte anzeigen →Mine production
Mine productionthousand metric tons 2025 (geschätzt) Weltgesamt 49,000 thousand metric tons
USGS Mineral Commodity Summaries 2026 · Reported as K2O equivalent, not gross salt weight. · Quelle ↗
Tabelle seitwärts scrollen, um die restlichen Spalten zu sehen.
| Land | Produktion | Anteil an der Weltproduktion |
|---|---|---|
| Canada | 15,000 | 30.6% |
| Russia | 10,000 | 20.4% |
| China | 6,300 | 12.9% |
| Belarus | 6,000 | 12.2% |
| Germany | 3,000 | 6.1% |
| Laos | 2,400 | 4.9% |
| Israel | 2,000 | 4.1% |
| Jordan | 1,800 | 3.7% |
| Chile | 600.0 | 1.2% |
| United States | 500.0 | 1.0% |
| Spain | 450.0 | 0.9% |
| Other countries | 350.0 | 0.7% |
| Brazil | 300.0 | 0.6% |
| Weltgesamt | 49,000 | 100% |
„Withheld" bedeutet, dass der USGS den Wert zurückgehalten hat, um keine Rückschlüsse auf Daten einzelner Unternehmen zuzulassen – er bedeutet nicht null. Die Länderwerte addieren sich nicht immer zum Weltgesamt, weil die Quelle jeden Einzelwert unabhängig rundet und eine Zeile „sonstige Länder" nicht immer ausweist.
Wer die Reserven hält
Reserves, Recoverable ore
Reserves, Recoverable orethousand metric tons 2025
USGS Mineral Commodity Summaries 2026 · Quelle ↗
| Land | Reserven | Anteil an der Weltproduktion |
|---|---|---|
| Canada | 4,500,000 | 45.0% |
| Belarus | 3,300,000 | 33.0% |
| Other countries | 1,500,000 | 15.0% |
| United States | 970,000 | 9.7% |
| Brazil | 10,000 | 0.1% |
| Laos | Not applicable | — |
| Russia | Not applicable | — |
| Spain | Not applicable | — |
| Israel | Not applicable | — |
| Chile | Not applicable | — |
| China | Not applicable | — |
| Germany | Not applicable | — |
| Jordan | Not applicable | — |
| Weltgesamt | >10,000,000 | 100% |
Die Quelle veröffentlicht diesen Weltgesamtwert als Schranke und nicht als Punktwert, weshalb die Anteile in der letzten Spalte ebenfalls Schranken sind.
Reserves: K2O equivalent
Reserves: K2O equivalentthousand metric tons 2025
USGS Mineral Commodity Summaries 2026 · Quelle ↗
| Land | Reserven | Anteil an der Weltproduktion |
|---|---|---|
| Russia | 2,000,000 | 33.9% |
| Canada | 1,100,000 | 18.6% |
| Laos | 1,000,000 | 16.9% |
| Belarus | 750,000 | 12.7% |
| Other countries | 300,000 | 5.1% |
| United States | 220,000 | 3.7% |
| China | 200,000 | 3.4% |
| Germany | 150,000 | 2.5% |
| Chile | 100,000 | 1.7% |
| Spain | 100,000 | 1.7% |
| Brazil | 2,300 | 0.0% |
| Israel | Large | — |
| Jordan | Large | — |
| Weltgesamt | >5,900,000 | 100% |
Die Quelle veröffentlicht diesen Weltgesamtwert als Schranke und nicht als Punktwert, weshalb die Anteile in der letzten Spalte ebenfalls Schranken sind.
Preis
average, f.o.b. mine, dollars per metric ton of K2O equivalent: All products
Jahresdurchschnittdollars per metric ton
Grundlage: average, f.o.b. mine, dollars per metric ton of K2O equivalent: All products. Jahresdurchschnitte gemäß Veröffentlichung in USGS Mineral Commodity Summaries 2026 · Quelle ↗. Dies sind jährliche Referenzdurchschnittswerte, kein Live-Marktpreis.
average, f.o.b. mine, dollars per metric ton of K2O equivalent: MOP
Jahresdurchschnittdollars per metric ton
Grundlage: average, f.o.b. mine, dollars per metric ton of K2O equivalent: MOP. Jahresdurchschnitte gemäß Veröffentlichung in USGS Mineral Commodity Summaries 2026 · Quelle ↗. Dies sind jährliche Referenzdurchschnittswerte, kein Live-Marktpreis.
Bergwerke, die es fördern
Alle Minen →
Wofür es verwendet wird
Alle Endmärkte →| Endmarkt | Was es dort tut | Bedeutung |
|---|---|---|
| Agriculture & Food | The K in NPK | Definition |
Wie viel eine Technologie davon benötigt
| Technologie | Menge | Angegeben | Grundlage |
|---|---|---|---|
| Alkaline Electrolyser | 100.0–400.0 kg | per MW of capacity | Potassium hydroxide electrolyte |
Indicative range compiled from published technology studies and chemistry; verify against a manufacturer specification before use. Diese Zahlen mit beliebiger Skalierung im Materialrechner ausführen →
Grenzenübergreifend verfolgen
Alle Routen →Wo eine Sendung dieses Materials tatsächlich hingeht — jedes Land, jeder Verwahrer und was bei jedem Schritt zurückbleibt.
Chilean brine to a battery in a car The ore is water. The first year and a half of processing is done by the sun, for free.