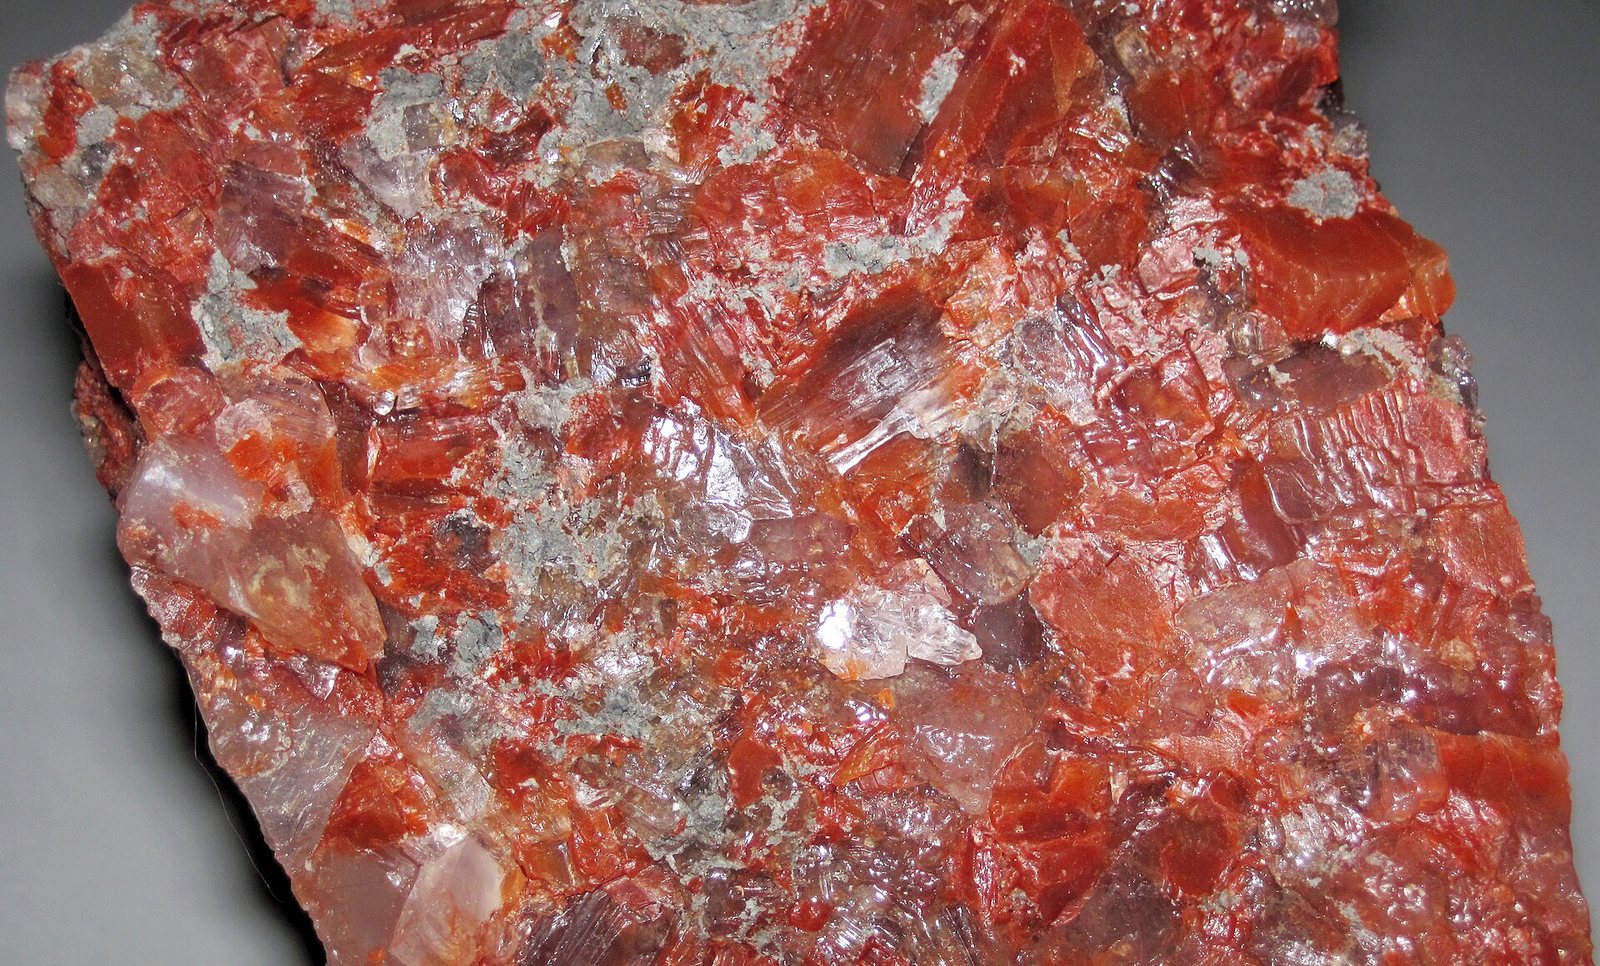
What is it?
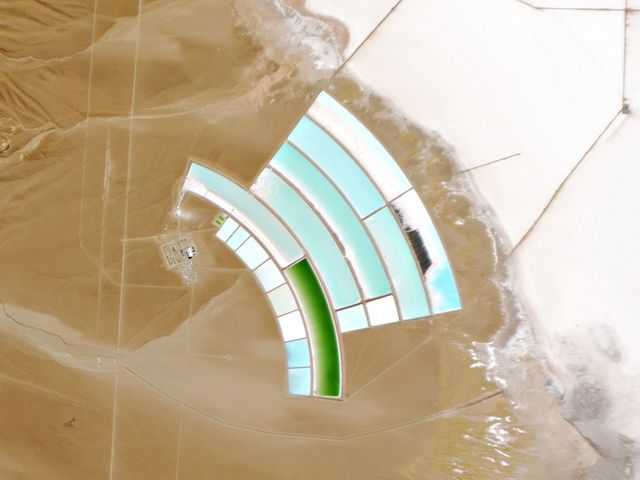
Potassium salts mined from ancient dried-up seas — the K in NPK fertiliser, which plants need to move water and resist drought.
Why does it matter?
Potash supply is geographically concentrated to an unusual degree, so fertiliser prices are sensitive to events in very few places.
Deeper written sections for this material have not been published yet. Everything below is drawn straight from the source datasets and is complete.
Where it comes from in the rock
All ore minerals →These are the minerals that actually carry potash. A deposit is only an orebody if one of them is concentrated enough to pay for digging it up.
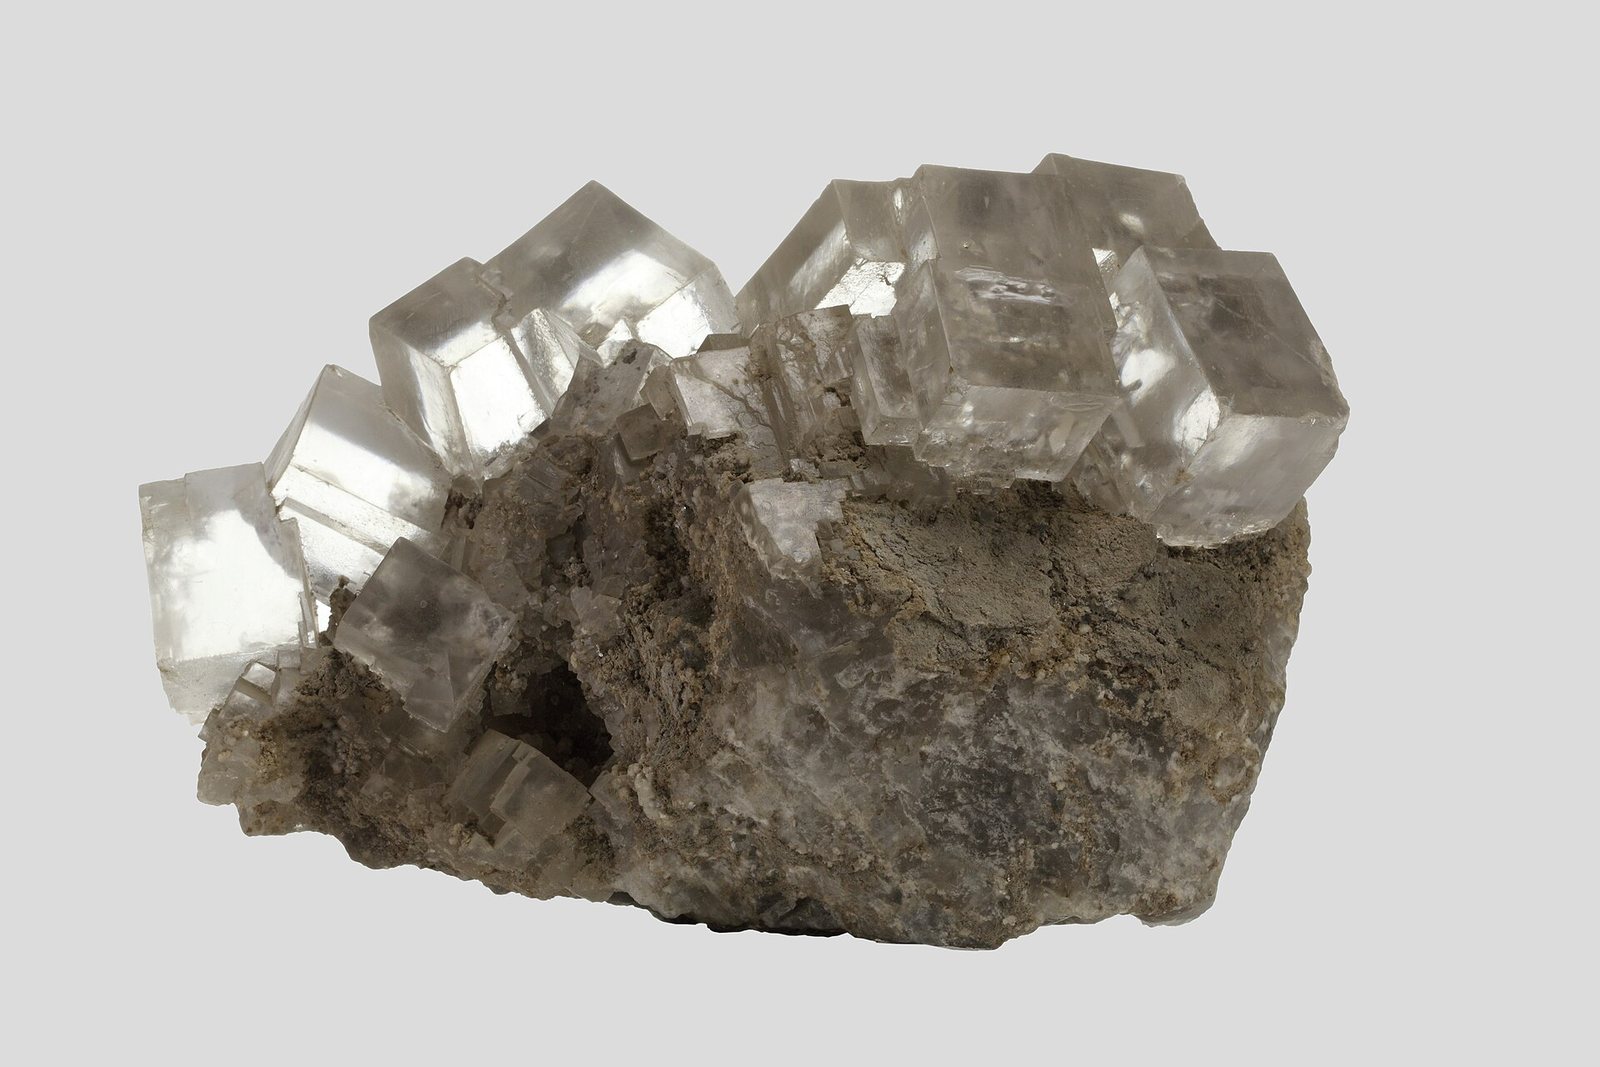
Halite
Rock salt. Deforms plastically under pressure, which is why it rises into domes and traps oil against their flanks.
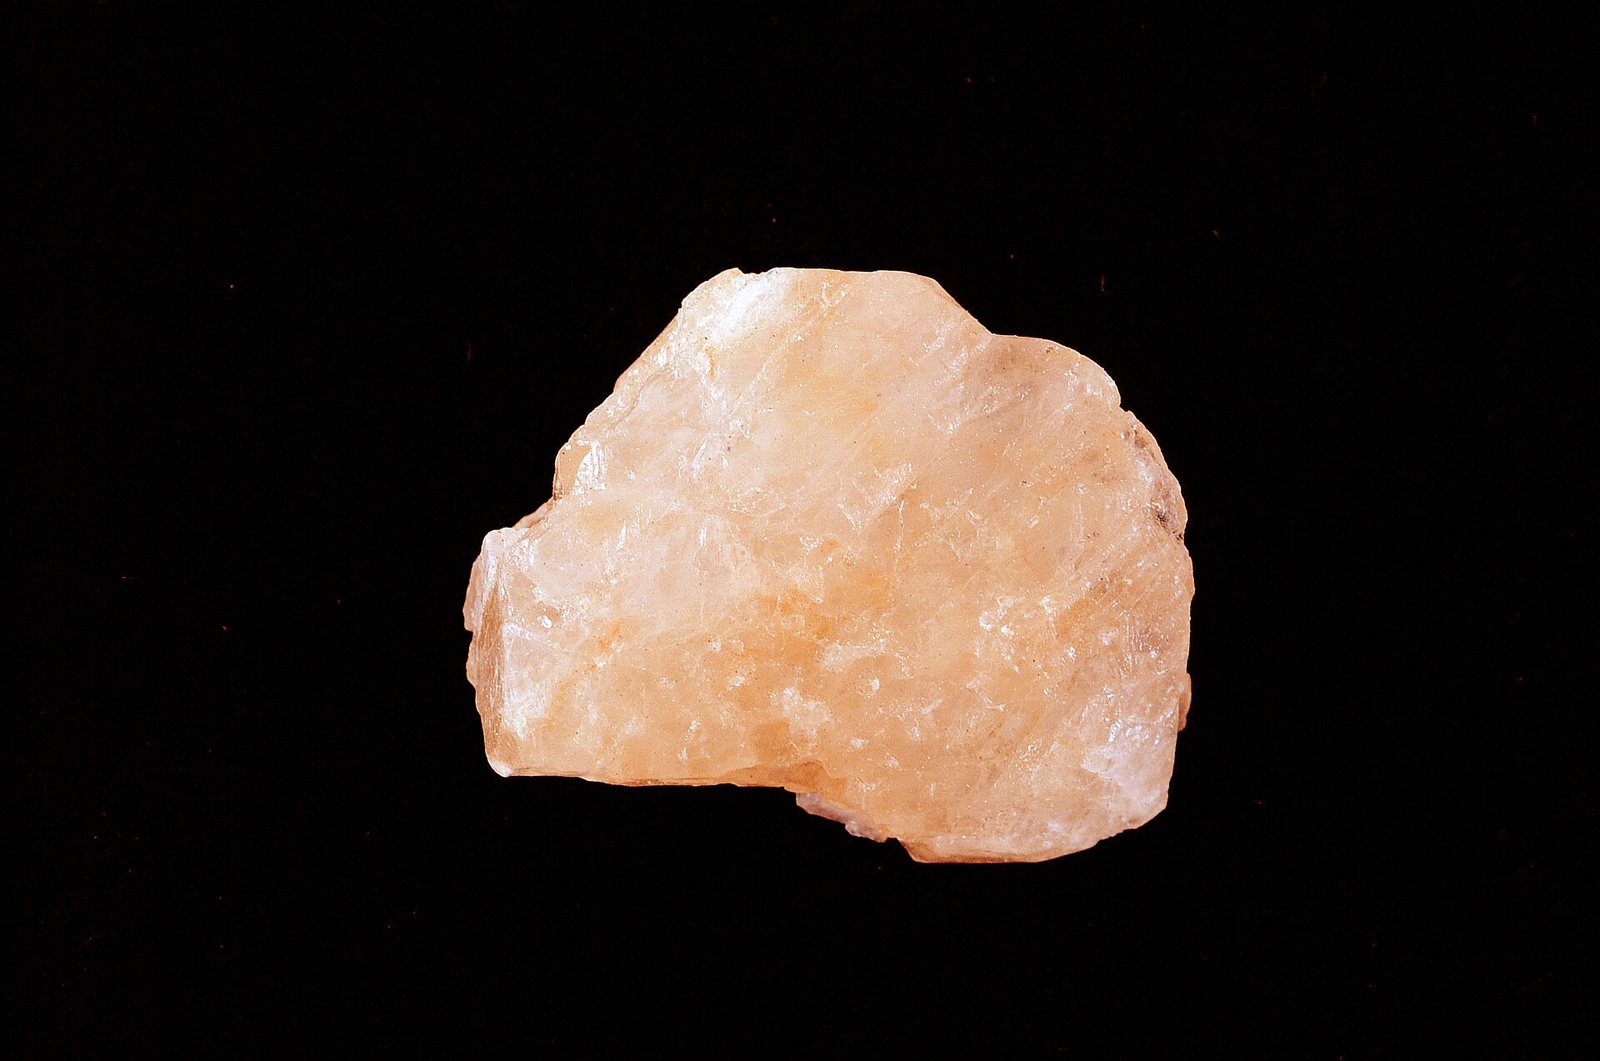
Sylvite
The potash mineral. Bitter rather than salty, and mined from beds left by evaporated inland seas.
Who produces it
See it on a map →Mine production
Mine productionthousand metric tons 2025 (estimated) World total 49,000 thousand metric tons
USGS Mineral Commodity Summaries 2026 · Reported as K2O equivalent, not gross salt weight. · source ↗
Scroll the table sideways for the remaining columns.
| Country | Production | Share of world |
|---|---|---|
| Canada | 15,000 | 30.6% |
| Russia | 10,000 | 20.4% |
| China | 6,300 | 12.9% |
| Belarus | 6,000 | 12.2% |
| Germany | 3,000 | 6.1% |
| Laos | 2,400 | 4.9% |
| Israel | 2,000 | 4.1% |
| Jordan | 1,800 | 3.7% |
| Chile | 600.0 | 1.2% |
| United States | 500.0 | 1.0% |
| Spain | 450.0 | 0.9% |
| Other countries | 350.0 | 0.7% |
| Brazil | 300.0 | 0.6% |
| World total | 49,000 | 100% |
“Withheld” means the USGS suppressed the figure to avoid disclosing an individual company's data — it does not mean zero. Country rows do not always sum to the world total because the source rounds each figure independently and does not always break out an “other countries” line.
Who holds the reserves
Reserves, Recoverable ore
Reserves, Recoverable orethousand metric tons 2025
USGS Mineral Commodity Summaries 2026 · source ↗
| Country | Reserves | Share of world |
|---|---|---|
| Canada | 4,500,000 | 45.0% |
| Belarus | 3,300,000 | 33.0% |
| Other countries | 1,500,000 | 15.0% |
| United States | 970,000 | 9.7% |
| Brazil | 10,000 | 0.1% |
| Laos | Not applicable | — |
| Russia | Not applicable | — |
| Spain | Not applicable | — |
| Israel | Not applicable | — |
| Chile | Not applicable | — |
| China | Not applicable | — |
| Germany | Not applicable | — |
| Jordan | Not applicable | — |
| World total | >10,000,000 | 100% |
The source publishes this world total as a bound rather than a point figure, so the shares in the last column are themselves bounds.
Reserves: K2O equivalent
Reserves: K2O equivalentthousand metric tons 2025
USGS Mineral Commodity Summaries 2026 · source ↗
| Country | Reserves | Share of world |
|---|---|---|
| Russia | 2,000,000 | 33.9% |
| Canada | 1,100,000 | 18.6% |
| Laos | 1,000,000 | 16.9% |
| Belarus | 750,000 | 12.7% |
| Other countries | 300,000 | 5.1% |
| United States | 220,000 | 3.7% |
| China | 200,000 | 3.4% |
| Germany | 150,000 | 2.5% |
| Chile | 100,000 | 1.7% |
| Spain | 100,000 | 1.7% |
| Brazil | 2,300 | 0.0% |
| Israel | Large | — |
| Jordan | Large | — |
| World total | >5,900,000 | 100% |
The source publishes this world total as a bound rather than a point figure, so the shares in the last column are themselves bounds.
Price
average, f.o.b. mine, dollars per metric ton of K2O equivalent: All products
Annual averagedollars per metric ton
Basis: average, f.o.b. mine, dollars per metric ton of K2O equivalent: All products. Annual averages as published in USGS Mineral Commodity Summaries 2026 · source ↗. These are reference annual averages, not a live market quote.
average, f.o.b. mine, dollars per metric ton of K2O equivalent: MOP
Annual averagedollars per metric ton
Basis: average, f.o.b. mine, dollars per metric ton of K2O equivalent: MOP. Annual averages as published in USGS Mineral Commodity Summaries 2026 · source ↗. These are reference annual averages, not a live market quote.
Mines that produce it
All mines →
What it is used for
All end markets →| End market | What it does there | Importance |
|---|---|---|
| Agriculture & Food | The K in NPK | Defining |
How much of it a technology needs
| Technology | Quantity | Quoted | Basis |
|---|---|---|---|
| Alkaline Electrolyser | 100.0–400.0 kg | per MW of capacity | Potassium hydroxide electrolyte |
Indicative range compiled from published technology studies and chemistry; verify against a manufacturer specification before use. Run these numbers at any scale in the material calculator →
Follow it across the borders
All journeys →Where a consignment of this material actually goes — every country, every custodian, and what is left behind at each step.
Chilean brine to a battery in a car The ore is water. The first year and a half of processing is done by the sun, for free.