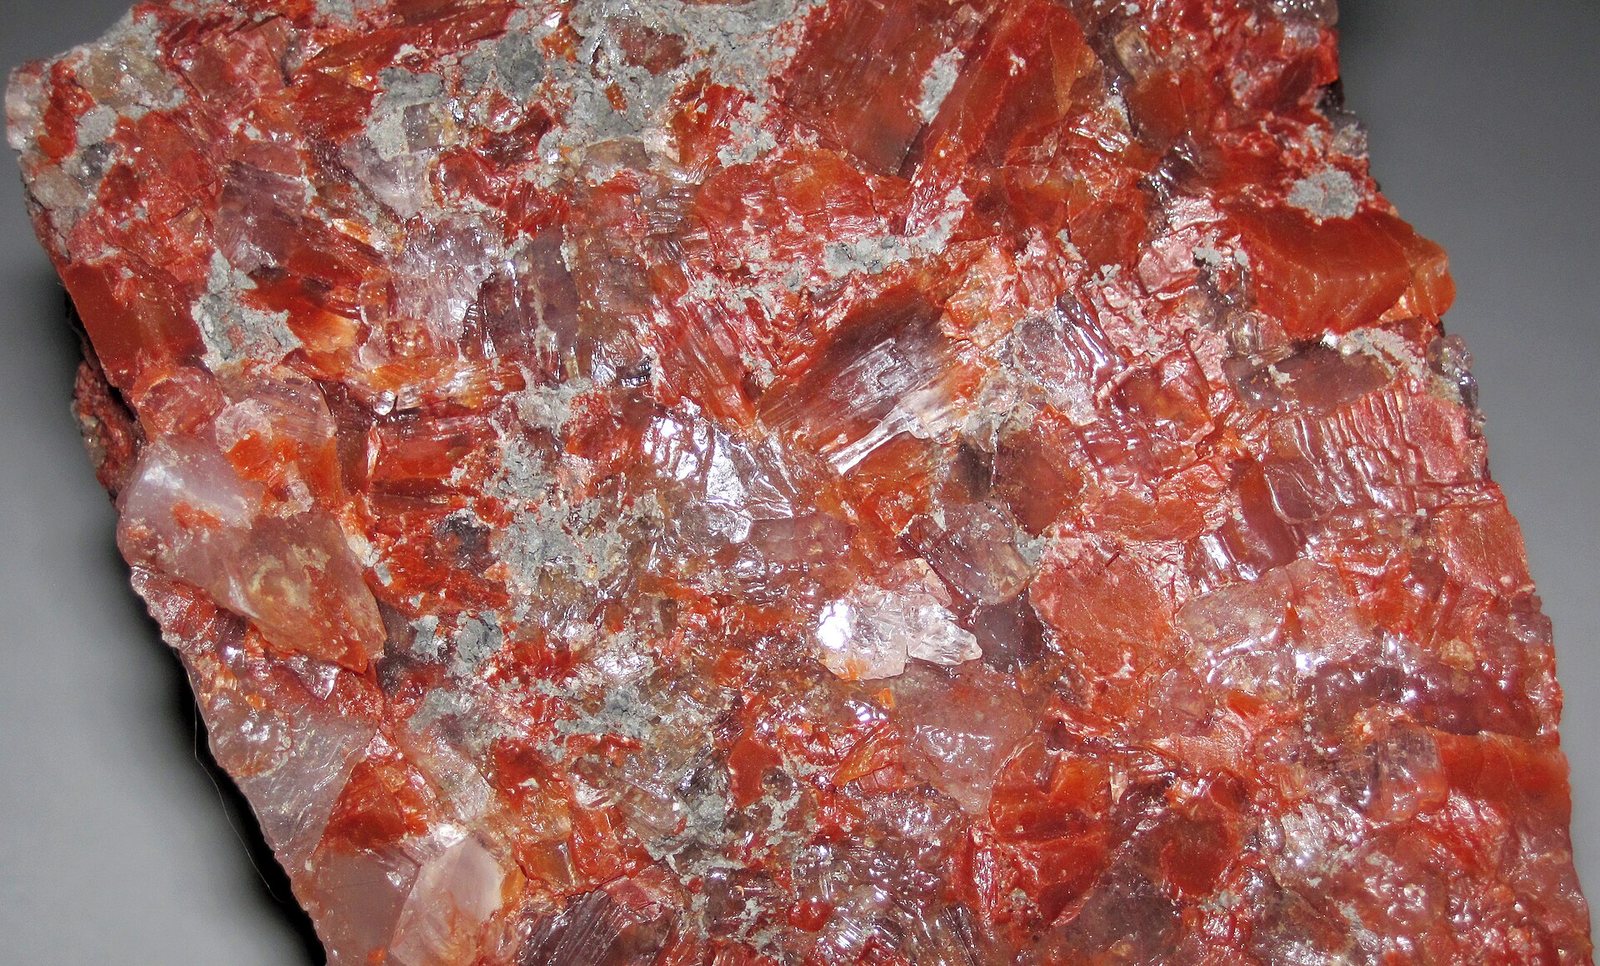
¿Qué es?
Potassium salts mined from ancient dried-up seas — the K in NPK fertiliser, which plants need to move water and resist drought.
¿Por qué importa?
Potash supply is geographically concentrated to an unusual degree, so fertiliser prices are sensitive to events in very few places.
Where it is in the Earth
Where it is in the Earth
Potash deposits are the residue of ancient seas that evaporated completely. When a shallow, enclosed marine basin dries out over geological time, the dissolved salts it contained settle out in a predictable sequence. The least soluble minerals — carbonates and gypsum — precipitate first. Common salt, or halite (sodium chloride), comes next. The potassium-bearing salts, being the most soluble, precipitate last, forming thin but laterally extensive beds near the top of the evaporite sequence. These beds, laid down in some cases hundreds of millions of years ago, were then buried under younger sediments, which preserved them. The great potash-bearing basins of Saskatchewan in Canada, the Ural region of Russia, and Belarus all follow this origin story: Devonian or Permian seas that retreated and concentrated their dissolved load into layered salt sequences now sitting kilometres underground.
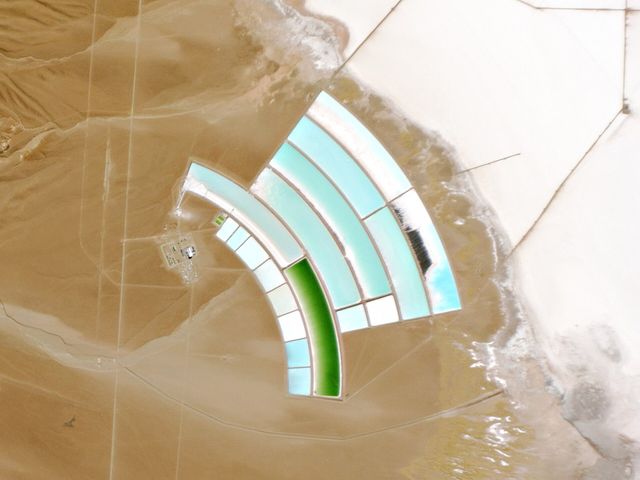
The ore mineral that matters most is sylvite, which is potassium chloride. It occurs mixed with halite, the geologically worthless sodium chloride that makes up the bulk of the rock. The ratio of sylvite to halite in the ore is described as the grade, typically expressed as a percentage of potassium oxide equivalent (K₂O), the conventional reporting unit for the industry. Halite is not merely gangue in a chemical sense — it is the matrix in which the sylvite sits, and separating the two efficiently is the central challenge of potash processing. A third route to potash exists in the brines of hypersaline lakes and salt flats, called salars, where dissolved potassium salts can be concentrated further by solar evaporation. The Salar de Atacama in Chile is the principal example currently in production.
The geographic distribution of deposits reflects the geography of ancient seas, not the geography of modern demand. Canada holds the largest reserves by a considerable margin, followed by Belarus and Russia. Many of the world's largest agricultural nations — Brazil, India, much of sub-Saharan Africa — sit on geologies that contain little or no economic potash, making them structurally dependent on imports from a small number of countries.
Getting it out
Getting it out
Most potash is won by conventional underground mining. The ore beds were formed as flat, horizontal sheets, and they remain broadly flat, which suits the room-and-pillar method: machines cut long galleries through the ore seam, leaving behind regular columns of unmined rock to hold up the roof. The Esterhazy mine in Saskatchewan, operated by Mosaic, is among the largest examples of this approach. The depth of the ore — often several hundred metres below surface — rules out open-pit mining for most deposits, because removing that much overlying rock would be neither economically nor practically feasible at scale.
Grade matters in potash mining in a direct way. The ore is a physical mixture of sylvite and halite, and the halite must be transported to the surface along with the sylvite even though only the sylvite has value. The lower the grade, the more halite moves per tonne of potassium recovered, and since underground haulage and hoisting are among the largest cost items in the operation, low-grade ore is punishingly expensive to mine. Processing plants are typically built directly above the mine to minimise surface transport of the heavy, bulky raw ore.
Where the geology permits, solution mining offers an alternative. Hot water is pumped underground to dissolve the potash-bearing salts selectively, and the resulting brine is pumped back to surface for processing. This avoids putting workers underground and removes the cost of cutting and hoisting solid rock, but it requires favourable geology — the dissolved cavity must behave predictably — and it generally recovers a smaller fraction of the ore in place than conventional mining. Brine-based production from natural brines, as practised at the Salar de Atacama, works differently again: the potassium is already in solution in a subsurface brine aquifer beneath the salt flat, and recovery depends on pumping, evaporation in large surface ponds, and harvesting the crystallised salts. This method is low in energy cost but slow, geographically constrained, and increasingly subject to scrutiny over water use in arid environments.
What pulls on it
What pulls on it
Potassium is one of the three primary macronutrients that plants require in large amounts, alongside nitrogen and phosphorus — hence the NPK shorthand that appears on fertiliser bags. Plants use potassium to regulate water movement through their tissues, activate enzymes, and build resistance to drought and disease. Unlike nitrogen, which the atmosphere provides in unlimited quantity and which the chemical industry can fix into ammonia given energy, potassium can only be obtained by mining: there is no synthetic substitute for the element itself. This makes potash demand essentially a function of global food production and, more specifically, of the area of cropland under intensive cultivation.
The connection between potash consumption and agricultural intensity is not uniform across crops. Fruits, vegetables, sugar crops, and oil palms are heavy users of potassium relative to their weight. Cereals are lighter users but cover far larger areas globally. As diets in populous developing countries shift toward more meat, dairy, and processed food, the feed crops needed to support that shift increase aggregate fertiliser demand. Brazil has been the most visible example of this dynamic over the past two decades, with its expanding soy and corn acreage driving sharply higher fertiliser imports. India represents a similar structural situation. Both countries produce little potash domestically and rely almost entirely on imports.
Demand does respond to price, though with a lag. When potash prices rose sharply in 2022 — as the table on this page shows — farmers in some markets reduced application rates or substituted lower-analysis products, and consumption fell. But the agronomic logic of potassium application means that extended under-application depletes soil reserves and eventually suppresses yields, which creates a recovery in demand. The result is a pattern of demand that is relatively inelastic over multi-year periods even when it responds to short-term price signals. Industrial uses of potash — in glass, ceramics, and certain chemical processes — exist but are small relative to agriculture, and a shift away from agricultural potash has no plausible near-term driver beyond price response.
Turning ore into product Nivel 3
Turning ore into product
Run-of-mine potash ore is a mixture of sylvite (KCl) and halite (NaCl) with minor amounts of clay and other impurities. The processing objective is to raise the sylvite content from the ore grade to a marketable specification — most muriate of potash (MOP) traded internationally carries a KCl content well above ninety percent. Two separation techniques dominate: froth flotation and heavy-media (dense-media) separation, and most large plants use a combination of both. In flotation, ground ore is mixed with water and a collecting reagent — typically a long-chain amine — that attaches selectively to sylvite surfaces and makes them hydrophobic. Air is then bubbled through the slurry and the sylvite particles float to the surface in a froth while the halite sinks. The halite tailings, saturated brine, and process water represent the bulk of the plant's output by mass and must be managed carefully, since any undissolved or reprecipitated salt reaching freshwater systems causes serious environmental damage. Tailings piles at older Saskatchewan operations are large enough to be visible in satellite imagery.
After flotation, the concentrate is dewatered by centrifuge and dried, then compacted or granulated to produce the particle size required by the end market. Granular potash commands a price premium over standard product because it blends uniformly with granular nitrogen and phosphate fertilisers in bulk blending facilities. The conversion of standard to granular product adds a compaction and screening step that increases plant energy consumption and reduces overall recovery slightly, since fines generated in compaction must be recycled. Sulfate of potash (SOP), the other significant traded form, is manufactured separately — either from langbeinite ore or by the Mannheim process, which reacts KCl with sulfuric acid — and carries a higher price than MOP because it provides sulfur alongside potassium and is preferred for chloride-sensitive crops. The processing losses and co-product revenues differ between MOP and SOP routes in ways that affect mine economics substantially.
For brine-based production, the processing sequence is simpler in concept but longer in elapsed time. Solar evaporation ponds concentrate the incoming brine progressively, and the sequence of minerals that crystallise out is managed by controlling brine composition and pond routing. The harvested potassium salts — often sylvinite or carnallite — are then processed through a conventional plant to produce finished MOP. The capital intensity per tonne of capacity is lower than for underground operations, but the land area required is very large and throughput is constrained by solar resource and evaporation rate.
Substitution and recycling Nivel 3
Substitution and recycling
There is no agronomic substitute for the potassium element in plant nutrition. A farmer who cannot source potash cannot replace it with a different mineral and obtain the same crop outcome. Within the traded potash products, however, there is some substitution between forms. Muriate of potash (KCl) is the dominant and lowest-cost product; sulfate of potash (SOP) is used instead where the chloride content of MOP would damage sensitive crops such as tobacco, some fruits, and certain vegetables. Langbeinite, a hydrated double sulfate of potassium and magnesium, fills a niche where magnesium is also deficient. These substitutions are driven by soil chemistry and crop requirements rather than by supply shortages, though the price differential between MOP and SOP can widen and narrow in ways that affect which product a grower selects at the margin.
Potassium is not lost when food is consumed: it passes through the human body and leaves in wastewater. In principle this offers a recycling pathway, and in well-managed sewage systems some potassium is captured in biosolids applied to agricultural land. In practice the concentrations are low, the logistics of returning nutrients from urban centres to distant farmland are difficult, and the recovered potassium constitutes a very small fraction of what agricultural soils require. Unlike phosphorus, where the recycling potential has attracted sustained research and policy attention, potassium recycling from food systems is not currently a meaningful offset to mined supply. The fundamental reason is that potassium is abundant in the Earth's crust overall — the scarcity is economic and geographic, not elemental — so the economic pressure to close the loop is weaker than it is for phosphorus.
Slow-release and precision-application technologies reduce the amount of potassium fertiliser needed to achieve a given yield by improving the efficiency with which crops can take up what is applied. These are real efficiency gains and, over time, they constrain demand growth per unit of food produced. They do not, however, substitute for potash in any strict sense: they change the application rate, not the requirement for the element.
Where the chain is fragile Nivel 4
Where the chain is fragile
The concentration of potash production and reserves in a small number of countries is the single most discussed risk in the supply chain, and the production figures on this page make the arithmetic plain. Canada, Russia, and Belarus together account for a large majority of global output, and Russia and Belarus together hold a substantial share of reported reserves. The significance of Belarus and Russia to global supply became immediately apparent in 2022, when sanctions and trade disruptions following Russia's invasion of Ukraine removed Belarusian and Russian export volumes from accessible markets simultaneously. The price response — visible in the price history on this page — was the largest upward movement in potash prices in more than a decade. The episode illustrated that reserve size is not the same as supply security: reserves in sanctioned or geopolitically inaccessible jurisdictions are not available to buyers who need to comply with trade restrictions, regardless of their geological extent.
A separate structural feature of the industry is the long lead time required to bring new production into service. Underground potash mines are among the more capital-intensive and time-consuming projects in extractive industry. The distance between a positive feasibility study and first saleable production typically spans many years, and the shaft-sinking phase — which must be completed before any ore can be raised — is both slow and difficult to accelerate with additional spending. This means that the supply side cannot respond quickly to price signals even when the economic case for new capacity is clear. Greenfield projects in Africa, notably in the Congo Basin and in Ethiopia, have been in development or under consideration for extended periods without reaching production, partly because infrastructure — rail, power, port access — is absent and must be built as part of the project.
Reporting conventions introduce a further layer of uncertainty for researchers comparing published data. Production figures for potash are expressed as K₂O equivalent, meaning the weight of potassium oxide that the product would yield, rather than the gross weight of ore extracted or even the weight of KCl shipped. Different national statistics agencies and company reports sometimes mix these bases, and older historical series were not always consistent about whether figures represented mine production, plant output, or export tonnes. Reserve figures are particularly variable: the data available to this site shows multiple entries for the same country reflecting different classification systems (proved versus total, or different vintage estimates), and Belarus and Canada each appear more than once with different values in the underlying dataset. Readers comparing national reserve totals across sources should verify which reporting standard each source is applying before drawing conclusions about relative scale.
De dónde proviene en la roca
Todos los minerales de mena →Estos son los minerales que realmente contienen potash. Un yacimiento solo es un cuerpo mineral si uno de ellos está suficientemente concentrado para costear su extracción.
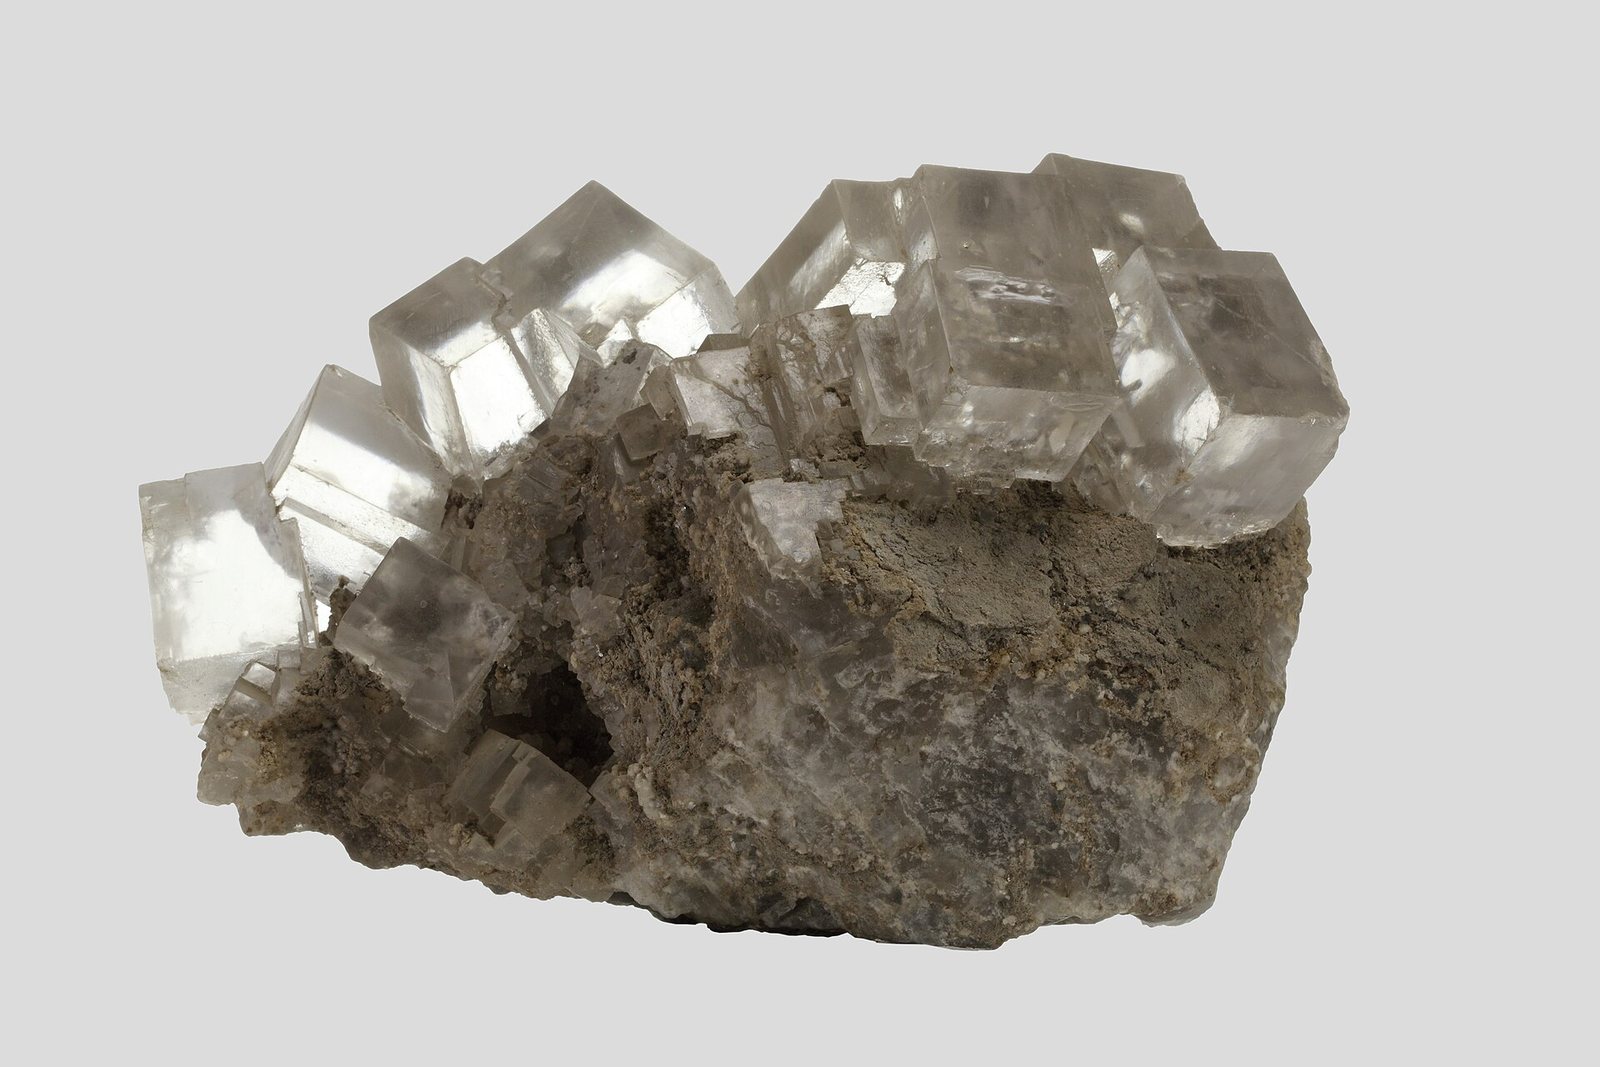
Halite
Rock salt. Deforms plastically under pressure, which is why it rises into domes and traps oil against their flanks.
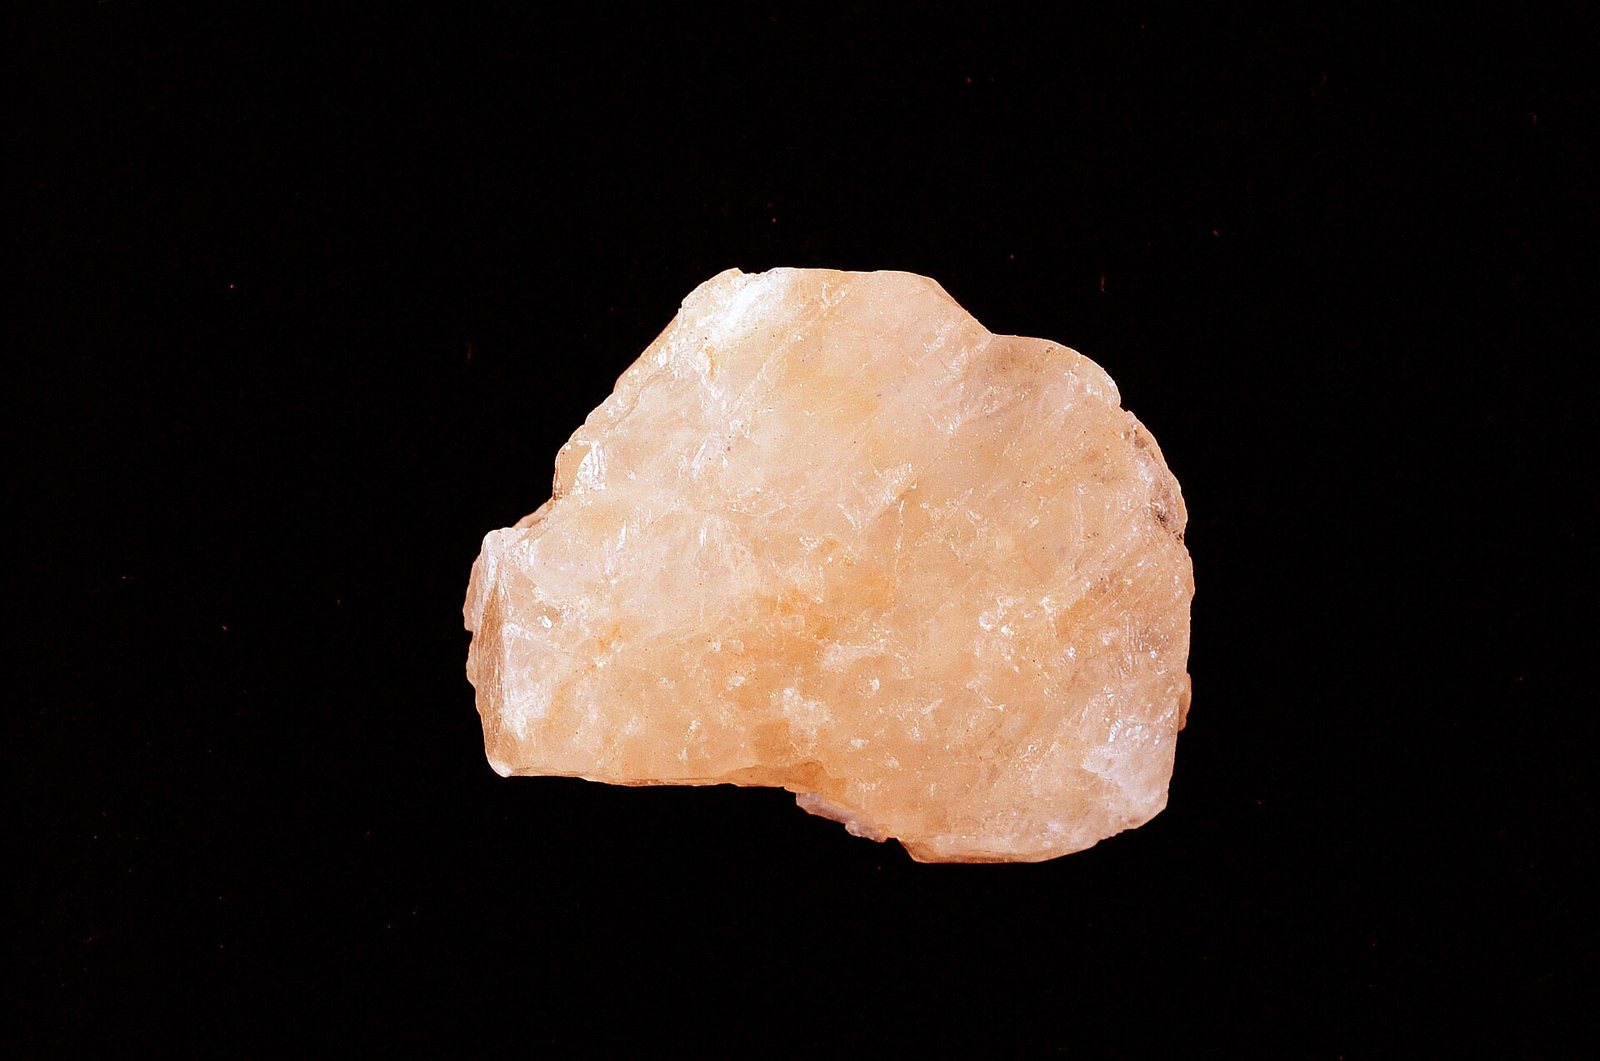
Sylvite
The potash mineral. Bitter rather than salty, and mined from beds left by evaporated inland seas.
Quién lo produce
Verlo en un mapa →Mine production
Mine productionthousand metric tons 2025 (estimado) Total mundial 49,000 thousand metric tons
USGS Mineral Commodity Summaries 2026 · Reported as K2O equivalent, not gross salt weight. · fuente ↗
Desplace la tabla lateralmente para ver las columnas restantes.
| País | Producción | Cuota mundial |
|---|---|---|
| Canada | 15,000 | 30.6% |
| Russia | 10,000 | 20.4% |
| China | 6,300 | 12.9% |
| Belarus | 6,000 | 12.2% |
| Germany | 3,000 | 6.1% |
| Laos | 2,400 | 4.9% |
| Israel | 2,000 | 4.1% |
| Jordan | 1,800 | 3.7% |
| Chile | 600.0 | 1.2% |
| United States | 500.0 | 1.0% |
| Spain | 450.0 | 0.9% |
| Other countries | 350.0 | 0.7% |
| Brazil | 300.0 | 0.6% |
| Total mundial | 49,000 | 100% |
«Withheld» significa que el USGS suprimió el dato para evitar revelar información de una empresa concreta — no equivale a cero. Las filas por país no siempre suman el total mundial porque la fuente redondea cada cifra de forma independiente y no siempre desglosa una línea de «otros países».
Quién posee las reservas
Reserves, Recoverable ore
Reserves, Recoverable orethousand metric tons 2025
USGS Mineral Commodity Summaries 2026 · fuente ↗
| País | Reservas | Cuota mundial |
|---|---|---|
| Canada | 4,500,000 | 45.0% |
| Belarus | 3,300,000 | 33.0% |
| Other countries | 1,500,000 | 15.0% |
| United States | 970,000 | 9.7% |
| Brazil | 10,000 | 0.1% |
| Laos | Not applicable | — |
| Russia | Not applicable | — |
| Spain | Not applicable | — |
| Israel | Not applicable | — |
| Chile | Not applicable | — |
| China | Not applicable | — |
| Germany | Not applicable | — |
| Jordan | Not applicable | — |
| Total mundial | >10,000,000 | 100% |
La fuente publica este total mundial como un valor acotado y no como una cifra puntual, por lo que las cuotas de la última columna son también valores acotados.
Reserves: K2O equivalent
Reserves: K2O equivalentthousand metric tons 2025
USGS Mineral Commodity Summaries 2026 · fuente ↗
| País | Reservas | Cuota mundial |
|---|---|---|
| Russia | 2,000,000 | 33.9% |
| Canada | 1,100,000 | 18.6% |
| Laos | 1,000,000 | 16.9% |
| Belarus | 750,000 | 12.7% |
| Other countries | 300,000 | 5.1% |
| United States | 220,000 | 3.7% |
| China | 200,000 | 3.4% |
| Germany | 150,000 | 2.5% |
| Chile | 100,000 | 1.7% |
| Spain | 100,000 | 1.7% |
| Brazil | 2,300 | 0.0% |
| Israel | Large | — |
| Jordan | Large | — |
| Total mundial | >5,900,000 | 100% |
La fuente publica este total mundial como un valor acotado y no como una cifra puntual, por lo que las cuotas de la última columna son también valores acotados.
Precio
average, f.o.b. mine, dollars per metric ton of K2O equivalent: All products
Promedio anualdollars per metric ton
Base: average, f.o.b. mine, dollars per metric ton of K2O equivalent: All products. Promedios anuales publicados en USGS Mineral Commodity Summaries 2026 · fuente ↗. Estos son promedios anuales de referencia, no una cotización de mercado en tiempo real.
average, f.o.b. mine, dollars per metric ton of K2O equivalent: MOP
Promedio anualdollars per metric ton
Base: average, f.o.b. mine, dollars per metric ton of K2O equivalent: MOP. Promedios anuales publicados en USGS Mineral Commodity Summaries 2026 · fuente ↗. Estos son promedios anuales de referencia, no una cotización de mercado en tiempo real.
Minas que lo producen
Todas las minas →
Para qué se usa
Todos los mercados finales →| Mercado final | Lo que hace allí | Importancia |
|---|---|---|
| Agriculture & Food | The K in NPK | Definición de |
Cuánto necesita una tecnología
| Tecnología | Cantidad | Citado | Base |
|---|---|---|---|
| Alkaline Electrolyser | 100.0–400.0 kg | per MW of capacity | Potassium hydroxide electrolyte |
Indicative range compiled from published technology studies and chemistry; verify against a manufacturer specification before use. Ejecute estas cifras a cualquier escala en la calculadora de materiales →
Síguelo a través de las fronteras
Todos los recorridos →Adónde va realmente una partida de este material: cada país, cada custodio y qué queda atrás en cada paso.
Chilean brine to a battery in a car The ore is water. The first year and a half of processing is done by the sun, for free.