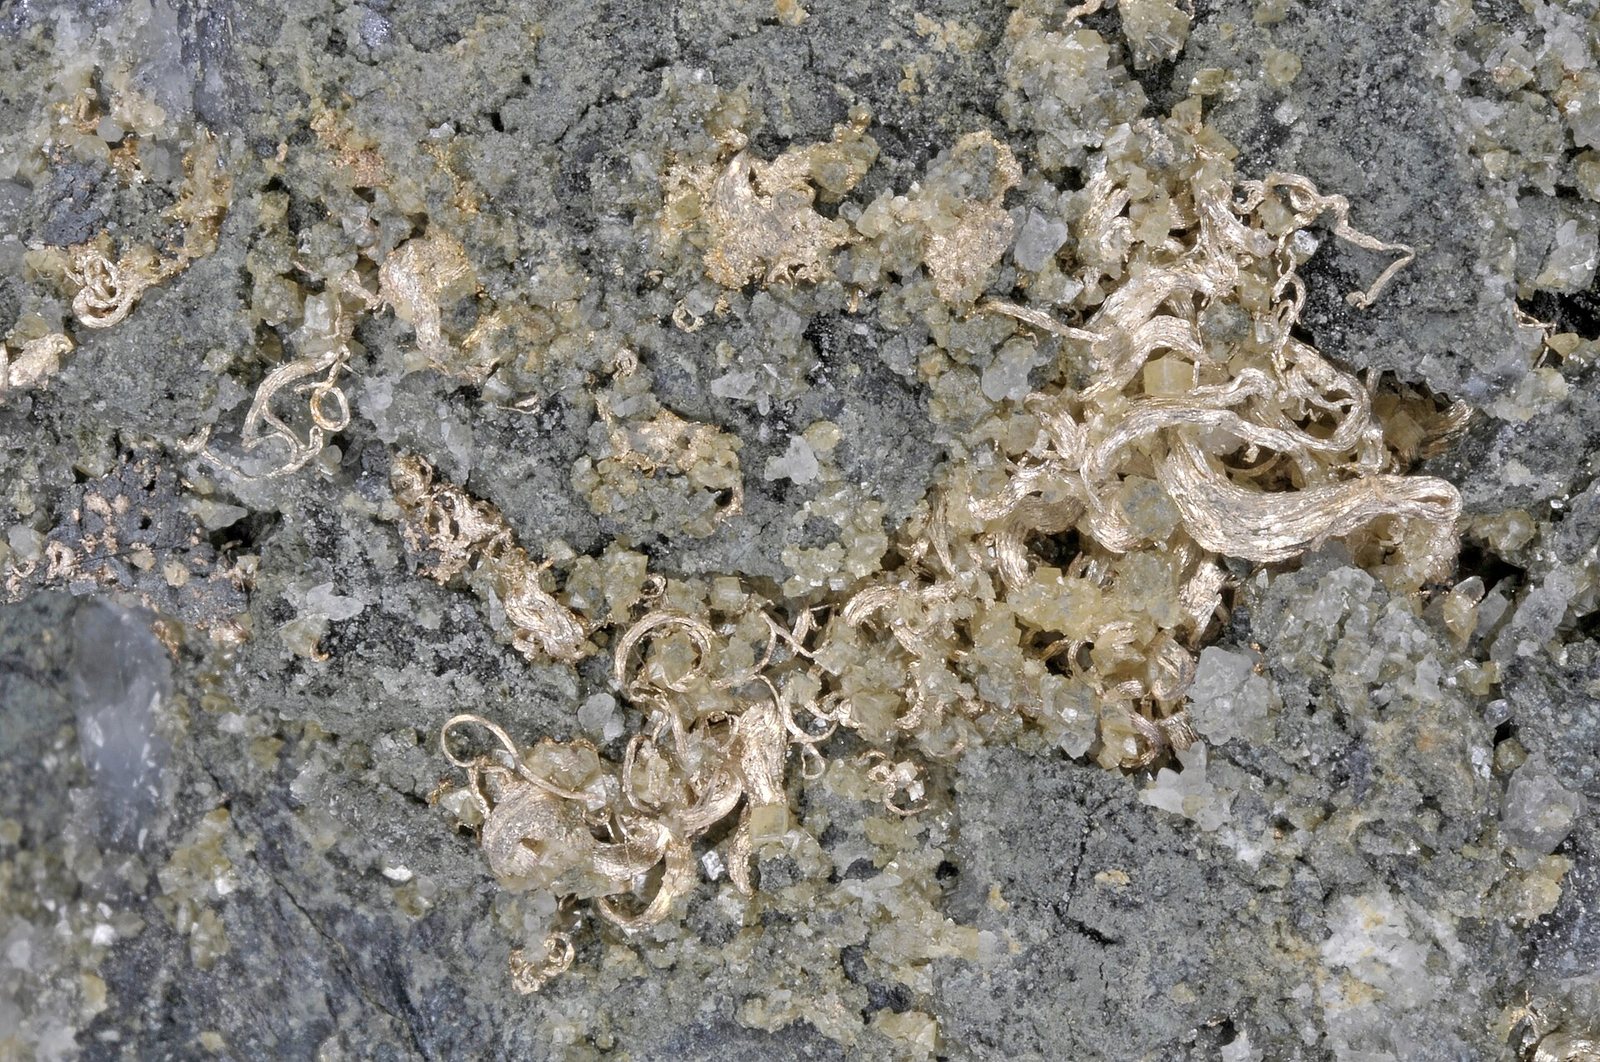
ما هو؟
The best electrical conductor there is, and the metal that has been used as money for longer than almost anything else.
لماذا يهم هذا؟
Half of silver demand is industrial, and the fastest-growing piece is the paste that carries current off a solar cell.
Where it is in the Earth
Silver is a rare element, and the geological processes that concentrate it into mineable deposits are varied and often indirect. The most important of these is hydrothermal activity: hot, mineral-laden water moving through fractures in the crust, cooling as it rises, and depositing its dissolved metals in veins and replacement bodies. Silver frequently travels with lead, zinc, copper and gold in these fluids, which is why the ore minerals listed in the table — galena (lead sulfide), acanthite (silver sulfide) and native gold alloyed with silver as electrum — so often occur together in the same deposit. When those hydrothermal fluids encounter reactive carbonate rocks such as limestone, they can replace large volumes of the host rock entirely, creating the massive sulfide bodies that carry much of the world's silver.
The geological term for the most productive silver-bearing district type in history is epithermal, meaning the deposit formed at shallow depth and relatively low temperature. The volcanic belts that ring the Pacific Ocean — through Mexico, Peru, Bolivia and down into Chile — provided exactly the right conditions: recent volcanism supplying the heat, faulted and fractured rock providing the pathways, and thick sequences of sedimentary rock providing the reactive hosts. This is why Latin America dominates the production table so completely. A second, older deposit type is the sediment-hosted or Broken Hill-type orebody, formed when seafloor sediments were buried and metamorphosed, concentrating silver alongside lead and zinc. Australia's Cannington mine is a textbook example of this style. Poland's KGHM deposits belong to a third family: stratiform copper-silver mineralisation in Permian sedimentary rocks, where silver is intimately bound up with copper sulfides rather than lead.
Because silver follows these base metals so closely through geological history, truly primary silver deposits — where silver is the dominant metal rather than a companion — are the exception rather than the rule. The great Comstock Lode in Nevada, Cerro Rico in Bolivia and a handful of Mexican districts qualify, but most silver in the ground exists because lead, zinc, copper or gold happened to be there first. That geological reality has profound consequences for how silver is mined and priced, which the sections below address.
Getting it out
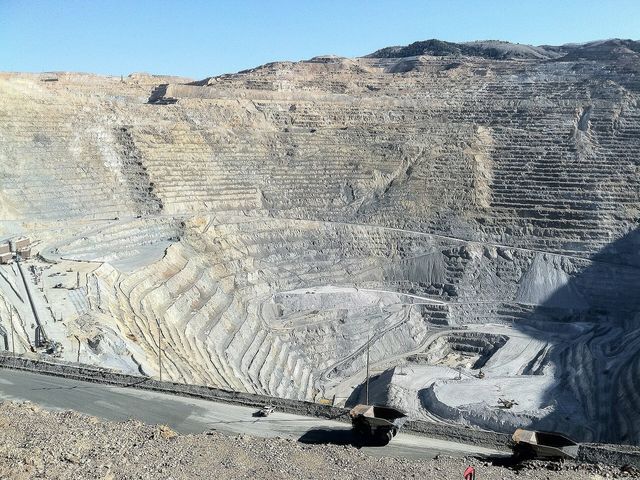
The method used to extract silver from the ground depends almost entirely on the primary metal the mine is really chasing. Because most silver is a by-product, it follows whatever extraction approach makes sense for lead, zinc, copper or gold. Large porphyry copper mines such as Escondida in Chile, Grasberg in Indonesia and Bingham Canyon in the United States operate as open-pit operations, moving enormous quantities of low-grade rock. The silver content in the ore at these mines is small per tonne, but the sheer scale of material processed means that collectively they contribute a significant portion of world supply. Open-pit mining suits these deposits because the ore is disseminated — spread through a large volume of rock — and stripping away the overlying waste to expose it is economically worthwhile only when the volumes mined are very large.
Underground mining is the right approach where ore is higher grade, narrower in geometry, or buried too deeply for an open pit to be practical. Cannington in Australia, which exploits a Broken Hill-type silver-lead-zinc orebody, operates underground. So does Olympic Dam, another Australian mine where silver appears alongside copper, uranium and gold in an iron-oxide copper-gold system. Underground methods recover less total rock but concentrate effort on the ore itself, which is why they suit richer or more complex deposits. Grade — the amount of silver per tonne of ore — is the number that determines which approach makes economic sense, and for a primary silver operation the threshold differs considerably from what a copper mine needs to find silver worth noting in its accounts at all.
What this means in practice is that the volume of waste rock moved per unit of silver produced varies enormously across the industry. A bulk open-pit copper mine produces silver almost as an afterthought, incurring no incremental mining cost for it. A primary silver underground mine must justify each metre of development entirely on the silver (and any associated lead or zinc). The by-product mines dominate total supply, and because their silver output is largely governed by decisions about copper, lead or zinc production, global silver mining volumes do not respond to silver prices in the straightforward way that a purely primary metal's supply would.
What pulls on it
Silver sits at an unusual intersection of monetary history and modern industry. For most of recorded history it functioned as currency, store of value and jewellery metal, and those uses persist: jewellery, silverware and investment (bars and coins) still account for a meaningful share of annual consumption. But the tables on this page show that industrial demand now accounts for roughly half of total use, and within that industrial share the fastest-growing application is the conductive paste printed onto the front face of crystalline silicon solar cells. That paste is the electrical pathway that carries current generated by the cell to the external circuit, and it is made from very fine silver powder. The intensity figure in the table — between 8 and 20 kilogrammes per megawatt of capacity — captures how much silver goes into a solar module, though the range is wide because cell designs differ and because the industry has been steadily reducing silver content per cell for years.
Beyond solar, silver's combination of the highest electrical conductivity of any element and good resistance to the formation of insulating oxides on its surface makes it the preferred contact material wherever reliable electrical switching matters: power-grid contactors and switchgear, automotive relays, consumer electronics. These applications tend to be mature and relatively stable in volume, contracting slowly as engineers find ways to use thinner layers or smaller contact areas. Medicine is a smaller but persistent market: silver's well-documented antimicrobial effect — bacteria cannot readily develop resistance to it in the way they do to antibiotics — keeps it in use in wound dressings and coatings for medical instruments. Nuclear power plants using pressurised-water reactor designs use a silver-indium-cadmium alloy in their control rods, a low-volume but highly specific application where substitution is tightly constrained by reactor licensing.
The direction of demand is therefore being pulled in two directions at once. Investment and jewellery demand fluctuates with economic sentiment and price expectations, and can swing sharply. Industrial demand is growing in aggregate because solar deployment is growing, but the solar industry is also systematically engineering silver out of each individual cell. Whether total solar-related silver consumption rises or falls over the coming years depends on which of those two forces — more modules installed versus less silver per module — runs faster. That tension is one of the genuinely unresolved questions in the silver market.
من أين يأتي في الصخر
جميع المعادن الخامة →هذه هي المعادن التي تحمل فعلياً silver. لا يُعدّ الرسوب خاماً إلا إذا كان تركيز أحد معادنه كافياً لتغطية تكاليف استخراجه.
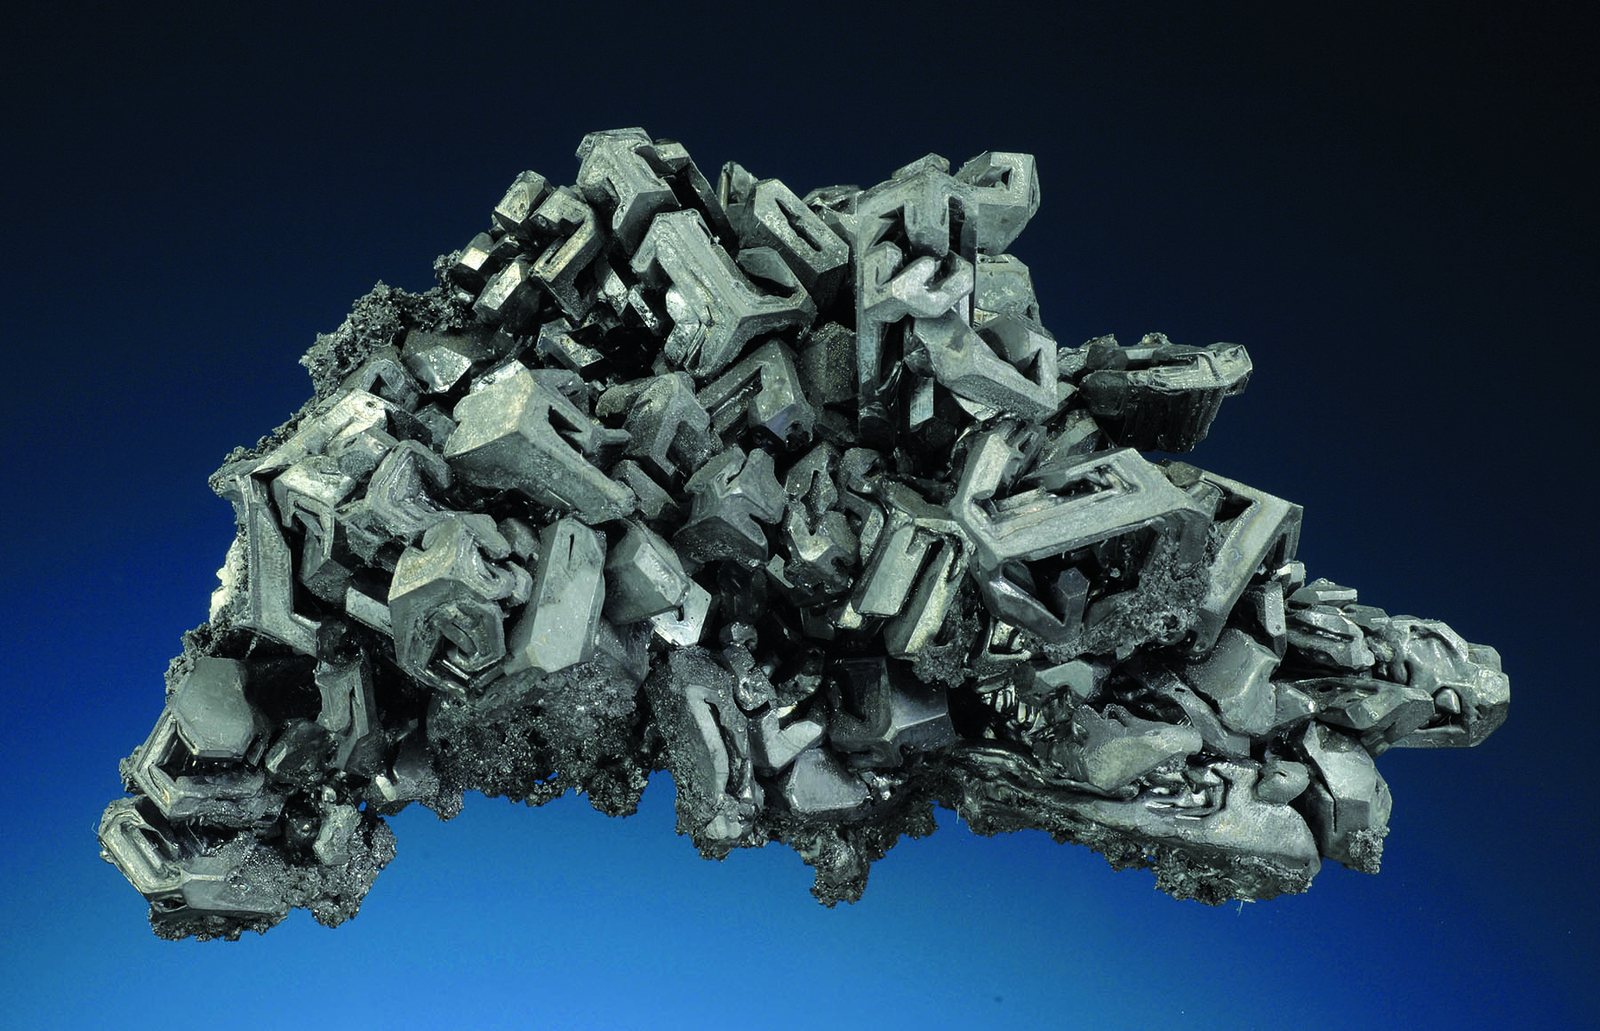
Acanthite (silver sulfide)
The main primary silver mineral, though most silver is recovered from lead-zinc and copper concentrates.
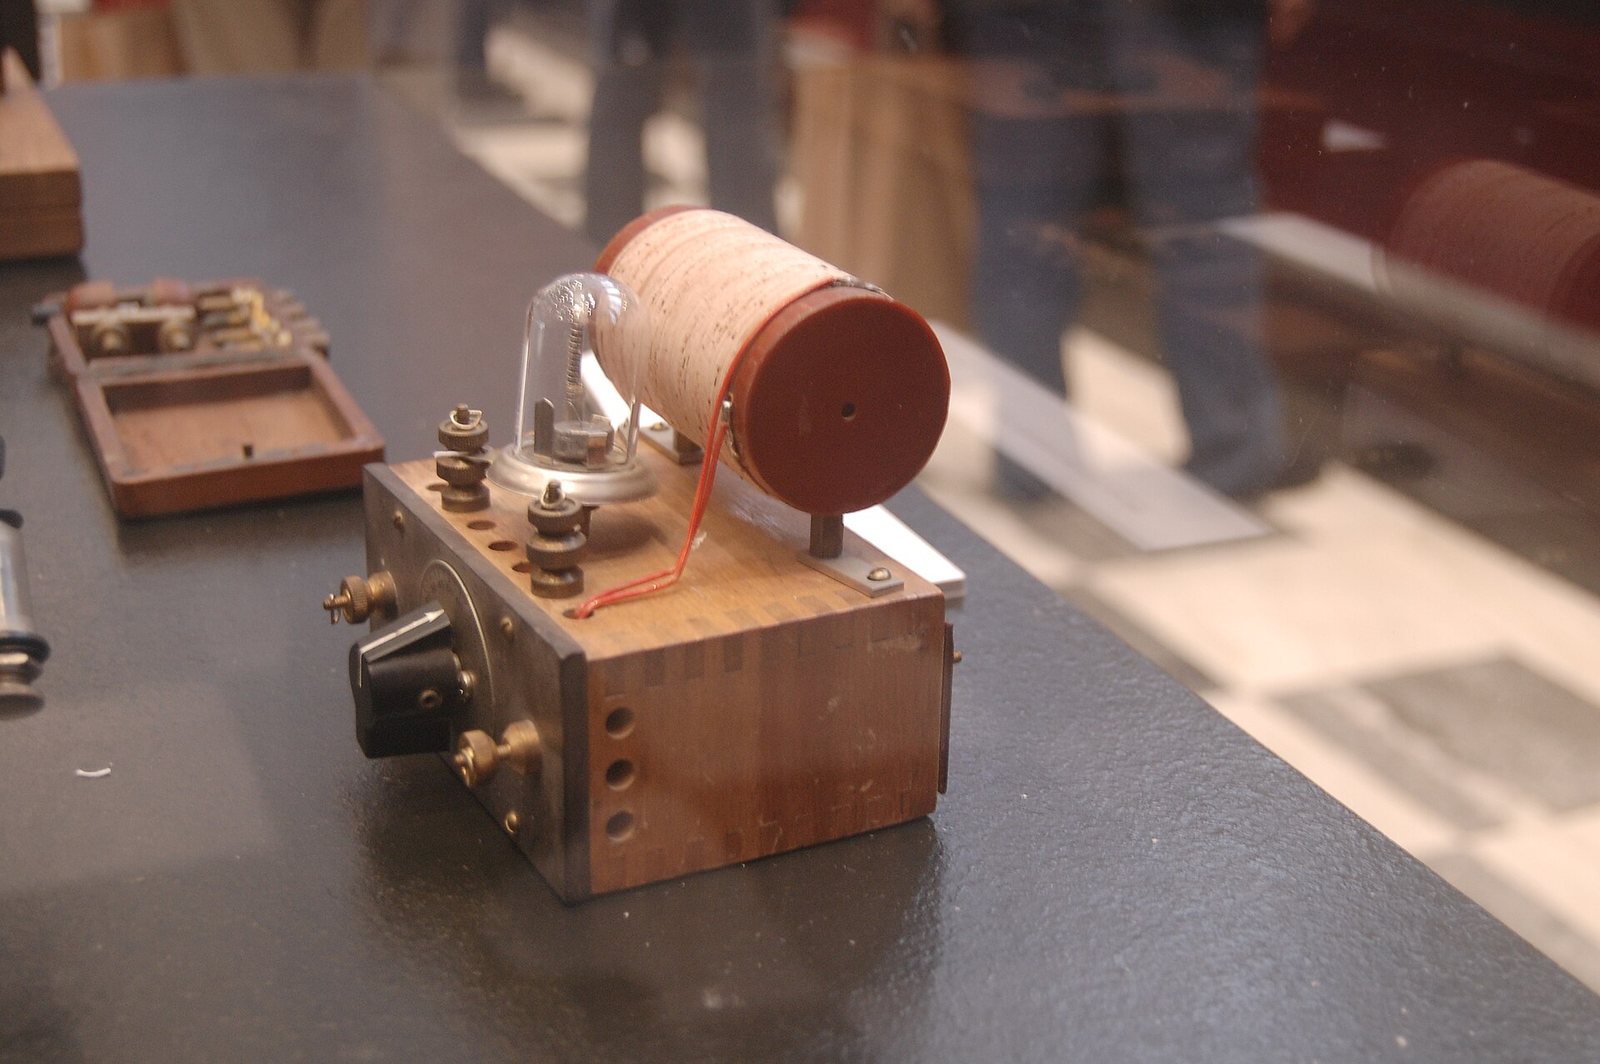
Galena
The main lead ore, and a principal carrier of silver — which is why most silver is a by-product.
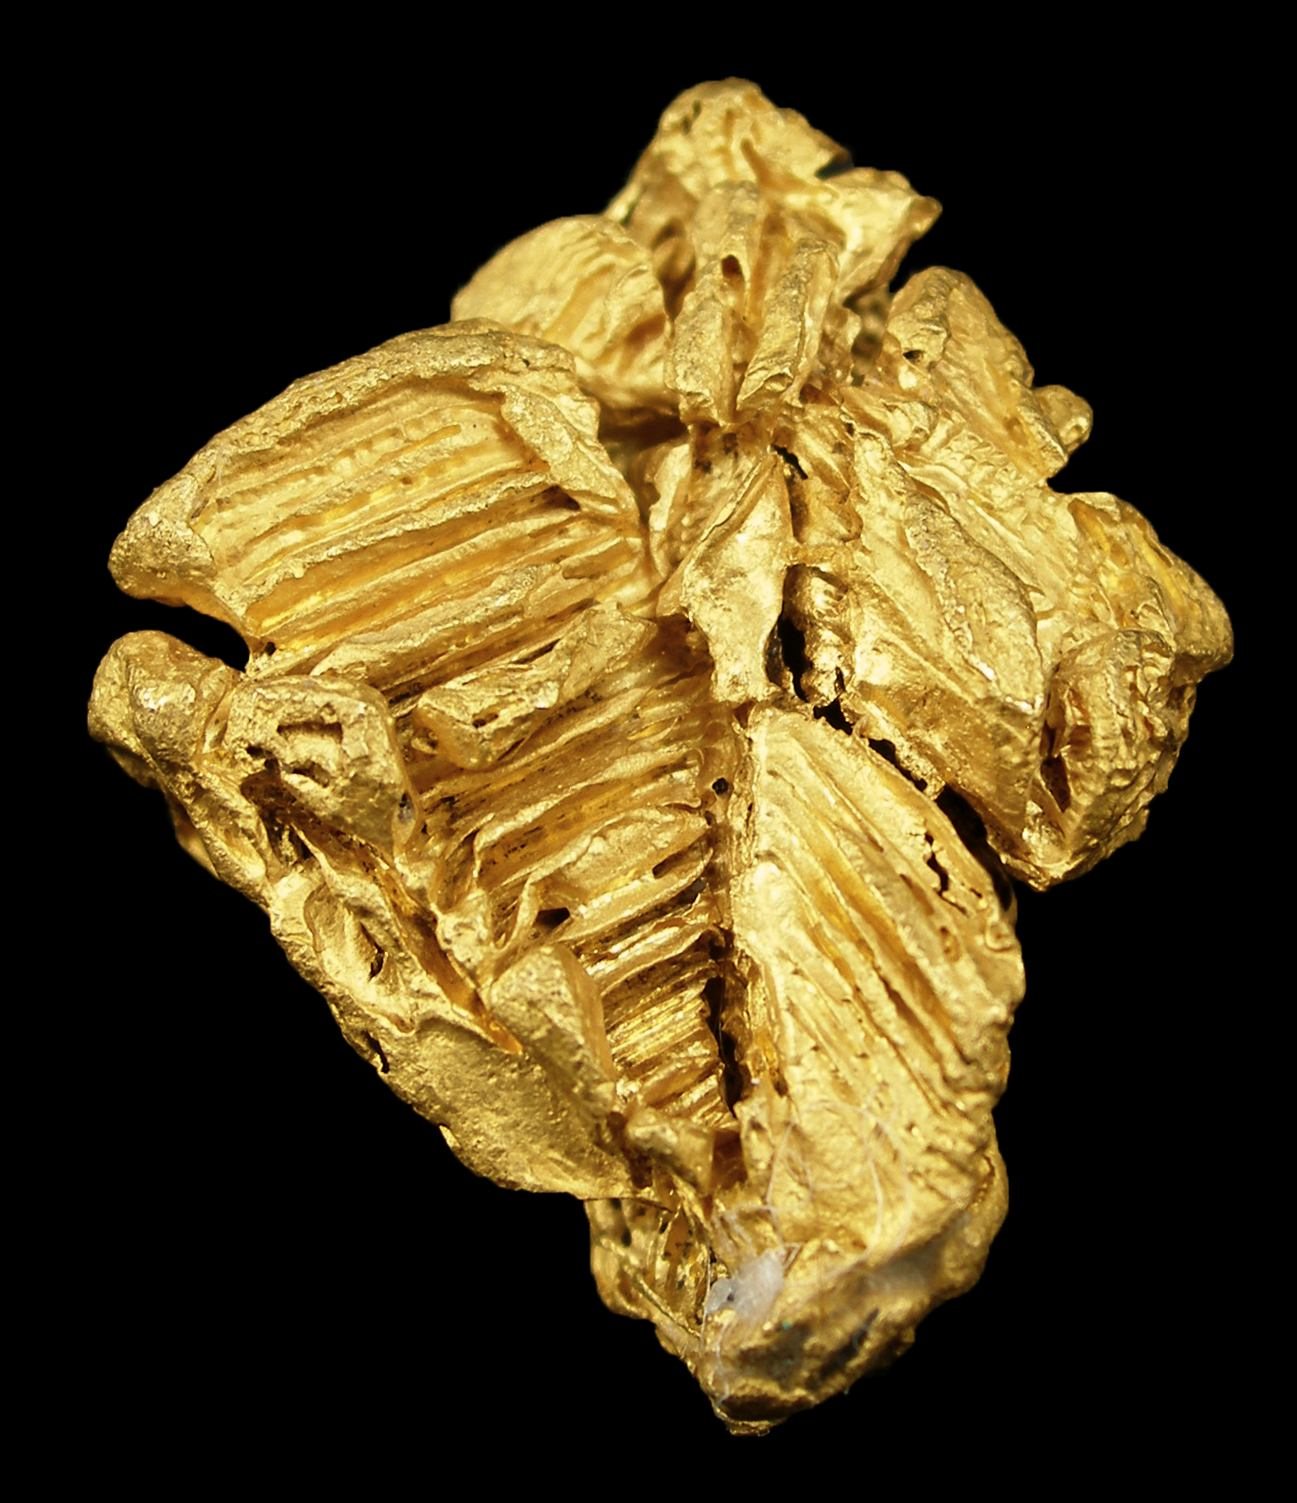
Native Gold
Gold occurs as the metal itself, usually as microscopic grains locked in sulfide or quartz rather than as visible…
من ينتجه
اعرضه على خريطة →Mine production
Mine productionmetric tons 2025 (مُقدَّر) المجموع العالمي 26,000 metric tons
USGS Mineral Commodity Summaries 2026 · Mine production of contained silver; most of it is a by-product of lead, zinc, copper and gold mining. · المصدر ↗
مرِّر الجدول أفقياً لعرض الأعمدة المتبقية.
| الدولة | الإنتاج | حصة من العالم |
|---|---|---|
| Mexico | 6,300 | 24.2% |
| Peru | 3,600 | 13.8% |
| China | 3,400 | 13.1% |
| Other countries | 2,100 | 8.1% |
| Bolivia | 1,500 | 5.8% |
| Chile | 1,400 | 5.4% |
| Poland | 1,300 | 5.0% |
| Russia | 1,200 | 4.6% |
| United States | 1,100 | 4.2% |
| Australia | 1,000 | 3.8% |
| Argentina | 800.0 | 3.1% |
| India | 800.0 | 3.1% |
| Kazakhstan | 630.0 | 2.4% |
| Sweden | 400.0 | 1.5% |
| Canada | 400.0 | 1.5% |
| المجموع العالمي | 26,000 | 100% |
«محجوب» يعني أن USGS أخفى الرقم تفاديًا للإفصاح عن بيانات شركة بعينها — وهو لا يعني صفرًا. لا يُساوي مجموع صفوف الدول دائمًا المجموع العالمي لأن المصدر يُقرِّب كل رقم باستقلالية ولا يُفصِّل دائمًا خانة «دول أخرى».
من يحتفظ بالاحتياطيات
Reserves
Reservesmetric tons 2025
USGS Mineral Commodity Summaries 2026 · المصدر ↗
| الدولة | الاحتياطيات | حصة من العالم |
|---|---|---|
| Peru | 110,000 | 18.0% |
| Russia | 92,000 | 15.1% |
| Australia | 91,000 | 14.9% |
| China | 67,000 | 11.0% |
| Poland | 59,000 | 9.7% |
| Other countries | 57,000 | 9.3% |
| Mexico | 37,000 | 6.1% |
| Chile | 33,000 | 5.4% |
| United States | 23,000 | 3.8% |
| Bolivia | 22,000 | 3.6% |
| India | 8,000 | 1.3% |
| Argentina | 6,500 | 1.1% |
| Canada | 4,900 | 0.8% |
| Kazakhstan | Not applicable | — |
| Sweden | Not applicable | — |
| المجموع العالمي | 610,000 | 100% |
السعر
bullion, average, dollars per troy ounce
المتوسط السنويdollars per troy ounce
الأساس: bullion, average, dollars per troy ounce. متوسطات سنوية كما نُشرت في USGS Mineral Commodity Summaries 2026 · المصدر ↗. هذه متوسطات سنوية مرجعية، وليست أسعار سوق آنية.
المناجم المنتِجة له
جميع المناجم →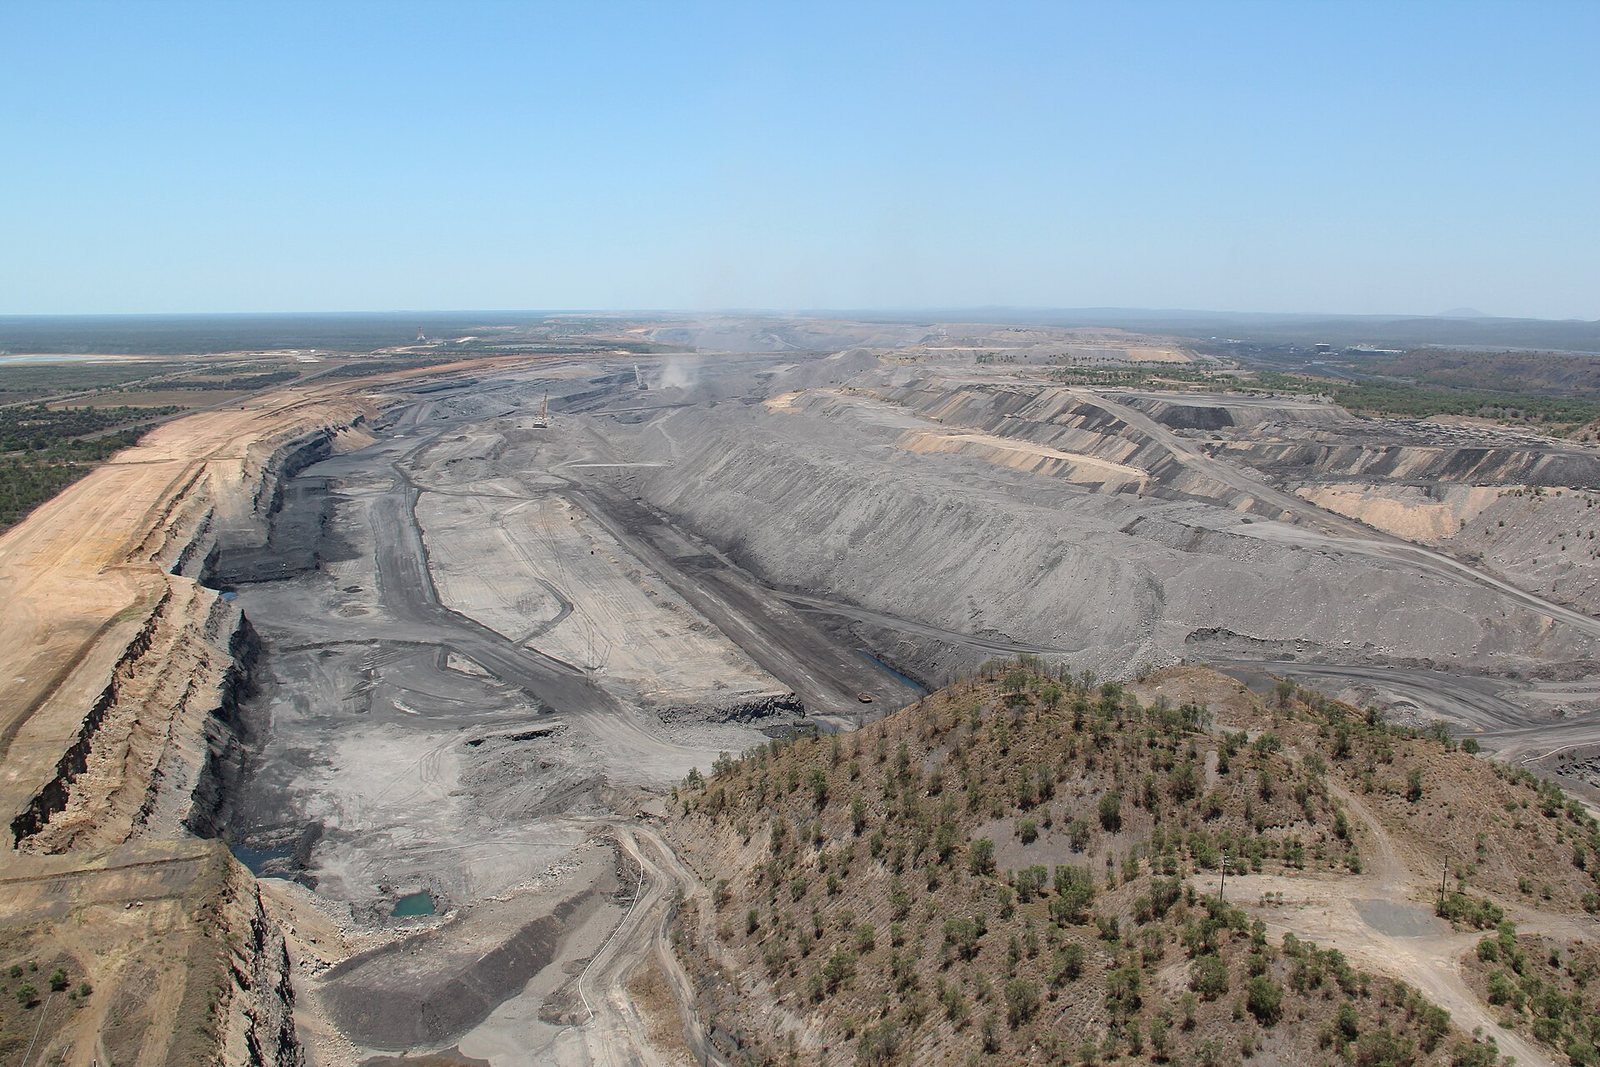
Bingham Canyon
The largest excavation made by people.

Cerro Verde
One of the largest concentrator complexes in the world by throughput.
Collahuasi
Among the largest copper mines by output.
Escondida
Consistently the largest copper mine in the world by output.
Grasberg
One of the largest copper deposits and among the largest gold deposits ever mined.
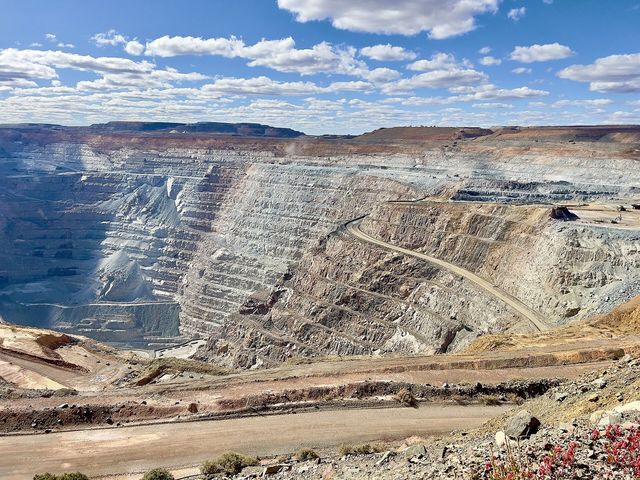
Kalgoorlie Super Pit (Fimiston)
One of the largest open-pit gold mines in the world.
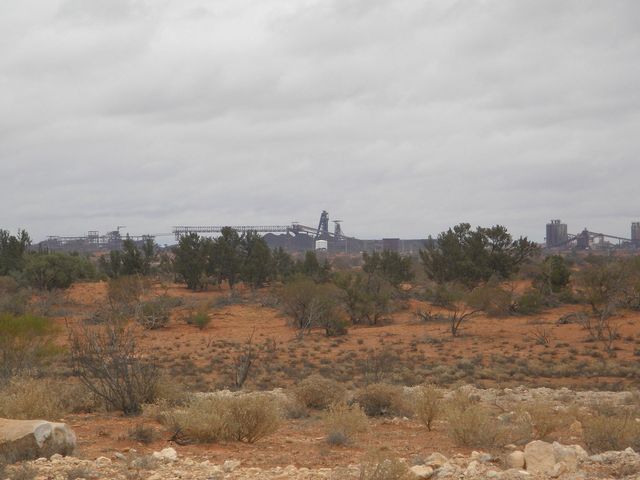
Olympic Dam
One of the largest single orebodies of any kind, holding copper, uranium, gold and silver together.
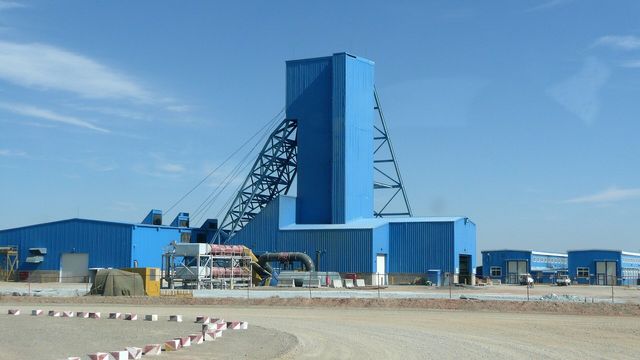
Oyu Tolgoi
Expected to become one of the largest copper mines in the world as the block cave ramps up.
أين تتم معالجته وتكريره
| المنشأة | النوع | المرحلة | الدولة | الدور |
|---|---|---|---|---|
| Atlantic Copper Smelter, Huelva | المصهر | المعالجة | Spain | المخرجات |
| Guixi Smelter | المصهر | المعالجة | China | المخرجات |
ما الذي يُستخدم فيه
جميع الأسواق النهائية →| السوق النهائية | ما الذي يؤديه هناك | الأهمية |
|---|---|---|
| Solar Power | Front-contact conductive paste | تعريف |
| Power Grids | Contacts and switchgear | الحاضر |
| Nuclear Power | Control-rod alloy in some PWR designs | الحاضر |
| Medicine & Health | Antimicrobial dressings | الحاضر |
ما تحتاجه التقنية منه
| التقنية | الكمية | مُدرج | الأساس |
|---|---|---|---|
| Crystalline Silicon Solar Module Falling with every generation of cell design. | 8.00–20.00 kg | per MW of capacity | Front-contact paste |
Indicative range compiled from published technology studies and chemistry; verify against a manufacturer specification before use. شغّل هذه الأرقام على أي نطاق في حاسبة المواد →
ضوابط التصدير
| الدولة | سيطرة | ينطبق على |
|---|---|---|
| China | Export licensing requirement for materials and technologies | Antimony (2024), bismuth (2025), synthesized diamond (2025), gallium (2023), germanium (2023), graphite (2023), indium (2025), magnesium materials (2024), molybdenum (2025), rare earths (2025), silver (2026), tellurium (2025), tungsten (2025), and items related to lithium batteries and artificial graphite anode materials (2025). ↗ |
| Laos | Export ban | Raw minerals, including copper, gold, iron, nickel, potassium, silver, and zinc (2024). ↗ |
| Tanzania | Export ban | Ore concentrates of copper, gold, nickel, and silver (2017). ↗ |
| Venezuela | Export ban | Bauxite, cassiterite, columbite-tantalite, copper, gold, rhodium, silver, and thorium (2024). ↗ |
USGS Mineral Commodity Summaries 2026, table 4 — controls in effect as of January 2026, excluding controls since lifted.