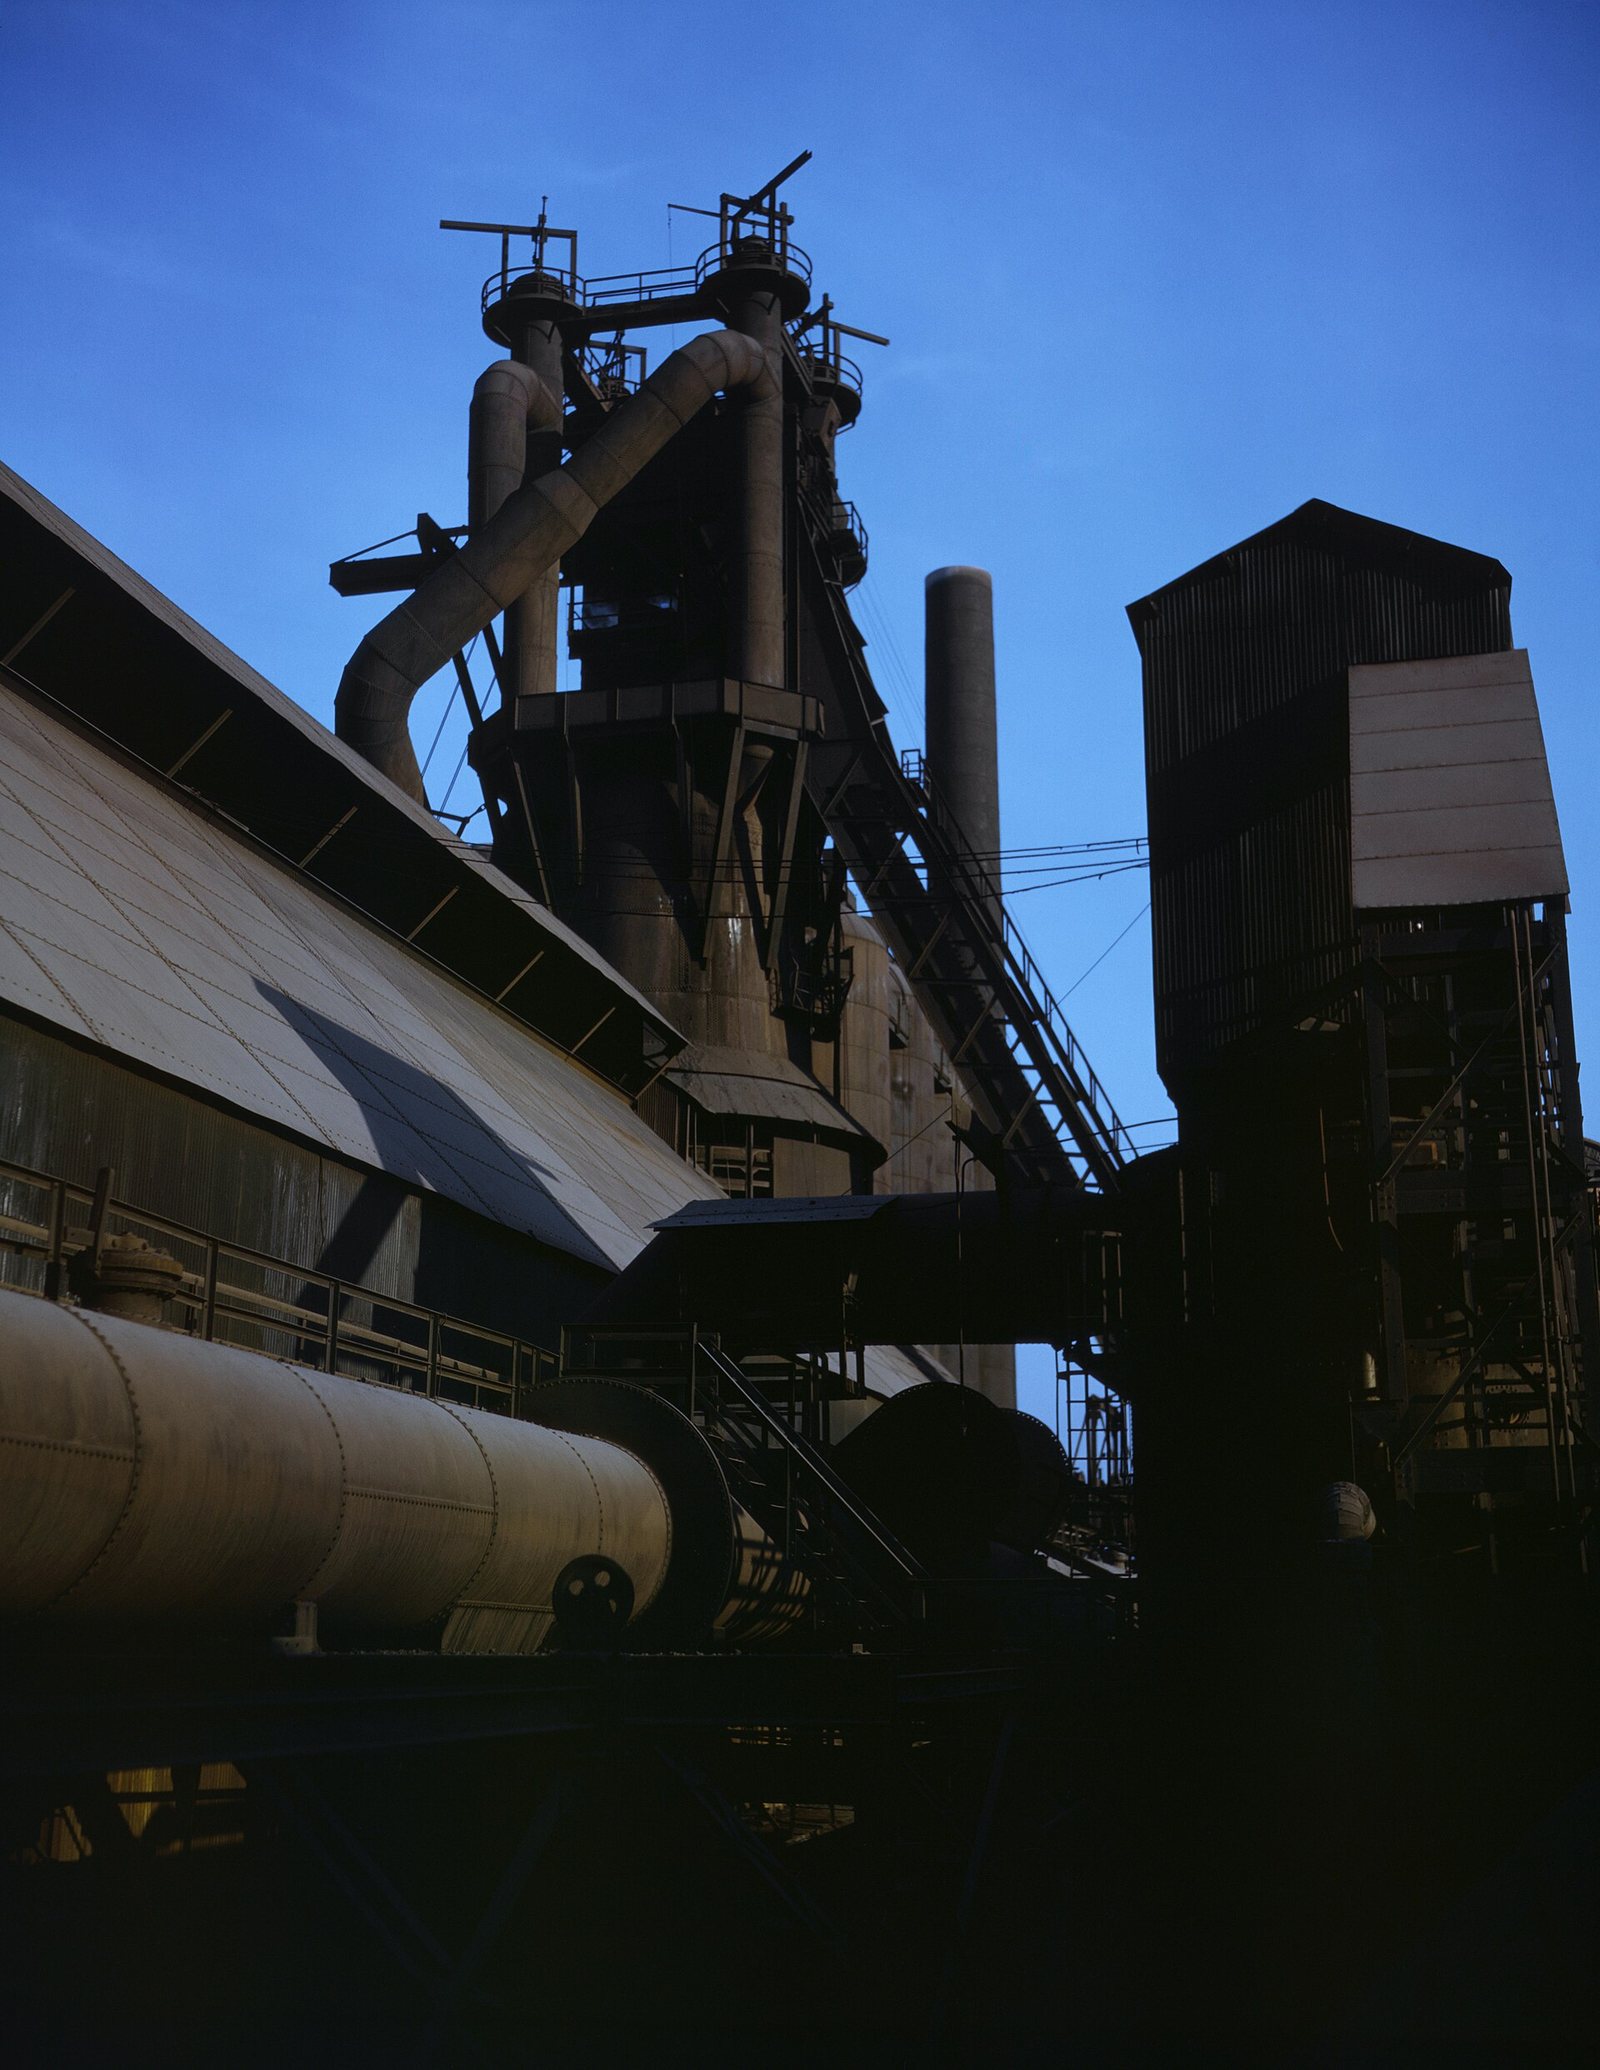
Qu'est-ce que c'est ?
Iron with a little carbon in it, and the most-produced manufactured material on the planet.
Pourquoi est-ce important ?
Steelmaking is around seven to nine percent of global CO2 emissions, which is why hydrogen and electric-arc routes matter so much.
Where it is in the Earth
Iron is the fourth most abundant element in the Earth's crust, yet the ore bodies that feed steelmakers are not simply wherever iron happens to be. Concentration matters. The deposits that are actually mined formed under conditions that gathered iron into minerals rich enough to be worth extracting — conditions that were, in most cases, billions of years old before a single human set foot on the planet.
The dominant source of iron ore is a rock type called banded iron formation, or BIF. These are ancient sedimentary sequences, laid down mostly between about two and a half and one and a half billion years ago, in which thin alternating layers of iron-rich minerals and silica (essentially fine quartz) were deposited on the floors of shallow seas. The current explanation for why so much iron settled out at that particular moment in Earth's history is that the oceans were then nearly devoid of dissolved oxygen. Iron dissolved easily in those oxygen-poor waters, and when photosynthesising microbes began releasing oxygen, the iron was oxidised and precipitated in vast quantities. Later geological events — heat, pressure, the circulation of hot fluids through the rock — upgraded some of these formations by leaching out the silica and leaving behind concentrations of iron oxide minerals, chiefly haematite and magnetite. The richest deposits, sometimes called direct-shipping ore, carry enough iron that they can be sent to a steelmaker with minimal processing. The leaner BIF deposits require more work before they are useful.
The great ore provinces of Australia's Pilbara, Brazil's Iron Quadrangle and the Lake Superior region of North America are all ancient BIF sequences that have been preserved and, in places, naturally enriched. Younger iron deposits also exist — formed by magmatic processes, by sedimentary accumulation in more recent seas, or by weathering that concentrates iron near the surface — but BIF-hosted ore dominates global supply by a wide margin. The geography of production therefore reflects geology more than politics: the major exporters are those countries where these ancient formations happen to be large, near-surface and well-connected to ports.
Getting it out
Iron ore is mined almost entirely in open pits. The ore bodies are large, the rock is hard but not especially complex, and the economics of open-pit mining — moving enormous volumes of material with big trucks and shovels — suit the low value-per-tonne nature of the commodity. Underground mining does occur, notably in parts of Sweden where the ore body extends deep beneath the surface, but it is exceptional rather than typical.
The grade of an ore body — that is, the proportion of iron it contains by weight — matters enormously to the economics of mining. High-grade direct-shipping ore can be loaded, shipped and used at a steelmaker's blast furnace with little more than crushing and screening to remove fines. Lower-grade ore, including much of the magnetite ore found in parts of Australia and elsewhere, must be ground finely and concentrated before it is useful, which adds cost and energy. The ratio of waste rock removed to ore actually recovered, sometimes called the strip ratio, can be very large in open-pit operations: a great deal of rock that contains no useful iron must be moved to expose the ore beneath it, and managing that waste safely and at scale is one of the defining engineering and environmental challenges of large iron ore mines.
Pelletising is the process used to make concentrated lower-grade ore suitable for a blast furnace or direct-reduction plant. The fine concentrate is mixed with a binder, rolled into small balls and fired in a kiln to harden them. Pellets are more consistent in chemistry and physical form than lump ore, which matters to the efficiency of the furnace receiving them. The shift toward lower-grade deposits, as the richest direct-shipping ore is gradually depleted, means that pelletising capacity is becoming a more significant part of the overall supply chain.
What pulls on it
Steel is a material of structure and motion. The largest single pull on it comes from construction — buildings, bridges, roads, rail lines and the infrastructure beneath cities. This demand is closely tied to the rate at which the built environment is being created or renewed, which in turn reflects where in the world income growth is fastest and where populations are urbanising. The tables on this page show that China accounts for the largest share of both production and, by implication, consumption, reflecting several decades of intensive urbanisation and infrastructure building. India's figures point to a country that is considerably earlier in the same process.
Beyond construction, manufacturing of all kinds pulls on steel: vehicles, machinery, appliances, ships, pipelines and agricultural equipment all depend on it. The intensity figures on this page give a sense of how some newer demand categories translate into tonnes of steel. A single direct-drive offshore wind turbine requires a very large mass of steel in its tower, nacelle frame and foundation — the figures given run into the hundreds of thousands of kilograms per megawatt of capacity. Alkaline electrolysers for hydrogen production and HVDC cable armouring are further examples of demand categories linked to energy transition infrastructure, and these are growing from a low base as deployment of those technologies increases.
Demand for steel would change sharply in either direction only under fairly large structural shifts. A sustained slowdown in construction activity in the major consuming economies — or a material change in how buildings and infrastructure are built — would reduce the absolute volume required. On the growth side, the scale of energy transition infrastructure, if fully built out over the coming decades, represents a substantial additional call on steel output, though the timing and pace remain uncertain.
Qui le produit
Voir sur une carte →Pig iron
Pig ironmillion metric tons 2025 (estimé) Total mondial 1,300 million metric tons
USGS Mineral Commodity Summaries 2026 · Crude steel production in million tonnes; blast-furnace and electric-arc routes are not distinguished in the headline figure. · source ↗
Faire défiler le tableau latéralement pour afficher les colonnes restantes.
| Pays | Production | Part mondiale |
|---|---|---|
| China | 830.0 | 63.8% |
| India | 98.00 | 7.5% |
| Other countries | 61.00 | 4.7% |
| Japan | 59.00 | 4.5% |
| Russia | 47.00 | 3.6% |
| Korea, Republic of | 41.00 | 3.2% |
| Brazil | 28.00 | 2.2% |
| Germany | 25.00 | 1.9% |
| United States | 21.00 | 1.6% |
| Vietnam | 14.00 | 1.1% |
| Turkey | 10.00 | 0.8% |
| Iran | 4.00 | 0.3% |
| Total mondial | 1,300 | 100% |
Raw steel
Raw steelmillion metric tons 2025 (estimé) Total mondial 1,900 million metric tons
USGS Mineral Commodity Summaries 2026 · Crude steel production in million tonnes; blast-furnace and electric-arc routes are not distinguished in the headline figure. · source ↗
Faire défiler le tableau latéralement pour afficher les colonnes restantes.
| Pays | Production | Part mondiale |
|---|---|---|
| China | 980.0 | 51.6% |
| Other countries | 230.0 | 12.1% |
| India | 160.0 | 8.4% |
| United States | 82.00 | 4.3% |
| Japan | 81.00 | 4.3% |
| Russia | 65.00 | 3.4% |
| Korea, Republic of | 60.00 | 3.2% |
| Germany | 38.00 | 2.0% |
| Turkey | 37.00 | 1.9% |
| Brazil | 35.00 | 1.8% |
| Iran | 32.00 | 1.7% |
| Vietnam | 23.00 | 1.2% |
| Total mondial | 1,900 | 100% |
steel slag production was estimated to be between 190 million and 290 million tons
steel slag production was estimated to be between 190 million and 290 million tonsmillion metric tons 2025 (estimé) Total mondial 240.0 million metric tons
USGS Mineral Commodity Summaries 2026 · Crude steel production in million tonnes; blast-furnace and electric-arc routes are not distinguished in the headline figure. · source ↗
Faire défiler le tableau latéralement pour afficher les colonnes restantes.
| Pays | Production | Part mondiale |
|---|---|---|
| Total mondial | 240.0 | 100% |
world iron slag production was estimated to be between 330 million and 390 million tons,
world iron slag production was estimated to be between 330 million and 390 million tons,million metric tons 2025 (estimé) Total mondial 360.0 million metric tons
USGS Mineral Commodity Summaries 2026 · Crude steel production in million tonnes; blast-furnace and electric-arc routes are not distinguished in the headline figure. · source ↗
Faire défiler le tableau latéralement pour afficher les colonnes restantes.
| Pays | Production | Part mondiale |
|---|---|---|
| Total mondial | 360.0 | 100% |
« Withheld » signifie que l'USGS a supprimé le chiffre afin de ne pas divulguer les données d'une entreprise individuelle — cela ne signifie pas zéro. La somme des lignes par pays ne correspond pas toujours au total mondial, car la source arrondit chaque chiffre de manière indépendante et ne détaille pas toujours une ligne « autres pays ».
Prix
average unit value, free on board plant, dollars per metric ton
Moyenne annuelledollars per metric ton
Base: average unit value, free on board plant, dollars per metric ton. Moyennes annuelles telles que publiées dans USGS Mineral Commodity Summaries 2026 · source ↗. Il s'agit de moyennes annuelles de référence, et non de cotations de marché en temps réel.
Producer price index, steel mill products (1982=100)
Moyenne annuelleindex
Base: Producer price index, steel mill products (1982=100). Moyennes annuelles telles que publiées dans USGS Mineral Commodity Summaries 2026 · source ↗. Il s'agit de moyennes annuelles de référence, et non de cotations de marché en temps réel.
Où c'est traité et raffiné
| Usine | Type | Étape | Pays | Rôle |
|---|---|---|---|---|
| Wind Turbine Nacelle & Blade Plants, Jutland | Usine de fabrication | Produit | Denmark | Intrant |
À quoi cela sert
Tous les marchés finaux →| Marché final | Ce qu'il fait là-bas | Importance |
|---|---|---|
| Power Grids | Towers, transformer cores and enclosures | Définition de |
| Wind Power | Tower, nacelle frame and foundation | Définition de |
| Construction & Steel | Structure, rebar and rail | Définition de |
| Electric Vehicles | Structure and motor laminations | Important |
| Data Centres & AI | Structure and enclosures | Important |
| Hydrogen & Electrolysis | Stacks, vessels and piping | Important |
Quelle quantité en nécessite une technologie
| Technologie | Quantité | Coté | Base |
|---|---|---|---|
| Alkaline Electrolyser | 2,000–5,000 kg | per MW of capacity | Stack, frames and vessels |
| Direct-Drive Offshore Wind Turbine Dominates the mass by far. | 100,000–180,000 kg | per MW of capacity | Tower, nacelle and foundation |
| EV Traction Motor | 20.00–40.00 kg | per motor | Electrical steel laminations |
| HVDC Transmission Cable | 20.00–80.00 t | per km of circuit | Armouring |
Indicative range compiled from published technology studies and chemistry; verify against a manufacturer specification before use. Appliquer ces chiffres à n'importe quelle échelle dans le calculateur de matériaux →
Contrôles à l'exportation
| Pays | Contrôle | S'applique à |
|---|---|---|
| Laos | Export ban | Raw minerals, including copper, gold, iron, nickel, potassium, silver, and zinc (2024). ↗ |
| Vietnam | Export ban | Raw materials of iron, lead-zinc, chromite, manganese, apatite, and rare earths and deeply processed titanium (2012). ↗ |
USGS Mineral Commodity Summaries 2026, table 4 — controls in effect as of January 2026, excluding controls since lifted.
Suivez-le au fil des frontières
Tous les parcours →Où va réellement un lot de ce matériau — chaque pays, chaque dépositaire, et ce qui est perdu à chaque étape.
New Caledonian laterite to stainless steel An island that smelts its own ore, and pays for it with the most expensive electricity in the industry.