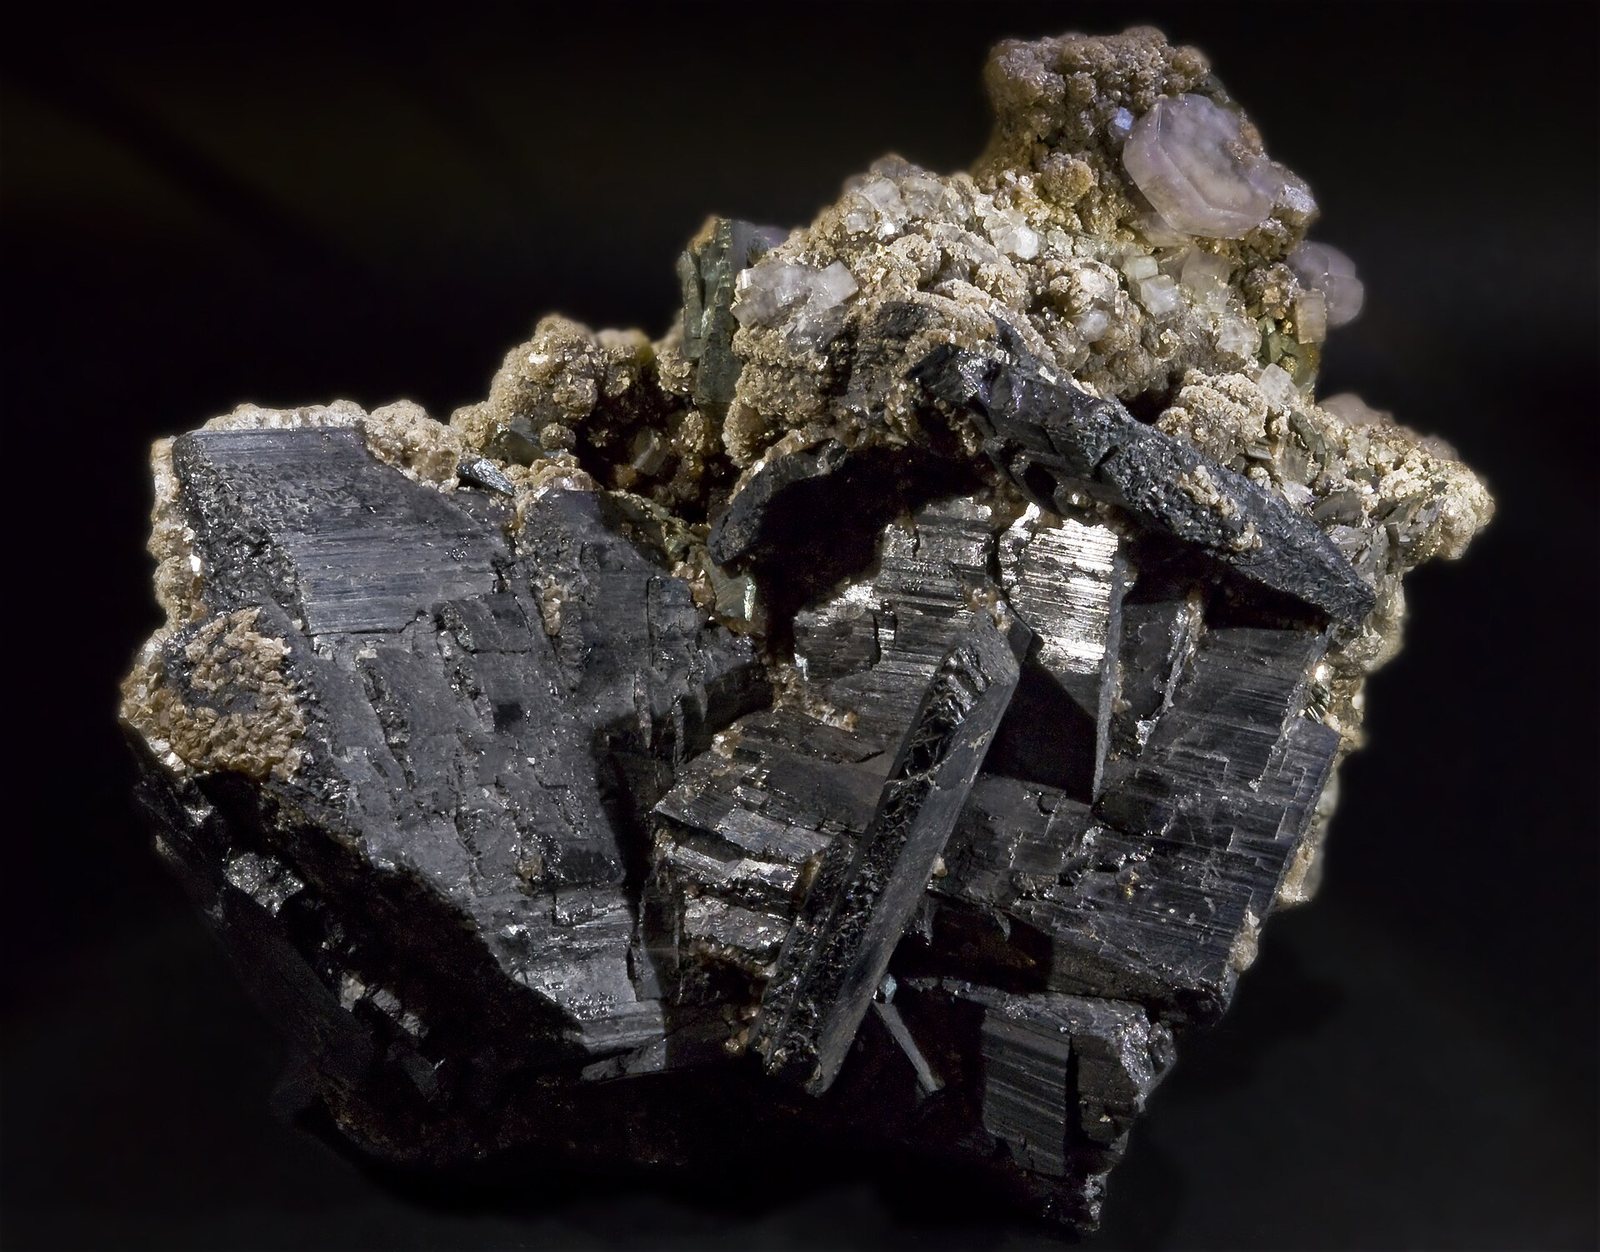
Что это такое?
The metal with the highest melting point of them all — you can heat it to 3,400 C before it turns liquid.
Почему это важно?
Tungsten carbide is what cuts, drills and mills every other metal. Industrial capacity depends on it in a way that is easy to overlook.
Развёрнутые текстовые разделы по этому материалу ещё не опубликованы. Всё приведённое ниже взято непосредственно из исходных наборов данных и является полным.
Откуда берётся в породе
Все рудные минералы →Это минералы, которые реально содержат tungsten. Залежь является рудным телом лишь в том случае, если концентрация одного из компонентов достаточна, чтобы окупить добычу.
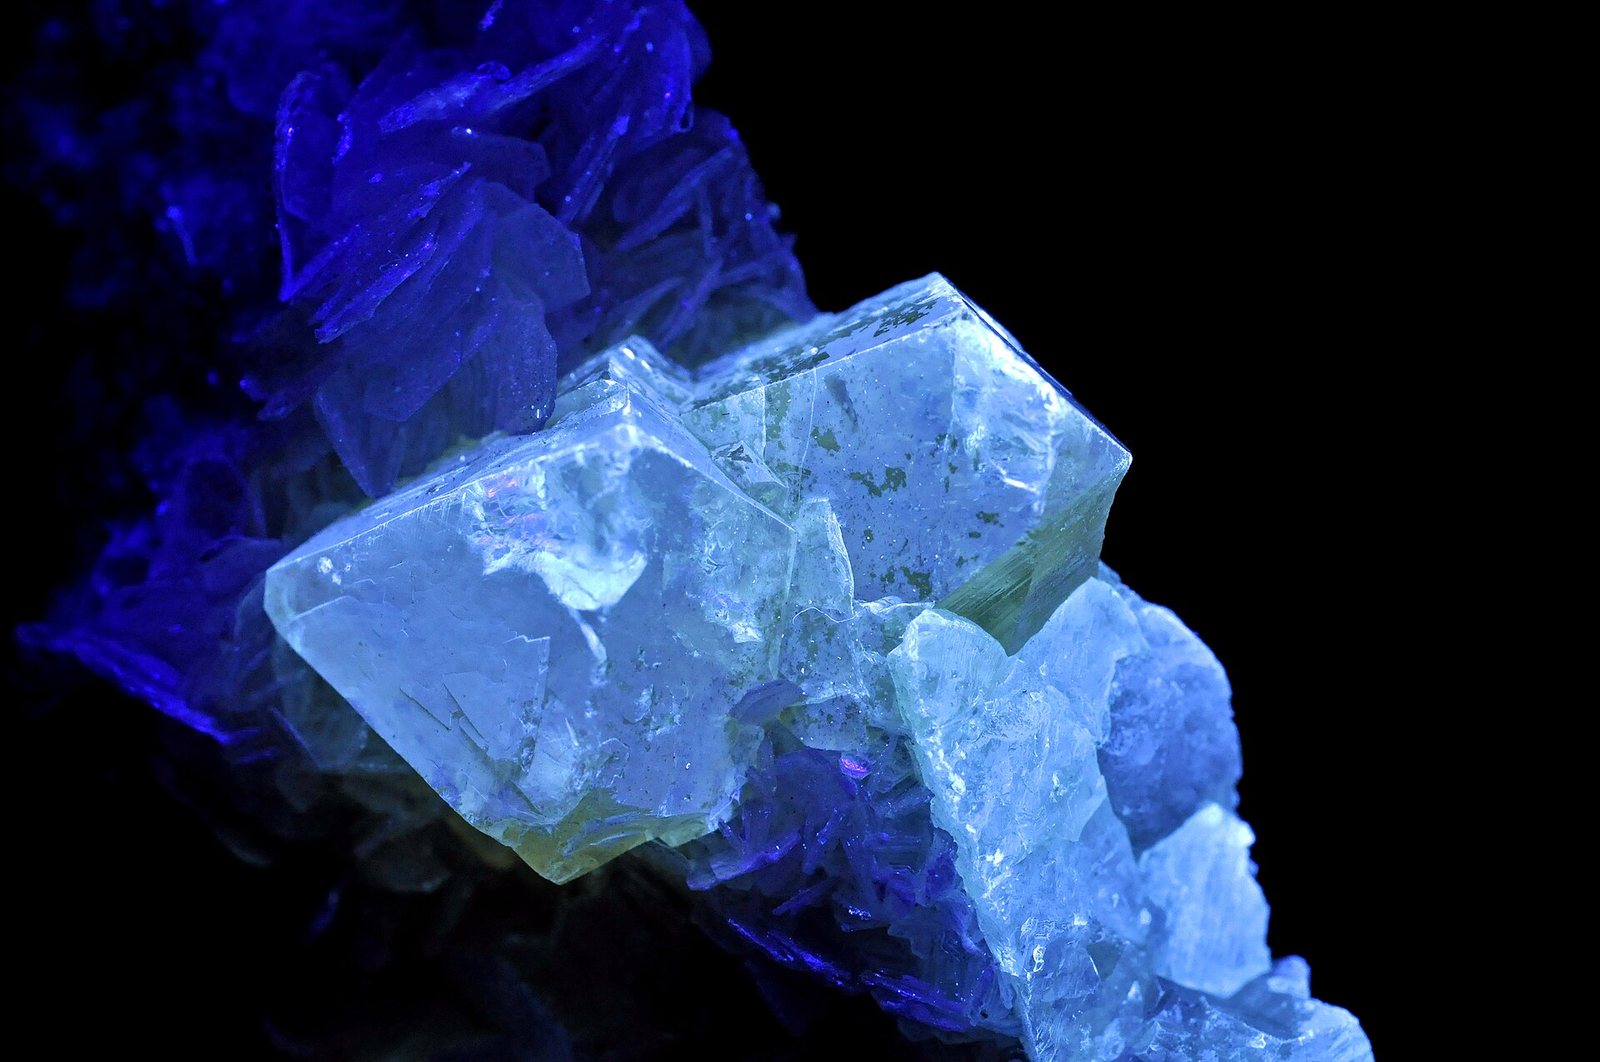
Scheelite
The skarn tungsten mineral. Its bright blue fluorescence under UV light is a standard field prospecting tool.
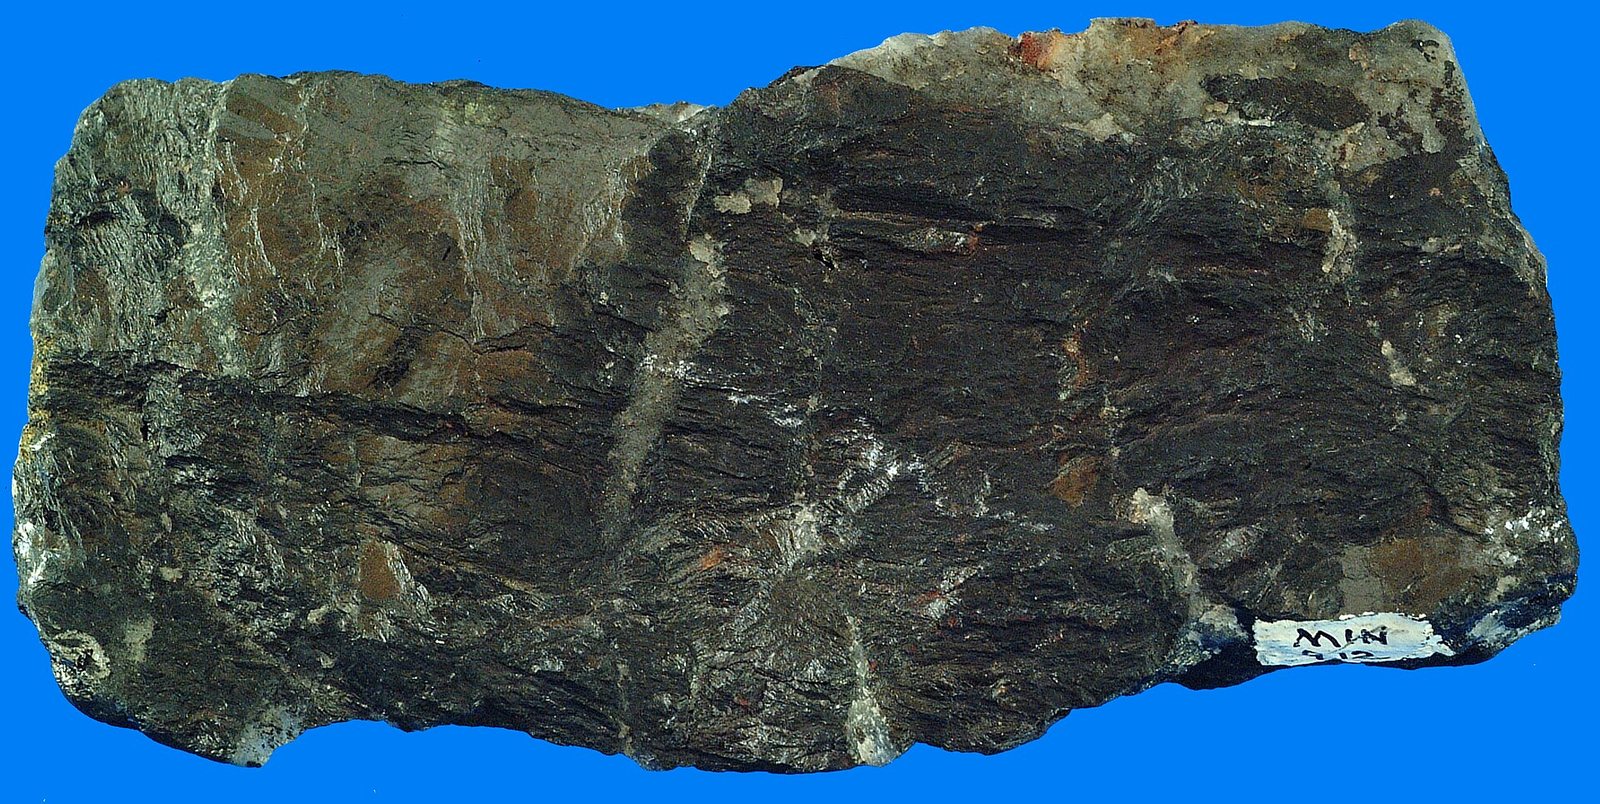
Wolframite
One of two tungsten ores; the classic vein mineral of granite-hosted systems.
Кто производит
Посмотреть на карте →Mine production
Mine productionmetric tons 2025 (оценочный) Мировой итог 85,000 metric tons
USGS Mineral Commodity Summaries 2026 · Mine production of contained tungsten, from wolframite and scheelite ore. · источник ↗
Прокрутите таблицу вправо, чтобы увидеть остальные столбцы.
| Страна | Производство | Доля мирового |
|---|---|---|
| China | 67,000 | 78.8% |
| Vietnam | 3,000 | 3.5% |
| Other countries | 2,400 | 2.8% |
| Kazakhstan | 2,400 | 2.8% |
| Korea, North | 2,000 | 2.4% |
| Russia | 2,000 | 2.4% |
| Bolivia | 1,700 | 2.0% |
| Rwanda | 1,300 | 1.5% |
| Australia | 1,000 | 1.2% |
| Austria | 840.0 | 1.0% |
| Spain | 800.0 | 0.9% |
| Portugal | 700.0 | 0.8% |
| United States | Zero | — |
| Мировой итог | 85,000 | 100% |
«Withheld» означает, что USGS скрыл данные во избежание раскрытия сведений об отдельной компании, — это не равнозначно нулю. Суммы по строкам стран не всегда совпадают с мировым итогом, поскольку источник округляет каждый показатель независимо и не всегда выделяет строку «прочие страны» отдельно.
Кто располагает запасами
Reserves
Reservesmetric tons 2025
USGS Mineral Commodity Summaries 2026 · источник ↗
| Страна | Запасы | Доля мирового |
|---|---|---|
| China | 2,500,000 | 53.2% |
| Other countries | 950,000 | 20.2% |
| Australia | 570,000 | 12.1% |
| Russia | 400,000 | 8.5% |
| Vietnam | 170,000 | 3.6% |
| Spain | 66,000 | 1.4% |
| Korea, North | 29,000 | 0.6% |
| Austria | 10,000 | 0.2% |
| Portugal | 3,400 | 0.1% |
| Rwanda | Not applicable | — |
| United States | Not applicable | — |
| Bolivia | Not applicable | — |
| Kazakhstan | Not applicable | — |
| Мировой итог | >4,700,000 | 100% |
Источник публикует этот мировой итог как интервальную оценку, а не точное значение, поэтому доли в последнем столбце также являются интервальными оценками.
Цена
concentrate, average in-warehouse Rotterdam, dollars per dry metric ton unit of tungsten trioxide
Среднегодовое значениеdollars per dry metric ton unit
Основание: concentrate, average in-warehouse Rotterdam, dollars per dry metric ton unit of tungsten trioxide. Среднегодовые значения в том виде, в каком опубликованы в USGS Mineral Commodity Summaries 2026 · источник ↗. Приведены справочные годовые средние значения, а не котировки текущего рынка.
Где перерабатывается и рафинируется
| Предприятие | Тип | Стадия | Страна | Роль |
|---|---|---|---|---|
| Samsung Pyeongtaek Campus | Производство полупроводников | Компонент | South Korea | Входные данные |
| TSMC Fab 18, Tainan | Производство полупроводников | Компонент | Taiwan | Входные данные |
Для чего применяется
Все конечные рынки →| Конечный рынок | Что он делает там | Значимость |
|---|---|---|
| Semiconductors | Contacts and vias | Определение |
| Aerospace & Defence | Penetrators and counterweights | Важно |
Сколько этого материала требует технология
| Технология | Количество | Котируется | Основание |
|---|---|---|---|
| Leading-Edge Logic Chip Grams per wafer. | следовые количества | per 300 mm wafer | Contacts and vias |
Indicative range compiled from published technology studies and chemistry; verify against a manufacturer specification before use. Запустите эти расчёты в любом масштабе в калькуляторе материалов →
Экспортный контроль
| Страна | Контроль | Применяется к |
|---|---|---|
| China | Export licensing requirement for materials and technologies | Antimony (2024), bismuth (2025), synthesized diamond (2025), gallium (2023), germanium (2023), graphite (2023), indium (2025), magnesium materials (2024), molybdenum (2025), rare earths (2025), silver (2026), tellurium (2025), tungsten (2025), and items related to lithium batteries and artificial graphite anode materials (2025). ↗ |
| Russia | Export ban | Steel waste and scrap, tungsten scrap, and enriched uranium (2022). ↗ |
USGS Mineral Commodity Summaries 2026, table 4 — controls in effect as of January 2026, excluding controls since lifted.